Publisher’s version / Version de l'éditeur:
Vous avez des questions? Nous pouvons vous aider. Pour communiquer directement avec un auteur, consultez la première page de la revue dans laquelle son article a été publié afin de trouver ses coordonnées. Si vous n’arrivez Questions? Contact the NRC Publications Archive team at
[email protected]. If you wish to email the authors directly, please see the first page of the publication for their contact information.
https://publications-cnrc.canada.ca/fra/droits
L’accès à ce site Web et l’utilisation de son contenu sont assujettis aux conditions présentées dans le site LISEZ CES CONDITIONS ATTENTIVEMENT AVANT D’UTILISER CE SITE WEB.
Client Report (National Research Council of Canada. Construction), 2015-01-22
READ THESE TERMS AND CONDITIONS CAREFULLY BEFORE USING THIS WEBSITE.
https://nrc-publications.canada.ca/eng/copyright
NRC Publications Archive Record / Notice des Archives des publications du CNRC : https://nrc-publications.canada.ca/eng/view/object/?id=78f47a7e-0cc5-418f-bb43-461a6c102ffd https://publications-cnrc.canada.ca/fra/voir/objet/?id=78f47a7e-0cc5-418f-bb43-461a6c102ffd
NRC Publications Archive
Archives des publications du CNRC
For the publisher’s version, please access the DOI link below./ Pour consulter la version de l’éditeur, utilisez le lien DOI ci-dessous.
https://doi.org/10.4224/21277596
Access and use of this website and the material on it are subject to the Terms and Conditions set forth at
Full scale exterior wall test on Nordic cross-laminated timber system
FULL SCALE EXTERIOR WALL TEST ON
NORDIC CROSS-LAMINATED TIMBER SYSTEM
Author
Eric Gibbs
Author
Joseph Su, Ph.D.
Approved
Program Leader, Cameron McCartney
Mid-Rise Wood Buildings, NRC-Construction
Report No.
A1-006009.1
Report date: January 22, 2015
Contract No. A1-006009
Reference:
Program:
Mid-Rise Wood Buildings
21 Pages
Copy No. 1 of 5 copies
This report may not be reproduced in whole or in part without the written consent of both the client and the National Research Council of Canada.
FULL SCALE EXTERIOR WALL TEST ON NORDIC CROSS-LAMINATED TIMBER SYSTEM
Eric Gibbs and Joseph Su Fire Safety
Construction Portfolio National Research Council Canada
INTRODUCTION
This report describes a full-scale exterior wall fire test conducted on December 16, 2014 on a Nordic cross-laminated timber (CLT) wall system. The test was conducted in accordance with CAN/ULC-S134-13, Standard Method of Fire Test of Exterior Wall Assemblies.
TEST FACILITY
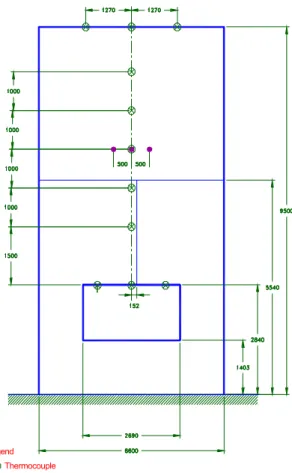
The test was conducted using the exterior wall fire test facility (see Figures 1 and 2) located in the Burn Hall of the NRC Fire Laboratory, Mississippi Mills, Ontario.
The burn room portion of the apparatus consisted of a reinforced concrete floor, concrete block walls and a precast concrete panel ceiling. The walls and ceiling were covered on the room side with 25 mm thick ceramic fiber insulation. The floor was covered with 57 mm thick fired clay paving stones. The inside dimensions of the burn room were 5.95 m wide, 4.4 m deep and 2.75 m high.
The fuel source in the burn room consisted of four 3.8 m long linear propane burners spaced equally along the width of the room and mounted 0.6 m above the surface of the paving stones (see Figure 3).
Legend Thermocouple
Heat flux meter All dimensions in mm
Figure 1. Test facility (front view).
Figure 2. Test facility (side view).
4400 2750 3000 1300 2400 1300 1300 Mast Wall Sample 2100
Figure 3. Propane burners and room thermocouples.
DESCRIPTION OF SPECIMEN
The CLT wall system was assembled to represent a continuous solid wood wall covered by a water barrier membrane and insulation.
The wall was assembled as follows for the test:
1. 15.9 mm thick Type X gypsum board on the test facility
2. 3 Ply, 105 mm thick Cross Laminated Timber wall panels manufactured by Nordic, including Glulam header (CLT wall panels can be thicker than the panels used. However, a thickness of 105 mm was considered adequate for this
testing.)
3. BlueSkin self-adhesive membrane attached to the CLT panels as a water resistant barrier
4. 89 mm Horizontal Z-Bar at 600 mm spacing 5. 89 mm Roxul Cavity Rock DD insulation
6. 19 mm Vertical Hat Channel at 600 mm spacing
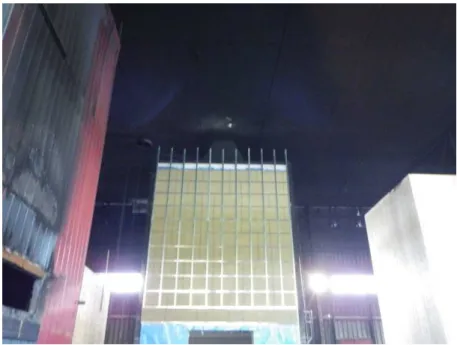
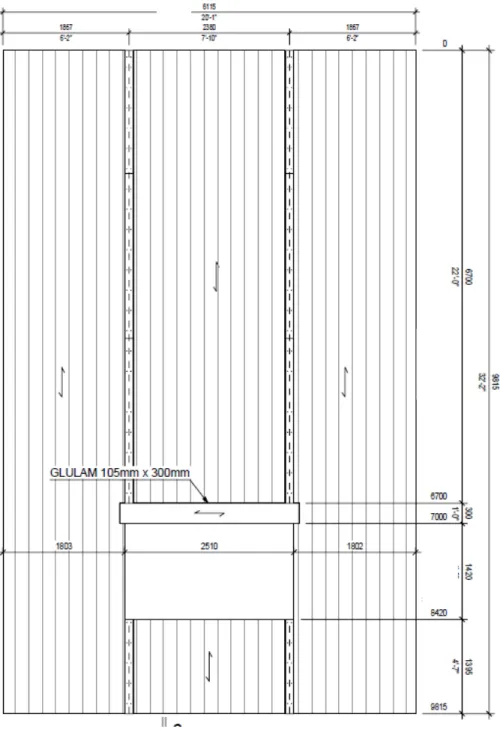
The CLT assembly consisted of 4 panels of varying sizes and one laminated header (see Figure 6). The vertical CLT joints were connected using 12.7 mm thick, 120 mm wide plywood strips glued on each side of the joint with lines of 6 mm wide polyurethane construction adhesive and nailed on each side every 300 mm with common 76 mm metal nails. The full test specimen was 9.8 m high and 6.0 m wide, with a window opening 2.51 m wide and 1.42 m high. The edges of the wall assembly at the window opening were covered with galvanized steel flashing followed by a layer of 25 mm thick ceramic fiber insulation. The CLT panels incorporated a horizontal joint at 0.3 m above the window (top of Glulam Header). It also included two vertical joints, aligned with the window edges, which extended to the top of the wall (see Figure 6).
A final layer of non-combustible cladding can be attached to the vertical Hat Channels to achieve various architectural finishes in actual applications. However, an exterior
non-combustible exterior cladding would provide additional protection for the wall assembly and, therefore, if the wall assembly met the requirements in Article 3.1.5.5. of the 2010 NBC without an exterior cladding, it would also meet the requirements with a non-combustible cladding.
Figure 4. Wall system under construction.
INSTRUMENTATION
Room Temperatures – The burn room air temperature was monitored by six Type K thermocouples, enclosed in 6 mm outside diameter Inconel sheaths. The thermocouples were introduced through the side walls with the measuring tips 0.6 m from the inner surface of the wall. All room thermocouples were located on the vertical centerlines of the side walls (see Figure 3).
Window Temperatures – The temperature of the flames emerging from the window was measured with three Type K, bare-beaded thermocouples installed 0.15 m below the top of the window opening, on the vertical centerline of the opening and 0.4 m from the sides of the opening (see Figure 1).
Wall Temperatures – The wall temperatures were monitored using Type K bare-beaded thermocouples on the vertical centerline of the wall. They were located five levels above the top of the window at 1.0 m intervals, starting at 1.5 m above the window opening (see Figures 1 and 7). Three thermocouples were used at each level, one was tension mounted on the exterior surface of the Roxul insulation, the second was
fastened to the vapor barrier and the third was on the surface of the 15.8 mm drywall.
Tension mounted TC and heat-flux transducer
Figure 7. Wall thermocouple installation.
The temperature at the top of the test assembly was monitored by three Type K bare-beaded thermocouples located 0.1 m out from the exterior surface of the wall, one on the centerline of the wall, and the other two at a distance of 1.3 m from both edges of the wall (see Figure 1).
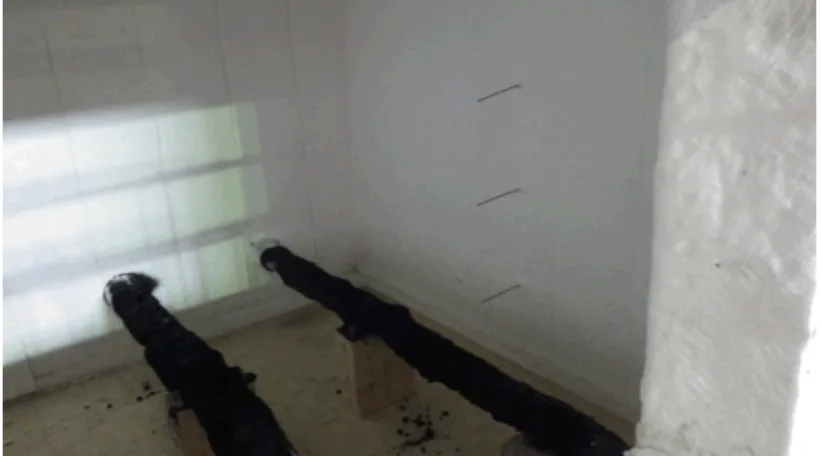
Heat Flow – The total heat flux density to the wall above the window was monitored by three water-cooled heat flux transducers (Medtherm Corp. Series 64) installed in the test wall, 3.5 m above the top of the window, one on the centerline of the wall and one on each side, 0.5 m from the centerline (see Figures 1 and 8).
Figure 8. Heat flux transducers.
Radiant heat emitting from the fire was also monitored by heat flux transducers (Medtherm Corp. Series 64) installed on a mast (Figure 2), placed 3.0 m from the test wall opposite to the centerline of the wall. The heat flux transducers were located at distances of 2.1 m, 3.4 m, 4.7 m and 6.0 m above the level of the burn room floor. An additional heat flux transducer was installed on the mast at the 4.0 m height and 2.4 m from the face of the wall.
Propane – The propane gas flow rate to the burners was monitored with a mass flow meter.
Visual Records – Video records of the front and side views were made during the test and digital photos were taken before, during and after the test.
Data Acquisition – All thermocouples, as well as the heat flux transducers, were connected to a data acquisition system and readings were recorded at 5 s intervals.
ATMOSPHERIC CONDITIONS
At the time of the test, the ambient temperature in the Burn Hall was 1.3°C and the relative humidity was 41%.
TEST PROCEDURE
The test procedure was in accordance with CAN/ULC-S134-13, Standard Method of Fire Test of Exterior Wall Assemblies. The pilot burners were lit prior to the commencement of the test. Gas flow to the burners was manually adjusted to follow the prescribed heat input required by the standard.
VISUAL OBSERVATIONS
(min:sec) 00:00 Ignition
02:10 Flames are reaching the ceiling of the chamber
03:46 Flames are reaching 1.0 m above the window opening 04:28 Flames are reaching 2.0 m above the window opening 05:00 Steady state gas flow
07:34 Flames are reaching 2.5 m above the window opening 08:51 No change
10:19 No visible damage to assembly
12:35 Small flames are appearing on the upper window edge 13:43 Crackling is heard
16:29 Small fires on window edge at south and north quarter points 17:46 Small fire developing at centerline above window
18:52 Crackling is heard 20:00 Gas reduction begins
20:48 Small fires still present on the upper window edge
24:06 Fire is present under the flashing at the upper south corner 25:00 Gas input is off
25:14 Other than soot and warped flashing, there is no apparent damage to the assembly
32:04 Flames above the window have extinguished. Smoke is still present. The fire at the south corner of the window opening is still burning
44:44 The flashing at the upper south corner of the window opening is glowing red 59:00 No open flames present, only smoke
RESULTS
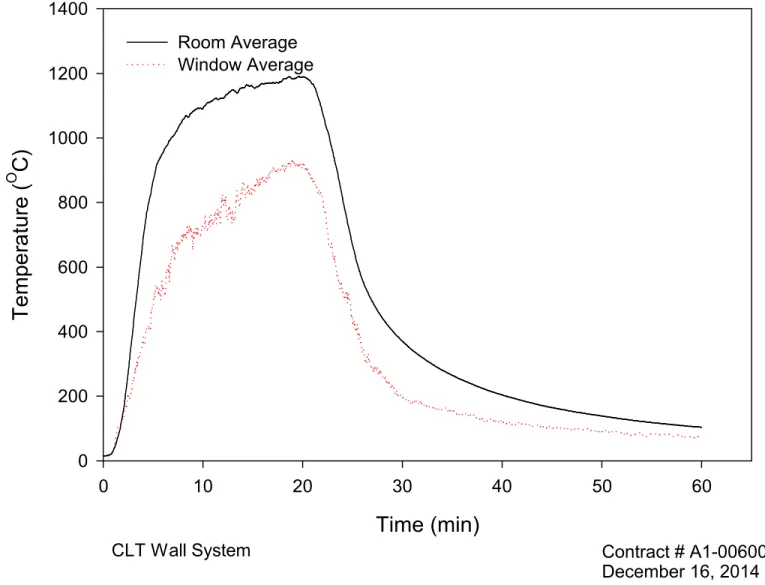
Room Temperatures – Figure 9 shows the average gas temperature in the burn room (average of six thermocouples).
Window Temperatures – Figure 9 shows the average temperature of the fire gases emerging from the window.
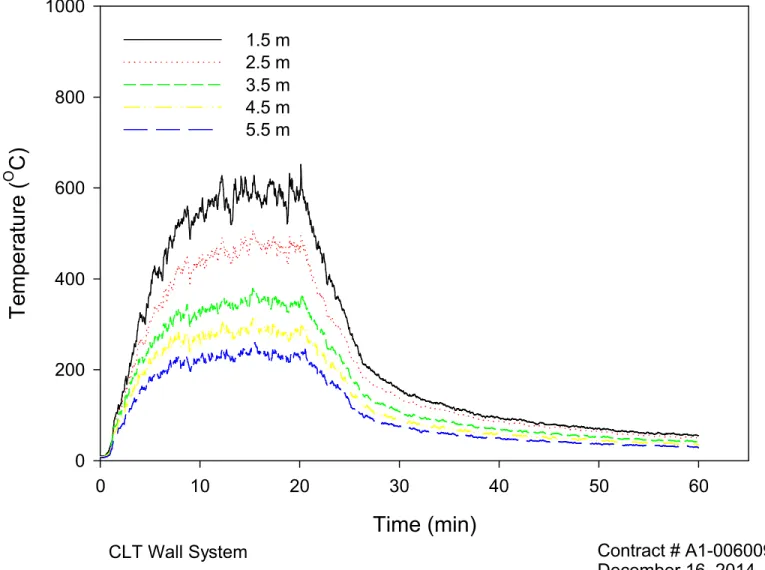
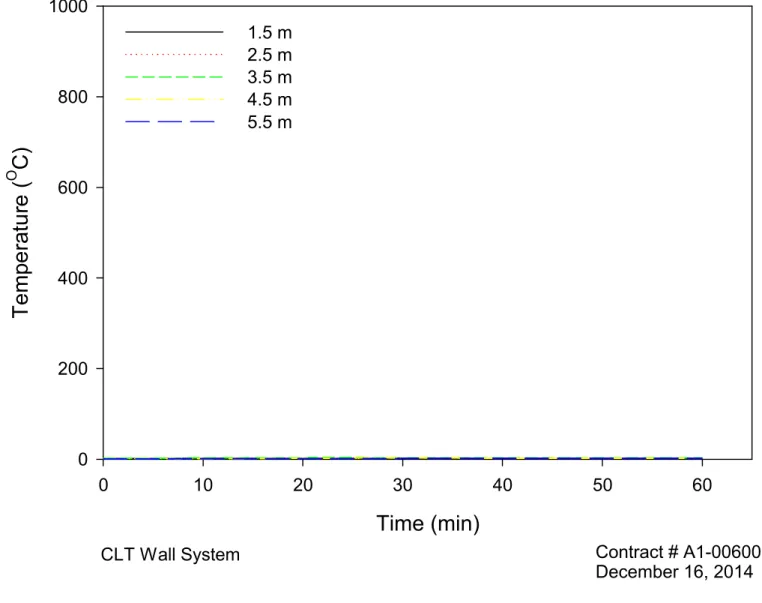
Wall Temperatures – The temperatures recorded on the outer surface of the test assembly are shown in Figure 10. A maximum temperature of 652°C was recorded at 1.5 m above the window opening. The maximum temperatures at 2.5 m, 3.5 m, 4.5 m and 5.5 m above the window opening were 508°C, 379°C, 315°C and 260°C,
respectively.
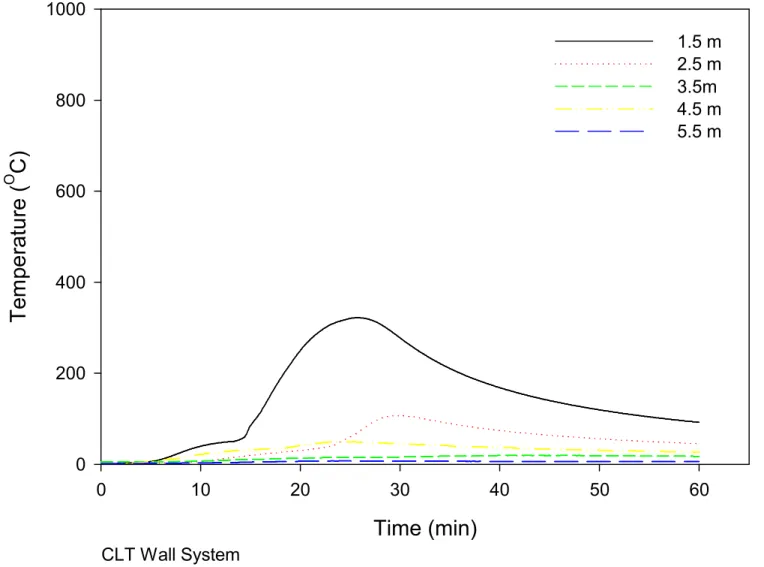
The temperatures recorded by the thermocouples installed on the vapor barrier are shown in Figure 11. The maximum temperatures at 1.5 m, 2.5 m and 3.5 m above the window opening were 322°C, 107°C and 50°C, respectively. The thermocouples at 4.5 m and 5.5 m showed no significant increase in temperature.
Temperatures recorded by the thermocouples on the surface of the 15.8 mm drywall are shown in Figure 12. There was no significant increase in temperature.
The temperatures measured at the top of the wall are shown in Figure 13. The temperatures at the top of the wall reached a maximum of 177°C.
Heat Flux – The total heat flux density to the wall, as measured 3.5 m above the top of the window, is shown in Figure 14. The data shown in this figure has been
smoothed using the procedure of a running average over one minute.
The maximum one-minute averaged values recorded at the 3 locations: the centre, the south, and the north were 20.54 kW/m2, 13.4 kW/m2and 17.45 kW/m2, respectively.
The heat flux densities measured by the heat flux transducers installed on the mast are shown in Figure 15. The heat flux at the 2.1 m height reached 17.8 kW/m2, at the 3.4 m height it reached 14.0 kW/m2, at the 4.7 m height it reached 6.0 kW/m2and at the 6.0 m height it reached 3.8 kW/m2. The heat flux density at 2.4 m from the wall at the 4.0 m level reached 9.9 kW/m2.
Time (min)
0 10 20 30 40 50 60T
e
m
pe
ra
tu
re
(
OC
)
0 200 400 600 800 1000 1200 1400 Room Average Window Average Contract # A1-006009 December 16, 2014 CLT Wall SystemTime (min)
0
10
20
30
40
50
60
T
em
pe
ra
tu
re
(
OC
)
0
200
400
600
800
1000
1.5 m
2.5 m
3.5 m
4.5 m
5.5 m
Contract # A1-006009
December 16, 2014
CLT Wall System
Time (min)
0
10
20
30
40
50
60
T
em
pe
ra
tu
re
(
OC
)
0
200
400
600
800
1000
1.5 m
2.5 m
3.5m
4.5 m
5.5 m
CLT Wall System
Time (min)
0
10
20
30
40
50
60
T
e
m
pe
ra
tu
re
(
OC
)
0
200
400
600
800
1000
1.5 m
2.5 m
3.5 m
4.5 m
5.5 m
Contract # A1-006009
December 16, 2014
CLT Wall System
Time (min)
0 10 20 30 40 50 60T
em
p
er
at
u
re
(
OC
)
0 50 100 150 200 NorthCentre South Contract # A1-006009 December 16, 2014 CLT Wall SystemTime (min)
0
10
20
30
40
50
60
T
o
ta
l H
ea
t
F
lu
x
(k
W
/m
2)
0
5
10
15
20
25
30
35
40
North
Centre
South
1 minute running average
Maximum reading: 20.54 kW/m
2CLT Wall System
Contract # A1-006009
December 16, 2014
Time (min)
0
10
20
30
40
50
60
T
ot
a
l H
e
at
F
lu
x
(k
W
/m
2)
0
5
10
15
20
25
30
6.0 m
4.7 m
4.0 m
3.4 m
2.1 m
Contract # A1-006009
December 16, 2014
CLT Wall System
PERFORMANCE OF THE WALL ASSEMBLY
A) Flame Spread over Exterior Face
Other than the fire underneath the flashing at the South upper corner of the window opening; the test was uneventful. The fire grew and receded at the prescribed pace without much change to its behavior or spread. The only apparent damage to the assembly after the test was soot deposits on the insulation and warped flashing around the window.
B) Incremental Radiant Heat Flow to the Wall above the Window Opening
The maximum one-minute averaged value of the total heat flux density on the test wall, at 3.5 m above the top of the window, was 20.54 kW/m2compared to 16 kW/m2 for a non-combustible wall (Marinite). This is less than the 35 kW/m2specified in
Sentence 3.1.5.5.(4) of the National Building Code of Canada (2010 Edition). C) Incremental Radiant Heat Flow at Target Mast
The average values of heat flux density at the target mast over the 15 min period of steady gas supply, as compared to a non-combustible wall (Marinite), were:
- at 2.1 m above the burn room floor, the average was 14.7 kW/m2 vs. 15.9 kW/m2 for the non-combustible wall
- at 3.4 m above the burn room floor, the average was 11.1 kW/m2vs. 11.2 kW/m2 for the non-combustible wall.
- at the 4.0 m level (2.4 m from the wall), the average was 7.8 kW/m2 vs. 8.2 kW/m2 for the non-combustible wall.
- at the 4.7 m level, the average was 4.7 kW/m2vs. 4.7 kW/m2for the non-combustible wall.
- at the 6.0 m level, the average was 2.8 kW/m2vs. 4.7 kW/m2for the non-combustible wall.
C) Damage to the Wall Assembly
Figure 16 shows the wall assembly during the fire exposure.
Figure 17 to Figure 20 are photographs taken after the fire test to show the extent of the damage to the wall sample. In order to observe if there was any fire damage to the CLT panels, the insulation was removed, and the water resistant barrier above the window opening was partially removed, after the fire test. As shown in the photographs, other than limited charring around the window opening and the Glulam header, there was no fire damage to the CLT panels and the water resistant barrier over CLT panels was still intact.
(a) 3 Minutes after ignition
(b) 10 Minutes after ignition
Figure 17. Wall sample after fire exposure.
Figure 18. Insulation partially removed (showing water resistant barrier
over CLT panels) after fire exposure.
Figure 19. Insulation fully removed (showing water resistant barrier over
CLT panels; small pieces of insulation still on the water resistant barrier)
after fire exposure.
Figure 20. Water resistant barrier above the window opening partially
removed (showing CLT panels; small pieces of insulation still on the water
REMARKS
1. The test facility and test method, as described in this report, conform to the
requirements of Article 3.1.5.5 of the 2010 edition of the National Building Code of Canada. The test was conducted in accordance with CAN/ULC S134-13, Standard Method of Fire Test of Exterior Wall Assemblies.
2. The extent of damage on the specimen was limited to the insulation above the window to a height of 2.5 m and charring around the window opening and the Glulam header during the fire exposure. There was no fire damage to the CLT panels.
3. During the fire exposure, there were flames up to the 2.5 m mark. This is less than the 5 m limit for flame spread distance specified in Sentence 3.1.5.5.(3) and defined in Appendix A (A-3.1.5.5.(3)) of the 2010 edition of the National Building Code of Canada.
4. The maximum one-minute averaged value of the total heat flux density on the test wall, at 3.5 m above the top of the opening during the fire exposure was
20.54 kW/m2. This is less than the 35 kW/m2specified in Sentence 3.1.5.5.(4) of the 2010 edition of the National Building Code of Canada.
5. Although an exterior cladding system was not included in the test assembly, a noncombustible exterior cladding would provide additional protection for the wall assembly tested and, therefore, this wall assembly with a noncombustible cladding would also meet the requirements in Article 3.1.5.5. of the 2010 NBC.
REFERENCE
1. CAN/ULC S134-13, Standard Method of Fire Test of Exterior Wall Assemblies, Underwriters’ Laboratories of Canada, Scarborough, ON, 2013.