arXiv:1612.07626v1 [astro-ph.HE] 22 Dec 2016
Multicolour modelling of SN 2013dx associated with GRB 130702A
∗
A. A. Volnova,
1⋆M. V. Pruzhinskaya,
2,3†, A. S. Pozanenko,
1,4,5S. I. Blinnikov,
6,7,8P. Yu. Minaev,
1O. A. Burkhonov,
9A. M. Chernenko,
1Sh. A. Ehgamberdiev,
9R. Inasaridze,
10M. Jelinek,
11G. A. Khorunzhev,
1E. V. Klunko,
12Yu. N. Krugly,
13E. D. Mazaeva,
1V. V. Rumyantsev,
14A. E. Volvach
141Space Research Institute, 84/32 Profsoyuznaya Street, Moscow 117997, Russia
2Lomonosov Moscow State University, Sternberg Astronomical Institute, Universitetsky pr., 13, Moscow, 119234, Russia
3Laboratoire de Physique Corpusculaire, Universit´e Clermont Auvergne, Universit´e Blaise Pascal, CNRS/IN2P3, Clermont-Ferrand, France 4National Research Nuclear University MEPhI (Moscow Engineering Physics Institute), 115409 Moscow, Russia
5Moscow Institute of Physics and Technology, 9 Institutskiy per., Dolgoprudny, Moscow Region, 141700, Russia 6Institute for Theoretical and Experimental Physics, Bolshaya Cheremushkinskaya ulitsa 25, 117218 Moscow, Russia 7All-Russia Research Institute of Automatics, Sushchevskaya ulitsa 22, 127055 Moscow, Russia
8Kavli Institute for the Physics and Mathematics of the Universe (WPI), The University of Tokyo Institutes for Advanced Study, The University of Tokyo, 5-1-5 Kashiwanoha, Kashiwa, 277-8583, Japan
9Ulugh Beg Astronomical Institute (UBAI) of the Uzbek Academy of Sciences, 33 Astronomicheskaya str., Tashkent, 100052, Uzbekistan 10Kharadze Abastumani Astrophysical Observatory, Ilia State University, Kakutsa Cholokashvili Ave 3/5 Tbilisi 0162, Georgia 11Astronomical Institute of the Czech Academy of Sciences, Friˇcova 298, 251 65 Ondˇrejov, Czech Republic
12Institute of Solar-Terrestrial Physics, Russian Academy of Sciences, Siderian branch, 664033, Irkutsk p/o box 291; Lermontov st., 126a, Russia 13Kharkiv National University, Institute of Astronomy, 35 Sumska Str., Kharkiv, 61022, Ukraine
14Crimean Astrophysical Observatory of the Russian Academy of Sciences, 298409, Crimea, Bakhchisaray region, Nauchny, Russia
∗Based on observations made with the Nordic Optical Telescope, operated on the island of La Palma jointly by Denmark, Finland, Iceland, Norway, and Sweden, in the Spanish Observatorio del Roque de los Muchachos of the Instituto de Astrofisica de Canarias.
Accepted XXXX. Received XXXX.
ABSTRACT
We present optical observations of SN 2013dx, related to the Fermi burst GRB 130702A oc-curred at a redshift z = 0.145. It is the second-best sampled GRB-SN after SN 1998bw: the observational light curves contain more than 280 data points in uBgrRiz filters until 88 day after the burst, and the data were collected from our observational collaboration (Maidanak Observatory, Abastumani Observatory, Crimean Astrophysical Observatory, Mondy Observa-tory, National Observatory of Turkey, Observatorio del Roque de los Muchachos) and from the literature. We model numerically the multicolour light curves using the one-dimensional radiation hydrodynamical codeSTELLA, previously widely implemented for the modelling of typical non-GRB SNe. The best-fitted model has the following parameters: pre-supernova star mass M = 25 M⊙, mass of a compact remnant MCR= 6 M⊙, total energy of the outburst
Eoburst = 3.5× 1052erg, pre-supernova star radius R = 100 R⊙, M56Ni= 0.2 M⊙ which
is totally mixed through the ejecta; MO = 16.6 M⊙, MSi= 1.2 M⊙, and MFe = 1.2 M⊙,
and the radiative efficiency of the SN is 0.1 per cent.
Key words: gamma-ray bursts: supernovae, Ib/c supernovae
1 INTRODUCTION
The observational association between long-duration gamma-ray bursts (GRBs) and Type Ib/c supernovae (SNe) has been
con-⋆ email: alinusss@gmail.com
† email: pruzhinskaya@gmail.com
firmed during last two decades, supporting the connection between GRBs and the death of massive stars (see, e.g., Hjorth & Bloom 2012). The first reliable association between a GRB and a SN was
that of GRB 980425 with SN 1998bw, at a redshiftz = 0.0085
(Galama et al. 1998; Iwamoto et al. 1998; Kulkarni et al. 1998). Since then about 40 supernovae associated with GRBs were dis-covered, and a half of them are spectroscopically confirmed (e.g.,
SN 2003dh, Mazzali et al. 2003; SN 2006aj, Ferrero et al. 2007; SN 2010bh, Bufano et al. 2011; SN 2013cq, Perley et al. 2014; SN 2013fu, Cano et al. 2014, Cano et al. 2016).
To determine the physical properties of the SN explosion
and/or of its progenitor (a mass of 56Ni, an ejecta mass Mej, a
total energy of the explosionEoburstetc.) detailed photometrical
and spectroscopic data are necessary. Due to the lack of observa-tions the most common way to estimate the physical parameters of GRB-SNe is to use some “classical” light curves and spectra of well-studied SNe as templates (e.g., Cano 2013). Most often the multicolour and bolometric light curves of SN 1998bw and 2003dh are used. However, this empirical method of modelling is based on rather simple assumptions about SN explosions, initial conditions and evolution (Arnett 1982).
In this paper we are modelling the multicolour light curves of SN 2013dx, associated with GRB 130702A, using the code
STELLA(Blinnikov et al. 1998, 2006). STELLA is a package of one-dimensional spherically symmetrical multi-group radiation hydrodynamics code which treats non-equilibrium radiative transfer according to chemical composition and inner structure of a pre-supernova star. The code has been used for light curve modelling of different types of SNe (Ia, Blinnikov et al. 2006; Ib/Ic, Folatelli et al. 2006; Tauris et al. 2013; IIb, Blinnikov et al.
1998; IIn, Chugai et al. 2004; IIP, Baklanov et al. 2005;
Tominaga et al. 2009). The assumptions about the supernova outburst geometry are also simple like in the empirical method, but the consideration of chemical abundances and distribution of different chemical elements inside a pre-supernova star allows one to calculate radiative transfer during the explosion and to build more physically correct modelled light curve.
With theSTELLAcode one can model many properties of the
SN explosion. Spectra calculated for every specific time since the explosion allow one to model the multicolour light curves and pho-tospheric velocities of the SN expanding envelope. The calculations take into account distribution of abundance of chemical elements in the envelope before the explosion, the interaction between the in-ner layers and the compact core, and so on. Another advantage of modelling is that it makes it possible to investigate a line-of-sight extinction by the circumburst medium by comparing modelled and observed light curves in various photometric filters.
The results from theSTELLAcode were found to be in a good
agreement with those from other well-known hydro-dynamic codes (e.g., Woosley et al. 2007; Kromer & Sim 2009; Sim et al. 2010; Kozyreva et al. 2017).
In Section 2 we present the observational data used for the modelling: we construct the detailed multicolour light curves us-ing original observations and published data. In Section 3 we ex-plain the process of SN light curve extraction. In Section 4 we
de-scribe the modelling procedure with theSTELLAcode and present
the properties of the model which best matched to the observed light curves of SN 2013dx. In Section 5 we discuss remaining un-resolved questions about the properties of both GRB 130702A and SN 2013x.
2 OBSERVATIONS
2.1 Detection of GRB 130702A / SN 2013dx
GRB 130702A (= Fermi trigger 394416326) triggered the Gamma-ray Burst Monitor (GBM; Meegan et al. 2009) and was observed by the Large Area Telescope (LAT; Atwood et al. 2009) aboard
the space observatory Fermi at 00:05:23.079UTon July 2, 2013
(Cheung et al. 2013; Collazzi & Connaughton 2013). Hereafter we
consider this time asT0, and all time intervals since the burst
trig-ger are referred ast. The burst has duration T90(the time during
which the cumulative counts increase from 5% to 95% above back-ground; Kouveliotou et al. 1993) of about 59 s in the GBM en-ergy range of 50–300 keV. Fermi/LAT detected more than 5
pho-tons above 100 MeV up tot = 2200 s, and the highest energy
photon is a 1.5 GeV event which was observed 260 s after the GBM trigger (Cheung et al. 2013). The best LAT location found
by Cheung et al. (2013) during on-ground analysis is:α = 216.◦4,
δ = +15.◦
8 (J2000), with an error radius of 0.◦
5 (90 per cent
con-tainment, statistical error only). This position is in4◦
from the best
GBM position (α = 218.◦81, δ = +12.◦25 with 1sigma
uncer-tainty of4◦
), and in0.◦
8 from the position of the optical afterglow
(OA) (Singer et al. 2013a).
The OA of GRB 130702A was discovered by the intermedi-ate Palomar Transient Factory (Law et al. 2009; Rau et al. 2009) with the Palomar 48-inch Oschin telescope (P48) (Singer et al. 2013a,b). The source was labelled as iPTF13bxl with coordinates
α = 14h29m14.s78, δ = +15◦46′26.′′4 (J2000). The OA is
lo-cated in the vicinity of two SDSS sources: a bright galaxy SDSS
J142914.57+154619.3, at a separation of7.′′6 and a faint source
SDSS J142914.75+154626.0 classified as a star in the catalogue,
at a separation of 0.′′6. The latter was suggested to be a galaxy
rather than a star, and to be the host galaxy of the burst in sub-sequent studies (Kelly et al. (2013); D’Elia et al. (2015), hereafter D15; Toy et al. (2016), hereafter T16).
The redshift of the OA was obtained based on the
detec-tion of H α, O II, and O III emission corresponding to z =
0.145 (Mulchaey et al. 2013a,b; D’Avanzo et al. 2013a). The
red-shift is consistent with that of one of the nearby bright galax-ies SDSS J142914.57+154619.3 measured spectroscopically by Leloudas et al. (2013). This allowed Kelly et al. (2013) to suggest that the host galaxy of GRB 130702A may be a dwarf satellite of an adjacent massive spiral galaxy.
The emerging supernova SN 2013dx associated with GRB 130702A was discovered photometrically about 6 days af-ter the burst trigger with the 2.5-m Nordic Optical Telescope (NOT) based on obvious brightening of the OA and colour evolu-tion unexpected for decaying afterglow (Schulze et al. 2013). Later the supernova was confirmed spectroscopically (Cenko et al. 2013; D’Elia et al. 2013) and got the name SN 2013dx.
2.2 Observations in gamma-rays
The burst was also observed by Konus-Wind and had a fluence of6.70+0.82
−0.80×10 −6
erg cm−2 in the 20–1200 keV energy range
(Golenetskii et al. 2013). The gamma-ray emission of the burst was also detected by SPI-ACS/INTEGRAL and GRNS/MESSENGER (Hurley et al. 2013).
We analysed GRB 130702A’s prompt emission in the gamma-ray domain using GBM/Fermi and SPI-ACS/INTEGRAL data. The light curve reveals two components in both SPI-ACS and GBM data. These components are the main episode of emission with du-ration of approximately 20 s and the extended emission with dura-tion up to 650 s (Fig. 1). The duradura-tion of the burst was calculated
in the energy range> 80 keV using SPI-ACS data and found to
beT90= 545 ± 60 s. An off-axis angle in SPI-ACS of the GRB
130702A is69◦
and is close to an optimal for detection.
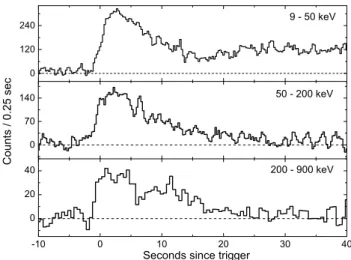
The light curve of the main emission component in three ergy channels of GBM is presented in Figure 2. In the soft
en-0,1 1 10 100 1000 0,1 1 10 100 1000 C o u n t s / 5 0 m s Seconds
Figure 1. Background subtracted light curve of GRB 130702A of SPI-ACS/INTEGRAL (open circles, energy range 80–10000] keV) and GBM/Fermi (crosses, energy range 9–900 keV). Dashed line represents the fit of main emission component by the exponential model (Norris et al. 2005). Time in seconds since burst prompt phase is presented. The flux in counts is presented per 50 ms time interval. GBM/Fermi light curve is mul-tiplied by a factor of 10 for clarity. The phase of extended emission and sharp cut-off in its end are clearly visible in both GBM and SPI-ACS light curves. -10 0 10 20 30 40 0 20 40 0 70 140 0 120 240 9 - 50 keV 200 - 900 keV 50 - 200 keV C o u n t s / 0 . 2 5 s e c
Seconds since trigger
Figure 2. Background subtracted light curve of GRB 130702A in three energy bands (GBM/Fermi). Time resolution is 0.25 s for 9–50 keV and 50–200 keV energy bands and 0.5 s for 200–900 keV energy band. The horizontal axis is time since the GBM trigger, while the vertical axis is the gamma-ray flux of every energy band.
ergy channel, 9–50 keV, the time profile has a smooth
FRED-like1shape. The initial rising part of the second extended emission
component is also visible, starting at approximately 15 s after the trigger. The extended emission in a hard energy channel is much weaker but it is also detectable up to 650 s after the trigger.
The spectral lag analysis was performed on GBM/Fermi data for the main episode of emission in the time interval from -5 to 20 s from the trigger. The lag was calculated using CCF method (Band
1 FRED stands for Fast Rise and Exponential Decay – the common shape
of GRB pulses. 10 -14 10 -13 10 -12 10 -11 1 10 100 -4 -2 0 2 4 F l u x , e r g / c m 2 / s t-T o, days R e s i d u a l s ,
Figure 3. Upper panel: the X-ray light curve in the range of 0.3–10 keV, obtained by Swift/XRT (black circles). The data beforet = 20 d were binned for better signal-to-noise ratio. The solid line is a BPL fit with the jet-break timetjb = 1.7 ± 0.2 d, and the slope after the break αX,2 =
−1.27 ± 0.02. Lower panel: the residuals of the fit.
1997) between the channels of 25–50 and 50–100 keV, and also between the channels of 25–50 and 100–300 keV. In both cases the
spectral lag is almost negligible (0.3 ± 0.3 and 0.5 ± 0.3 s,
re-spectively). According to Norris (2002) 80 per cent of long BATSE GRBs have the lag values less than 0.5 s between the channels of 25–50 and 100–300 keV.
Spectral analysis was performed for the main episode in the
time interval from -1.5 to 13 s after the trigger using rmfit2
and data from the BGO01, NaI06, NaI07 and NaI08 detectors of
GBM/Fermi. The energy spectrum is well fitted by a single
power-law model with index ofγ = −1.78 ± 0.02. The fluence of the
main emission episode in 10–1000 keV energy range is(6.17 ±
0.22) × 10−6
erg cm−2.
2.3 Swift-XRT observations
The ray counterpart of GRB 130702A was observed by the X-Ray Telescope (XRT; Burrows et al. 2005) aboard the Swift space observatory (Gehrels et al. 2004) starting from 89.1 ks after the
GBM trigger, i.e.t = 1.03 d (D’Avanzo et al. 2013b). The
ob-servations continued up to 225 d after the trigger3.
We downloaded the full X-ray light curve from the XRT Light Curve Repository (Evans et al. 2009) and fitted it with a bro-ken power law (BPL; see, e.g., Beuermann et al. 1999) the using non-linear least squares method by Markwardt (2009). The best
fit parameters are the following: slope before the break,αX,1 =
0.03 ± 0.26, slope after the break, αX,2= −1.27 ± 0.02 (Fig. 3,
upper panel), jet-break time,tjb= 1.7 ± 0.2 d after the burst
trig-ger, and sharpness of the break is fixed on 5, givingχ2
/DOF = 72/58. These parameters differ from those obtained by Singer et al. (2013b) because they used a restricted data set (the first 10 d instead of 225 d after the burst trigger) and fitted it with a single power law.
We will assume that the afterglow light curve is achromatic aftertb
between X-ray and optical band-passes and use our best fit X-ray
2 http://fermi.gsfc.nasa.gov/ssc/data/analysis/rmfit/ 3 http://www.swift.ac.uk/xrt_curves/00032876/
100 101 102 103 12 16 20 24 28 T − T0, days Magnitude z − 6 i − 4 r − 2 g B + 2 u + 4
Figure 4. The observed multicolour light curves of SN 2013dx connected with GRB 130702A. Filled and open circles depict the data presented in this work and collected from the literature, respectively (see Section 2.4.2). The supernova phenomenon is clearly seen in every filter. The afterglow component and the modelled supernova contribution inr filter are shown by the dashed and dotted lines, respectively (see Section 3 for details). The Galactic extinction is not taken into account.
light curve parameters to subtract the afterglow trend from the op-tical light curve of GRB 130702A.
The results of our fit and the known redshift allow us to es-timate the isotropic-equivalent energy release in the X-rays by in-tegrating the obtained BPL function from 1 d to 225 d after the
trigger:Eiso,X > 2.7 × 1050erg, and it is a lower limit because of
the absence of X-ray data beforet = 1.03 d.
2.4 Optical follow-up
2.4.1 Our observations
We started to monitor the field of GRB 130702A with 1.5-m AZT-22 telescope of Maidanak astrono1.5-mical observatory on July 3, 2013, i.e. one and a half days after the Fermi trigger
(Pozanenko et al. 2013). We took 6 frames in anR-filter with
expo-sures of 300 s each. The afterglow reported by Singer et al. (2013a) was clearly detected on a stacked frame. We continued the obser-vations of the afterglow and rising supernova taking several 300-s
frames inR-band on July 4-12, 14-16, 18, 19, 21, 23 and August
15, 18, 28. We also took observations inB-band taking frames with
the same exposures on July 7, 10, 12, 15.
The OA was observed by 0.7-m AS-32 telescope of Abas-tumani Astrophysical Observatory taking unfiltered images with exposures of 120 s on July 3, 4, 15 and 16. The 1-m Zeiss-1000 (Z-1000) telescope of Simeiz branch of the Crimean Astrophysical Observatory took several 120-s frames of the OA and emerging
su-pernova inB and R filters on July 13. The observations with this
instrument were continued on July 15-16 only inR filter with the
same exposures.
The 2.6-m Shajn telescope (ZTSh) of the Crimean Astrophys-ical Observatory observed of the OA taking 1-h set of 60-s images inR filter on July 5. The instrument also observed the decaying
supernova with 120-s frames taken on August 3 (B and R) and
August 4 (onlyR).
The late phase of supernova decay was observed by 1.5-m Russian-Turkish telescope (RTT-150) at Tubitak observatory on
August 28 (3 frames of 300 s inR-band) and by the 2.5-m Nordic
Optical Telescope (NOT) at Roque de los Muchachos Observatory on September 27-28.
We observed the host galaxy on May 28, 2014 with ZTSh
tak-ing 81 images inR filter and 54 images in B filter with exposures
of 60 s. However, the seeing in observations in R filter was not good enough to clearly separate the host galaxy flux from that of the neighbour big galaxy.
We also obtained images of the host galaxy on March 30, 2014 with the 1.5-m AZT-33IK telescope of the Sayan
observa-tory (Mondy) inR filter with total exposure of 2 h. The log of all
observations is presented in Table 1.
All our optical data were processed using NOAO’sIRAF
soft-ware package4. Standard image processing (bias, dark reduction,
flatfielding) was done using the taskccdproc. Some images were
combined in sums using the tasksimlintranandimcombine
to provide better signal-to-noise ratio. The aperture photometry was
done using theAPPHOTsubpackage, using an aperture radius of
twice the FWHM that measured for point sources on each night. The photometry is based on reference stars from SDSS-DR9 listed
in Table 2 (R and B magnitudes are transformed from ugriz
sys-tem using Lupton (2005) transformation equations5). The
unfil-tered data from Abastumani AS-32 telescope were calibrated
us-ing the sameR magnitudes and the additional correction constant
of+0.034 magnitudes determined by the spectral properties of the
AS-32 CCD and JohnsonR filter and calculated using numerous
optical observations of other GRB optical afterglows.
All the data reported in Table 1 supersede the data previously published in GCN circulars (NN 14988, 14996, 15003, 15243).
2.4.2 Data from other sources
We collected all available data on GRB 130702A and SN 2013dx observations, published up to now. We took 87 photometrical points
from D15 in uU gri filters and 192 points from T16 in g′r′i′z′
filters. We added 6 points from Singer et al. (2013b) inB filter but
due to the lack of numerical data in explicit form we estimated the corresponding values basing on the figure 3 of Singer et al. (2013b)
with the magnitude uncertainties0.m1.
We also adopted the host galaxy magnitudes obtained by T16
inu′g′r′i′z′
filters att = 632 d and in R filter at t = 330 d after
the trigger.
We convertedU values from D15 and our R magnitudes from
the Vega to the AB system and then tou and r, respectively,
us-ing methods from Blanton & Roweis (2007). We also converted all
magnitudes used for the light curves construction fromu′g′r′i′z′
tougriz system using SDSS photometric equations6
. The observed multicolour light curves of the GRB 130702A optical counterpart are presented in Fig. 4.
4 IRAF is the Image Reduction and Analysis Facility, a general
pur-pose software system for the reduction and analysis of astronomical data. IRAF is written and supported by the National Optical Astron-omy Observatories (NOAO) in Tucson, Arizona. NOAO is operated by the Association of Universities for Research in Astronomy (AURA), Inc. under cooperative agreement with the National Science Foundation. http://iraf.noao.edu/
5 http://classic.sdss.org/dr6/algorithms/sdssUBVRITransform.html#Lupto 6 http://classic.sdss.org/dr7/algorithms/jeg_photometric_eq_dr1.html
Table 1. Log of our observations. All magnitudes are in AB system and not corrected for Galactic extinction.
Date UTstart T0+ Telescope Filter Magnitude
2013-07-03 17:38:18 1.7083 AZT-22 R 18.88 ± 0.04 2013-07-03 17:40:00 1.7554 AS-32 Clear 18.89 ± 0.03 2013-07-04 16:49:20 2.6743 AZT-22 R 19.43 ± 0.04 2013-07-04 19:32:52 2.7864 AS-32 Clear 19.33 ± 0.07 2013-07-05 16:25:11 3.6592 AZT-22 R 19.79 ± 0.02 2013-07-05 20:23:21 3.8377 ZTSh R 19.86 ± 0.02 2013-07-06 16:20:12 4.6540 AZT-22 R 19.89 ± 0.03 2013-07-07 16:45:34 5.6716 AZT-22 R 20.01 ± 0.04 2013-07-08 16:49:14 6.6759 AZT-22 R 19.99 ± 0.05 2013-07-09 16:50:52 7.6770 AZT-22 R 19.91 ± 0.04 2013-07-10 17:31:29 8.6931 AZT-22 R 19.83 ± 0.03 2013-07-11 16:50:14 9.6644 AZT-22 R 19.80 ± 0.03 2013-07-12 17:19:13 10.6846 AZT-22 R 19.78 ± 0.03 2013-07-13 20:26:12 11.8144 Z-1000/CrAO R 19.71 ± 0.04 2013-07-14 17:08:02 12.6768 AZT-22 R 19.70 ± 0.04 2013-07-15 16:44:09 13.6602 AZT-22 R 19.69 ± 0.04 2013-07-15 19:23:12 13.7853 AS-32 Clear 19.65 ± 0.06 2013-07-15 19:41:31 13.7988 Z-1000/CrAO R 19.69 ± 0.04 2013-07-16 17:25:47 14.6891 AZT-22 R 19.65 ± 0.05 2013-07-16 21:08:17 14.8524 Z-1000/CrAO R 19.68 ± 0.07 2013-07-16 21:30:57 14.8678 AS-32 Clear 19.58 ± 0.07 2013-07-18 16:56:54 16.6691 AZT-22 R 19.62 ± 0.04 2013-07-19 16:54:58 17.6677 AZT-22 R 19.74 ± 0.04 2013-07-21 17:29:40 19.6918 AZT-22 R 19.72 ± 0.05 2013-07-23 17:23:24 21.6875 AZT-22 R 19.75 ± 0.05 2013-08-03 19:40:37 32.7930 ZTSh R 20.70 ± 0.03 2013-08-04 18:55:51 33.7762 ZTSh R 20.71 ± 0.03 2013-08-15 11:43:16 44.4624 AZT-22 R 21.13 ± 0.12 2013-08-18 11:38:02 47.4688 AZT-22 R 21.44 ± 0.11 2013-08-28 11:48:54 57.4622 AZT-22 R 21.77 ± 0.07 2013-08-28 18:39:39 57.7404 RTT-150 R 21.83 ± 0.14 2013-09-27/28 20:02:28 88.3032 NOT R 22.40 ± 0.09 2014-03-30 18:48:51 271.7885 AZT-33IK R 22.66 ± 0.10 2014-05-28 18:59:39 361.7866 ZTSh R 22.71 ± 0.08 2013-07-07 17:18:43 5.6947 AZT-22 B 20.56 ± 0.08 2013-07-10 16:40:59 8.6581 AZT-22 B 20.46 ± 0.08 2013-07-12 17:52:31 10.7077 AZT-22 B 20.65 ± 0.07 2013-07-13 20:39:28 11.8607 Z-1000/CrAO B 20.51 ± 0.25 2013-07-14 17:29:51 13.6920 AZT-22 B 20.64 ± 0.06 2013-08-03 18:47:33 32.7642 ZTSh B 22.29 ± 0.07 2014-05-28 20:35:56 361.8417 ZTSh B 23.54 ± 0.20
Table 2. Reference stars from SDSS-DR9 used for the photometry.R and B magnitudes were obtained from ugriz data using Lupton’s 2005 transformation equations. N SDSS id u g r i z R B 1 J142915.86+154510.0 17.968 (0.012) 16.721 (0.004) 16.228 (0.004) 16.029 (0.004) 15.963 (0.007) 16.033 (0.013) 17.095 (0.013) 2 J142911.60+154535.2 19.808 (0.034) 17.303 (0.005) 15.920 (0.004) 15.261 (0.004) 14.933 (0.005) 15.576 (0.013) 17.935 (0.035) 3 J142922.06+154652.2 20.070 (0.043) 19.030 (0.009) 18.715 (0.009) 18.607 (0.011) 18.562 (0.030) 18.550 (0.020) 19.356 (0.045) 4 J142911.64+154807.2 18.994 (0.022) 17.390 (0.005) 16.800 (0.004) 16.565 (0.004) 16.433 (0.008) 16.591 (0.013) 17.813 (0.023) 5 J142923.79+154823.4 21.009 (0.084) 18.575 (0.007) 17.627 (0.006) 17.288 (0.006) 17.109 (0.011) 17.370 (0.015) 19.132 (0.085) 2.5 Radio observations
The afterglow of GRB 130702A was observed at mm-wavelengths with the Combined Array for Research in Millimeter Astronomy (CARMA) on 2013 July 4, i.e. 2 d after the trigger, at a frequency of 93 GHz (a wavelength of 3 mm) (Perley & Kasliwal 2013). A source coincident with the optical counterpart was discovered with
a flux density ∼2 mJy.
The afterglow was also observed by the Westerbork Syn-thesis Radio Telescope at 4.9 GHz 2.56-3.05 d after the burst
(van der Horst 2013). A radio source with a flux density of1.23 ±
0.04 mJy was detected at the position of the optical counterpart.
The radio counterpart was also observed with the Karl G.
Table 3. Summary of the GRB 130702A and its afterglow properties. Discovered by GBM/Fermi
T0 00:05:23.079UTon July 2, 2013
α, δ (GBM) 218.◦81, +12.◦25, 4◦radius (Collazzi & Connaughton 2013)
α, δ (LAT) 216.◦4, +15.◦8, 0.◦5 radius (Cheung et al. 2013)
T90(GBM) 59 s (Collazzi & Connaughton 2013)
T90(SPI-ACS) 545 ± 60 s
Highest energy 1.5 GeV (Cheung et al. 2013)
z 0.145 (Mulchaey et al. 2013a,b; D’Avanzo et al. 2013a) to jb 1.17 ± 0.09 d (Singer et al. 2013b) tX jb 1.7 ± 0.2 d α2 1.27 ± 0.02 Eiso,γ (6.6 ± 0.4) × 1050erg Eiso,X > 2.7 × 1050erg o- obtained using optical data;
X- obtained using X-ray data;
0 0.5 1 1.5 2 2.5 3 x 10⁴ 22 23 24 25 λ, ˚A Magnitide
Figure 5. The SED (line) of the host galaxy of GRB 130702A fitted by the Le Phare with fixed redshift. Filled circles depict the data points in u′g′r′i′z′JK
sfilters, respectively, taken from T16 and from ZTSh
ob-servations. Open circles show the model magnitudes for each filter.
(Corsi et al. 2013). The radio source was detected with a flux den-sity of 1.49 mJy at 5.1 GHz, and 1.60 mJy at 7.1 GHz.
We observed the position of the radio afterglow using the 22-m radio-telescope RT-22 of the Crimean Astrophysical observatory at 36 GHz on July 5 and 6, 2013, i.e. 3.69 and 4.68 d after the trigger.
At the position of the afterglow we obtained 2-σ upper limits of
0.6 mJy and 0.5 mJy respectively.
A summary of the GRB 130702A afterglow properties is col-lected in Table 3.
2.6 Host galaxy
Kelly et al. (2013) reported that GRB 130702A occurred in a dwarf
satellite of a massive galaxy at a redshift z = 0.145 and
pro-vided some physical properties of the galaxy using a SED based
on the SDSSugriz photometry. As input parameters we took the
u′g′r′i′z′JKs
magnitudes of the host galaxy from T16,B
magni-tude from ZTSh (see Table 1), and fixed redshift and fitted the SED
of the galaxy using the LEPHAREsoftware package (Arnouts et al.
1999; Ilbert et al. 2006). We used the PEGASE2 population syn-thesis models library (Fiok & Rocca-Volmerange 1997) to obtain the best-fitted SED and the main physical parameters of the galaxy:
Table 4. A summary of the GRB 130702A host galaxy properties, the mag-nitudes are in AB system corrected for the expected Galactic foreground extinction.
type irregular dwarf Mr −16.2m u′ host 24.32 ± 0.21 (T16) Bhost 23.39 ± 0.20 g′ host 23.52 ± 0.06 (T16) r′ host 23.05 ± 0.06 (T16) Rhost 23.17 ± 0.06 (T16) i′ host 22.96 ± 0.09 (T16) z′ host 22.97 ± 0.18 (T16) Jhost 23.15 ± 0.48 (T16) Ks,host > 22.28 (T16) Age 4.3 × 10⁹yr Mhost 1.3 × 10⁸M⊙ Ahost V ∼0 SF Rhost 0.05 M⊙/yr
age, mass, and star formation rate. The apparent magnitudes used for the fitting are listed in Table 4.
The host galaxy of GRB 130702A (χ2/DOF= 2.9/8) is fitted
by the SED of an irregular dwarf galaxy with the age of4.3×109
yr
and the mass ofMhost= 1.3 × 10⁸
M⊙, which is slightly higher
than the mass reported by Kelly et al. (2013). We also obtained the
negligible mean extinction in the hostAhost
V = 0 with the best
extinction law of the SMC (Pr´evot et al. 1984) and the star
forma-tion rate ofSF Rhost = 0.05 M⊙/yr. The two latter results are
in a good agreement with those of the previous studies (Kelly et al. 2013). The best fitted SED of the host galaxy is shown in Fig. 5. A summary of the host galaxy properties are collected in Table 4.
3 SN LIGHT CURVE
To construct a light curve of a SN associated with a GRB one needs to take into account the contribution from GRB OA, GRB host galaxy, and the light extinction in the Galaxy and in the host galaxy. First, all photometrical data of GRB 130702A were cor-rected for Galactic extinction using the extinction maps from
Schlafly & Finkbeiner (2011) withE(B − V ) = 0.038.
Second, the contribution of the host galaxy was eliminated by
flux subtraction. We used data from T16 forugriz filters (see
Sec-tion 2.4.2). For theB-filter we used the value calculated via Lupton
(2005) transformation equations fromugr values of T16.
To distinguish the optical afterglow from the SN we consid-ered the approximation by the broken power-law slope obtained from X-ray afterglow light curve (see Section 2.3) and assumed that the decay of the afterglow is achromatic from X-ray to optical domain after the jet-break (see Section 4.1 in T16), and thus we
fitted the optical data obtained betweentbandt = 4 d after the
trigger with a single power law with fixedαX = −1.27 (see
Sec-tion 2.3) and then subtracted calculated flux from all photometrical points.
T16 estimated the host extinction asAV = 0.13 ± 0.23 by
fitting the SED of the galaxy with a simple power-law model. This
value is consistent with zero within the 1-σ confidence interval,
moreover, our modelling of the host galaxy SED showed that the
mean host extinction is negligible, so we assumedAhost
V = 0 and
did not to take it into account for further modelling.
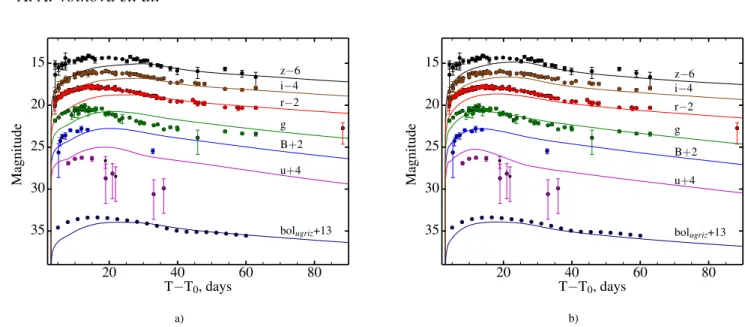
Finally, we converted all values to AB magnitudes and con-structed the optical light curves of SN 2013dx, which are shown in
20 40 60 80 T−T0, days 15 20 25 30 35 M ag n it u d e r−2 B+2 z−6 u+4 g i−4 bolugriz+13 −5 0 lo g X O Si Fe Ni56 10 15 20 25 m[M⊙] −10 −5 0 5 lo g (ρ / g cm − 3 ) a) b) 0 20 40 60 −1 0 1 2 3 T − T 0, days Magnitude g − i g − r 0 50 100 150 T−T0, days 0 20 40 60 80 P h o to sp h er ic v el o ci ty [1 0 0 0 k m · s − 1] model Toy et al., 2016 D’Elia et al., 2015 c) d)
Figure 6. a) The multicolour light curves of SN 2013dx. The Galactic extinction, the flux from the host galaxy and the optical afterglow contribution are excluded. Solid lines show the best model of the SN light curve obtained bySTELLA(see Section 4). The quasibolometric light curve of the SN in AB photometric system obtained as a sum of the fluxes inugriz filters, is marked as bolugriz. The data and model are in observer frame. b) The mass fraction
of O, Si, Fe, and56Ni in the ejecta and density profile for the optimal pre-supernova star model with respect to interior mass. The central region of 6M⊙ is taken away. c) Colour evolution of SN 2013dx. Points and lines show the variation of colour indexesg − i (red circles, red solid line) and g − r (green diamonds, green dashed line) with time for observations and optimal model, consequently. d) The evolution of photospheric velocities of SN 2013dx measured via observations (points) and calculated from the modelling (solid line). The plot is in observer frame.
Fig. 6a. We also constructed the quasibolometric light curve of the SN in the AB photometric system by taking the sum of the fluxes inugriz filters. We used the code by Ishida & de Souza (2013);
Ishida et al. (2014)7that adapts Gaussian Processes for
interpolat-ing the light curves. Due to the fact that the data coverage in theu
filter is less than the others, we had to interpolate theu light curve
between 20 and 35 d and to extrapolate aftert = 35 d. We assumed
that theu − g colour corresponding to the last day of observations
inu filter remains unchanged up to t = 60 d. The quasibolometric
light curve is also shown in Fig.6a.
7 https://github.com/emilleishida/snclass
4 MODELLING OF THE SN LIGHT CURVE
4.1 Modelling
The numerical multicolour light-curve calculations for SN 2013dx were performed with the one-dimensional multi-frequency
radia-tion hydrodynamics codeSTELLA(Blinnikov et al. 1998, 2006). In
the current calculations we adopted 100 zones for the Lagrangean coordinate and 130 frequency bins. As input parameters we varied
the pre-supernova star massM and radius R, the energy of the
out-burstEoburst, the mass of synthesized nickelM56Ni, the mass of
the resulting compact remnantMCR, and the the initial distribution
of chemical elements in the pre-supernova star.
The massMCRin the central part of a pre-supernova star with
a fixed radius (which is much less than the outer radius of the star) is treated as a point-like source of gravity which has a non-negligible influence on expansion of the innermost layers of
SN-20 40 60 80 T−T0, days 15 20 25 30 35 M ag n it u d e r−2 B+2 z−6 u+4 g i−4 bolugriz+13 20 40 60 80 T−T0, days 15 20 25 30 35 M ag n it u d e r−2 B+2 z−6 u+4 g i−4 bolugriz+13 a) b)
Figure 7. The result of modelling (lines) the observed light curves of the SN 2013dx (points) withMej = 3.1 M⊙, M56Ni = 0.37 M⊙, and EK = 8.2 × 1051erg corresponding to T16. Two different distributions of56Ni in the ejecta are considered: a) totally mixed, b) not mixed. The quasibolometric
light curve of the SN in AB photometric system obtained as a sum of the fluxes inugriz filters, is marked as bolugriz.
ejecta. The explosion is initiated by putting thermal energy to the innermost layers. The ejecta of SNe has the same chemical
com-position as pre-supernova star except for56Ni, because we do not
follow the explosive nucleosynthesis.56Ni can be put in the centre
of SN ejecta in the calculations as well as be spread out within any region.
The mass and radius of pre-supernova star for the model, which offers the best agreement with the observations of
SN 2013dx, isM = 25 M⊙ and R = 100 R⊙. The resulting
energy of explosion isEoburst = 3.5 × 1052
erg. A part of the outburst energy that went into the radiation from far IR to extreme
UV (in the range from6.3 × 1013
Hz, or 4.8µm, to 1.7 × 10¹⁶
Hz,
or 70 eV), i.e. bolometric energyEbolin time interval of 126 days
after the trigger was3.1 × 1049
erg. The0.2 M⊙ of56
Ni is to-tally mixed through the ejecta. The central region becomes a black
hole withMCR= 6M⊙. The parameters EoburstandM56Niwere
adopted from D15, the rest of the parameters were picked up to better match the observed light curve by the model.
Fig. 6a compares the optical (ugriz and B) light curves of the
model with the observations of SN 2013dx. From the observational
data inugriz filters, the quasibolometric light curve was also
de-rived and compared with the modelled one. The quasibolometric light curve of the SN in AB photometric system is obtained as a
sum of the fluxes inugriz filters. To match better the observational
and modelled light curves, the global time offset (3 days), i.e. a
si-multaneous time-shift of modelled light curves relative toT0, has
been applied. Fig. 6a shows that the modelled light curves match
adequately the observations fromz to g filters, especially for
qua-sibolometric one. However, in the blue filters (B and u) the model
and observations disagree. We discuss a possible nature of this
be-haviour in Section 5. Also we obtained the value oftpeak, which is
a time of maximum for quasibolometric modelled light curve
rela-tive to the trigger timeT0.
The distribution of chemical elements and density profile for a pre-supernova star are shown in Fig. 6b. It is worth noting, that the model shows a total absence of hydrogen and helium in the pre-supernova star composition which is common for Type Ic su-pernovae (Filippenko 1997).
In Fig. 6c we plot the colour evolution of the SN, and the Fig. 6d shows observer-frame photosperic velocities in compari-son with observational data obtained via spectroscopy by D15 and T16. The model evolution of the photospheric velocities is in good agreement with direct observations during the first ∼30 days af-ter the explosion. The summary of the SN 2013dx parameaf-ters is collected in Table 4.1. It also shows the comparison between the parameters of the SN obtained by other studies.
Following the description of supernova explosion
parame-ters in T16, we performed the LC modelling adoptingM56
Ni = 0.37 M⊙ (located in the centre of explosion and no mixing), EK= 8.2×1051
erg, andMej= 3.1 M⊙. In the current model we
assumed, following T16, that there is no compact object at all, i.e. no gravitational centre that affects the expansion of the innermost layers. Since in T16 it is written that the initial radius before
explo-sion is small, we putR = 10 R⊙. Fig. 7a represents the
compari-son between SN 2013dx observations andSTELLAmodel for T16
SN parameters. In the early phases the modelled light curves lie be-low the observational ones in all filters. Starting from ∼30 day after
the explosionz, i, r, and quasibolometric modelled light curves fit
well the observational data. We also made a model keeping abso-lutely the same parameters as in T16 but with nickel mixed totally in the ejecta as in our optimal model. The nickel mixing partly im-proved the increasing part of modelled light curves making them a bit more consistent with observations (see Fig. 7b). The global time offset (3 days) has been applied to all modelled light curves.
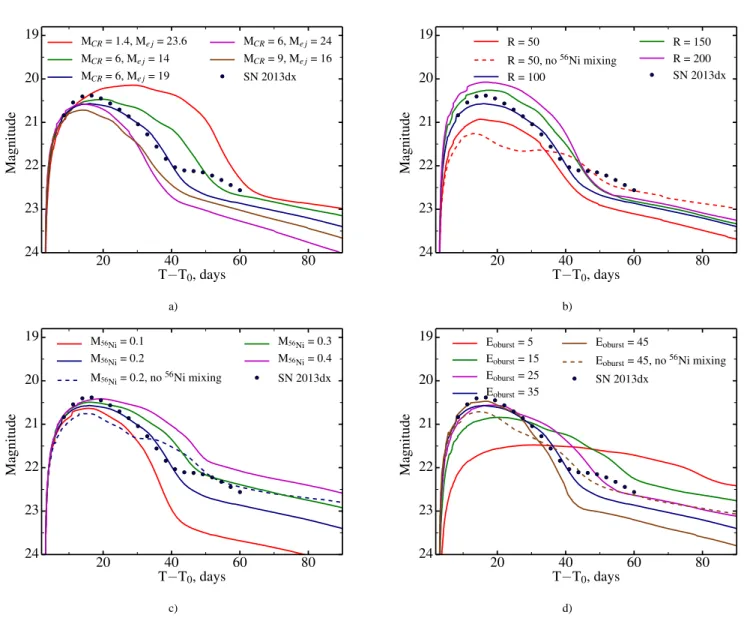
4.2 Influence of different initial parameters
In this section we consider the dependence of quasibolometric light curve from some input physical parameter of the model while the
others remain fixed. We varied the massM and the radius R of the
pre-supernova star, the mass of synthesized56Ni, and the energy
of the burstEoburst. All plots in comparison with observational
quasibolometric light curve are presented in Fig. 8.
Fig. 8a,b,c demonstrate that the ejecta mass affects the de-scending part of light curve, dependence of radius is stronger on the domes of light curve, however, the tail is mainly determined by
Table 5. A summary of the SN 2013dx parameters obtained bySTELLAin comparison with those of D15 and T16. All masses are inM⊙.
Parameter STELLAmodel D15 T16
M 25 ∼25 − 30a –
MCR 6 – –
Eoburst 3.5 × 1052erg ∼3.5 × 1052erg (8.2 ± 0.4) × 1051erg
Mej 19 ∼7 3.1 ± 0.1 R 100 R⊙ – – M56 Ni 0.2, totally mixed ∼0.2 0.37 ± 0.01 MO 16.6 – – MSi 1.2 – – MFe 1.2 – – Ebol 3.1 × 1049erg – – tpeak 14.35∗d 15 ± 1∗∗d 13.2 ± 0.3∗∗d a- mass of the progenitor on the main sequence
∗- on the bolometric light curve ∗∗- on the light curve in the filterr
56
Ni abundance. The models are brighter for higher ejecta or56Ni
mass, and larger radius. The decrease of the compact remnant mass provides wider maximum of the light curve. In Fig. 8b,c,d we also
present the models with the same amount of56Ni as our optimal
model (0.2M⊙) but with and without mixing through the ejecta.
When56Ni is mixed, the light-curve maximum is brighter.
More-over, the gamma photons from radioactive decay are not trapped inside an envelope and do not heat the ejecta. Therefore, a photo-sphere goes faster to the centre and the SNe becomes dimmer on the tail.
Decreasing the outburst energy makes the diffusion time of gamma-photons from radioactive decay longer. This manifests it-self as a widening of the light curve, moreover, the diminution of decline rate occurs later (see Fig. 8d). Approximate limits of the main model parameters can be derived based on the Figure 8. The
pre-supernova star mass and radius varies in the range 23–27M⊙
and 75–125R⊙, respectively; the56Ni mass lies between 0.15 and
0.25M⊙; and the explosion energyEoburst— in the range of (30–
40) ×1051erg.
5 DISCUSSION
5.1 The nature of the extended emission of GRB 130702A
In the Section 2.2 we mentioned the extended emission of the GRB 130702A observed in gamma-rays, and now we would like to dis-cuss its possible nature.
The main component in SPI-ACS data has a smooth shape which can be fitted with an exponential function (Norris et al. 2005). The extended emission in both GBM and SPI-ACS data looks like a plateau with a cut-off at about 650 s after the trigger. This component could be connected with a rapidly spinning mag-netar activity, which was initially formed during a core collapse
stage. It is clear that the mass of a compact remnant6 M⊙ (see
Section 4) is more than Oppenheimer-Volkoff limit, and the cut-off may be a manifestation of a delayed collapse into a black hole of a spun-down magnetar (Vietri & Stella 1998; Lyons et al. 2010), which is already proposed for the explanation of the extended emis-sion phase of some GRBs (e.g., De Pasquale et al. 2016).
Alternatively, the source of a prompt emission can be a neu-trino heated jet (MacFadyen & Woosley 1999). Later, if an accre-tion rate is high enough, an activaaccre-tion of Blandford-Znajek jet
(Komissarov & Barkov 2009) can be a source of a high energy ex-tended emission (Barkov & Pozanenko 2011). An emission cut-off could be explained by a rapid decrease of the accretion rate. The latter scenario is less plausible because of high radius of a pre-supernova star and consequently large size of an accretion disc. Detailed analysis of the extended emission of GRB 130702A will be presented elsewhere (Minaev et al., in preparation).
5.2 The Amati relation
Assuming a power-law model to be valid down to 1 keV (see
Section 2.1), we found the fluence of the burst to be (1.31 ±
0.08) × 10−5
erg cm−2in the energy range 1–10000 keV.
Assum-ingz = 0.145 and a standard cosmology model with H0 = 69.6
km s−1 Mpc−1, ΩM = 0.286, ΩΛ = 0.714 (Wright 2006;
Bennett et al. 2014), the isotropic energy release in 1–10000 keV isEiso,γ = (6.6 ± 0.4) × 1050erg in a GRB rest frame.
Almost all long GRBs followEpeak×(1 + z) − Eiso
re-lation (Amati et al. 2002). If we assume that GRB 130702A also
follows the Amati relation, then itsEpeak×(1 + z) parameter
value should be within 7–50 keV (± 2-σ coincidence level).
How-ever, the energy spectrum of GRB 130702A is well fitted by a
sim-ple power-law model with index ofγ = −1.78 ± 0.02 and does
not show presence of spectral break in energy range of 10–15000
keV. The value of the spectral index is typical forβ of Band
func-tion (Band et al. 1993) and may indicate thatEpeakis less than
lower limit of analysed energy range: median values of spectral pa-rameters obtained for GBM bursts see in tables 3-4 in (Gruber et al.
2014). Under this assumption we estimate upper limit ofEpeakto
be approximately 10 keV. In this case GRB 130702A will follow the Amati relation. Similar result was also obtained by Amati et al. (2013).
5.3 Late X-ray light curve
In Section 2.3 we have fitted the X-ray light curve of GRB 130702A with a BPL. There is an enhancement of the flux in the residu-als plot (see lower panel of Fig. 3). The flux of the enhancement,
integrated in the time interval of 5 − 15 d after the trigger, is
F+= (2.4 ± 0.6) × 10−12erg cm−2s−1, which is equivalent to
the luminosityL+
4π= (1.4 ± 0.3) × 10 43
erg s−1. Here we use the
20 40 60 80 T−T0, days 19 20 21 22 23 24 M ag n it u d e MCR= 1.4, Me j= 23.6 MCR= 6, Me j= 14 MCR= 6, Me j= 19 MCR= 6, Me j= 24 MCR= 9, Me j= 16 SN 2013dx 20 40 60 80 T−T0, days 19 20 21 22 23 24 M ag n it u d e R = 50 R = 50, no56Ni mixing R = 100 R = 150 R = 200 SN 2013dx a) b) 20 40 60 80 T−T0, days 19 20 21 22 23 24 M ag n it u d e M56Ni= 0.1 M56Ni= 0.2 M56Ni= 0.2, no56Ni mixing M56Ni= 0.3 M56Ni= 0.4 SN 2013dx 20 40 60 80 T−T0, days 19 20 21 22 23 24 M ag n it u d e Eoburst= 5 Eoburst= 15 Eoburst= 25 Eoburst= 35 Eoburst= 45 Eoburst= 45, no56Ni mixing SN 2013dx c) d)
Figure 8. The dependence of the quasibolometric light curve (ugriz filters) on the different parameters of the optimal model (dark blue curve): a) the mass of the pre-supernova star and its distribution between the ejecta and the compact remnant (here and in other panels masses are in units of Solar mass); b) the radius of the pre-supernova star in units of Solar radius; c) the mass of the synthesized56Ni; d) the energy of the outburst in units of1051erg. Filled circles
show the observational quasibolometric light curve of the SN 2013dx.56Ni is totally mixed through the ejecta for all presented models except the models
shown with dashed line.
We can not distinguish weather it is related to a flare activity of the GRB afterglow or to an X-ray radiation from the SN com-ponent. If this enhancement is related to the SN component, the corresponding luminosity is 4 orders higher than the X-ray lumi-nosity of the well known SN 1993J (SN IIb, Chandra et al. 2009). However, there are some GRB-SNe discussed in the literature (e.g., Li & Pun 2011), where X-ray luminosities of GRB-SNe events are comparable with our estimates.
5.4 SN Energy budget
In the Section 4 we derived a value of the total energy of the SN
explosionEoburst= 3.5 × 1052
erg and the bolometric energy of
the SN radiation from far IR to extreme UVEbol = 3.1 × 1049
erg. We would like to estimate the radiative efficiency of the SN
η = Erad/Eoburst, whereEradis an amount of the energy released
in the radiation in both optical range and X-rays,Erad = Ebol+
EX,SN. Suggesting that the enhancement of the X-ray flux in the
period of5 − 15 d after the trigger is related to the SN activity (see
Section 5.3), we estimate the energy of the SN released in the
X-ray domain asEX,SN= 1.3 × 1049
erg. Compiling all these values
the radiative efficiency of the SN explosion isη > 0.1 per cent.
Otherwise, if we suggest that the SN X-ray emission is negligible,
then we obtain a conservative lower limit of the efficiencyη > 0.08
per cent.
5.5 Comparison with other GRB-SNe
In our model we obtained the pre-supernova star mass M =
25 M⊙ and the mass of the resulting compact remnant MCR = 6 M⊙. Hence, the total mass of the ejecta is Mej = 19 M⊙. The
large ejecta mass and the possible presence of clumps of matter around the progenitor (bump in red filters) are consistent with the explosion of a rather massive star and suggest that the progenitor of SN 2013dx was a massive Wolf-Rayet star, whose strong winds drove the stripping of the outer layers. The higher ejecta mass is
20 40 60 80 T−T0, days 15 20 25 30 35 M ag n it u d e r−2 B+2 z−6 u+4 g i−4 bolugriz+13 0 50 100 150 T−T0, days 0 10 20 30 P h o to sp h er ic v el o ci ty [1 0 0 0 k m · s − 1] SN Ia model Toy et al., 2016 D’Elia et al., 2015 a) b)
Figure 9. a) The observed light curve of SN 2013dx (points) and the result of modelling with the SN Ia parameters (solid lines). The quasibolometric light curve of the SN in AB photometric system obtained as a sum of the fluxes inugriz filters, is marked as bolugriz. b) Corresponding photospheric velocities:
observed (points) and obtained from the model (solid line).
predicted for some Type Ic supernovae from a massive progeni-tor (e.g., SN 2011bm, Valenti et al. 2012). The final mass of black hole is compatible with current observations and theoretical predic-tions (see Figure 20 of Sukhbold et al. 2016). However, the ejecta mass is greater than that obtained by D15 and T16, and also greater than ejecta masses of other GRB-SNe, collected by T16 and by Cano et al. (2016, see Table 1 there). On the contrary, the mass of
synthesized nickelM56
Niis lower than that averaged by all
GRB-SNe and barely falls in 1-σ interval around the average value.
Con-cerning the total energy of the explosionEoburst, it is greater than
the average value and falls into the top third of all GRB-SNe total energy list.
Milgrom & Usov (2000) proposed a model of supernova-like explosion induced by gamma-ray burst in a binary system. The ejecta of a GRB exposes a white dwarf companion and initiates Type Ia supernova explosion. It would lead to SN Ia phenomenon
associated with gamma-ray burst. Using STELLAcode we
mod-elled the light curves of SN 2013dx with SN Ia model (M56Ni =
0.35 M⊙). The resulting light curves fit rather well the data (see Fig. 9), but the photospheric velocities calculated using this model do not correspond to those measured spectroscopically by D15 and T16. Therefore, the SN Ia model should be discarded.
In T16 the main parameters of the SN were obtained using the SN 1998bw as a template. But assuming those parameters as input for the modelling we could not obtain a good agreement (see Section 4 and Fig. 7). The parameters reported by T16 do not allow us to reproduce the observations by the model. Thereby we suggest, that the light curve of SN 1998bw is not an universal template to describe GRB associated supernovae. In the case of SN 2013dx the template of SN 2003dh, used in D15, gives better input parameters for the light curve modelling.
5.6 Remaining questions
The resulting model is the best from all of the models considered, still there remain some problems to be resolved.
(i) There is a problem with simultaneous fitting of observational data in all filters. The time position of the maximum in the modelled
and observational light curves does not coincide in every observa-tional range, especially in blue filters. There is an option to vary the
start time of the outburstT0, but for good agreement between the
model and the data one need to choose differentT0for blue and red
filters. But this would break the self-consistence of the model. This problem may be accounted for by the asymmetry of the outburst.
(ii) Despite the modelled quasibolometric light curve fits well observational data, the multicolour model does not fit well the peak of the SN in blue filters. The discrepancy between observational
points inB and u filters and resulting modelled light curves may
be explained by additional absorption along the line of sight which
is not included in the host extinction. Inu filter near the observed
maximum the difference between the observations and the model
isAu ∼ 1m corresponds toAV ∼ 0.m3 − 0.m4 depending on
the adopted extinction law. Assuming the wind-like medium and
the normalization density parameterA∗from Singer et al. (2013b)
(see Sec. 2.3) we estimated the hydrogen column densityNH in
the host galaxy of the source integrating the profile from the radius
of the pre-supernova starR = 100 R⊙ to infinity. We obtained
NH= 3.7 × 10¹⁹
cm−2. Assuming the relation betweenNHand
AV proposed by G¨uver & ¨Ozel (2009) for the Milky Way we
esti-mate the extinction along the line of sight to beALOS
V ∼0.02m.
This estimation does not allow us to explain the significant differ-ence between the modelled and the observed light curves in blue filters by some extra extinction along the line of sight or in the host galaxy.
(iii) The resulting model does not describe the secondary bump observed during the SN decay phase clearly visible in red filters (see Fig.6). The bump may be connected not with the SN, but with the afterglow. In this case it may be explained as an inter-action of the ejecta with some inhomogeneities in the surround-ing interstellar medium, e.g., dense interstellar clouds. The
the-oretical model when the prompt γ-ray emission re-radiates on
some dense shell or cloud in the medium surround the burst pro-genitor and forms bumps on the light curve was proposed by Bisnovatyj-Kogan & Timokhin (1997) and there are a few papers with numerical simulations (Barkov & Bisnovatyi-Kogan 2005; Postnov et al. 2004; Badjin et al. 2013). The model of the thick
shell or cloud predicts the chromatic behaviour of the bump, i.e., the bluer the filter the earlier the bump, and a relative brightness in bluer filters should be more pronounced than in red ones. Our observations clearly support the prediction about chromatic be-haviour, but the flux of the observed bump does not agree with the prediction: on the light curves (Fig. 6a) we clearly see the bump inz filter, while there is no bump in g filter. However, it might be
explained by a sparse sampling of the light curve ing filter.
More-over, explanation of the bump requires specific configuration, in particular, there should be a compact dense cloud off-axis to ob-server, but not to far to be within the emission cone. The duration
of the bump (τbump∼10 days) is explained in numerical
simula-tions (Badjin et al. 2013) with theSTELLAcode.
Similar bumps present on the light curves of other Type Ib/c SNe, SN 2003dh associated with GRB 030329, but in this case it is dif-ficult to distinguish the behaviour of the SN light curve from that of the extremely non-monotonic afterglow (see, e.g., Lipkin et al. 2004; Cano et al. 2016, and references therein). There is a
possi-bility in the STELLAcalculations to take into account additional
interaction of the SN ejecta with the interstellar medium by sur-rounding the star by a shell (or super-wind) which could induce the bumps on the modelled light curve (Sorokina et al. 2016). We did not implement super-wind in current modelling. However, the
bump has appeared in some other models in which56Ni is put in
the centre of explosion without mixing. The absence of the bump on the optimal resulting modelled light curve (Fig. 6a) may be also connected to the simplicity of the assumptions, which underlie the model and the code itself.
It is unlikely, that the late bump is related to the central en-gine activity, and thus, to the afterglow evolution. This bump could be related to the re-radiation of the prompt gamma-ray emission by a clumpy circumburst medium, but in this case one could ex-pect to observe several bumps from the interaction of gamma-rays with every clump around the source (e. g., the late light curve of GRB 030329 Lipkin et al. 2004). The observed bump could be nat-ural if the circumburst medium consisted of only one single clump. We can not definitely determine the bump’s nature and we sug-gest that it is related to the SN. Similar bumps may emerge in the
models with different56Ni distribution inside a pre-supernova star
(Moriya et al. 2016, see also Fig. 8b,c,d).
6 CONCLUSIONS
The light curve of SN 2013dx associated with GRB 130702A is the second well sampled GRB-SN after SN 1998bw. We collected all available optical data of this event: the multicolour light curves
of GRB 130702A contain 330 data points in filtersuBgrRiz until
88 days after the burst start, more than 280 of them form the light curves of the associated supernova SN 2013dx. 40 of these points are published for the first time.
We presented the multicolour light curves of this SN,
mod-elled with the code STELLA. In general, the model in filters as
well as quasibolometric light curve is in a fairly good agreement with the observations. Moreover, the STELLA predictions of pho-tospheric velocities fit well the ones obtained from spectra. The bolometric parameters of the supernova according to the model are:M = 25 M⊙, MCR = 6 M⊙, Eoburst = 3.5 × 1052 erg, R = 100 R⊙, M56
Ni= 0.2 M⊙ and it is totally mixed inside the
envelope;MO= 16.6 M⊙, MSi= 1.2 M⊙, and MFe= 1.2 M⊙.
Disagreement between the modelled flux and the data
in-creases from red to blue filter (fromg to u). Comparison between
the model and the data at the peak of the light curve suggests an ev-idence for an additional line-of-sight extinction in the host galaxy, but the presence of this additional extinction is not confirmed by other methods of investigation, namely, by modelling the host SED and circumburst environment density. Instead, it might be related
with a non-homogeneous mixing of56Ni.
A modelling of the SN light curve allowed us to estimate the conversion factor between the total energy of the SN outburst and the energy emitted by the SN as electromagnetic radiation to be 0.1 %.
GRB 130702A is one more GRB with the extended emission detected in the gamma-ray light curve. Since the central engine is thought to power the extended emission, this might suggest that GRB 130702A’s central engine is similar to those of GRB 111209A and GRB 130831A.
ACKNOWLEDGMENTS
We are grateful to M. Barkov, S. Grebenev, S. Moiseenko, B. Fain, and V. Loznikov for useful discussions. We are thankful for the anonymous referee for valuable remarks. The work of A. A. V., A. S. P., P. Yu. M., and E. D. M. (data reduction, analysis, inter-pretation and comparison with other GRB-SNe) was supported by Russian Science Foundation grant 15-12-30016. M.V.P. acknowl-edges support from RSCF grant no. 14-12-00146 for SN
mod-elling withSTELLAcode. This work of S. I. B. (development of
STELLAcode) was supported by Russian Science Foundation grant 14-12-00203. Grant no. IZ73Z0 152485 SCOPES Swiss National Science Foundation supports work of S. I. B. on production of ra-dioactive elements in stellar explosions. The work at Abastumani was supported by the Shota Rustaveli National Science Foundation, Grant FR/379/6-300/14. All observations at Maidanak astronomi-cal observatory was supported by grant of ”Committee for coordi-nation science and technology development of Uzbekistan” (No.: F2-AS-F026). We gratefully acknowledge to observers B. Khafi-zov and O. Parmonov for support observations at Maidanak astro-nomical observatory. O. A. B. is thankful to the Matsumai Interna-tional Foundation (MIF, Tokyo, Japan) (research fellowship ID No.: 15G24). This work made use of data supplied by the UK Swift Sci-ence Data Centre at the University of Leicester. This research has made use of NASA’s Astrophysics Data System.
REFERENCES
Amati L., Frontera F., Tavani M., et al., 2002, A&A, 390, 81 Amati L., Dichiara S., Frontera F., et al., 2013, GCN Circ. No
15025
Arnett W. D., 1982, ApJ, 253, 785.
Arnouts S., Cristiani S., Moscardini L., et al., 1999, MNRAS, 310, 540
Atwood W. B., Abdo A. A., Ackermann M., et al., 2009, ApJ, 697, 1071
Badjin D. A., Blinnikov S. I., Postnov K. A., 2013, MNRAS, 432, 2454
Baklanov P.V., Blinnikov S.I., and Pavlyuk N.N., 2005, AstL, 31, 429
Band D., Matteson J., Ford L., et al., 1993, ApJ, 413, 281 Band D. L., 1997, ApJ, 486, 928
Barkov M. V., Bisnovatyi-Kogan G. S., 2005, Ast. Rep., 49, 24 Barkov M. V., Pozanenko A. S., 2011, MNRAS, 417, 2161
Bennett C.L., Larson D., Weiland J. L., Hinshaw G., 2014, ApJ, 794, 135
Beuermann K., Hessman F.V., Reinsch K., et al., 1999, A&A, 352, L26
Bisnovatyj-Kogan G. S., Timokhin A. N., 1997, Astronomy Re-ports, 41, 423
Blanton M. R., Roweis S., 2007, AJ, 133, 734
Blinnikov S. I., Eastman R., Bartunov O. S., Popolitov V. A., Woosley S.E., 1998, ApJ, 496, 454
Blinnikov S. I., R¨opke F. K., Sorokina E. I., et al., 2006, A&A, 453, 229
Bufano F., Benetti S., Sollerman J., Pian E., Cupani G., 2011, As-tronomische Nachrichten, 3, 262
Burrows D. N., Hill J. E., Nousek J. A., et al., 2005, Space Sci. Rev., 120, 165
Cano Z., 2013, MNRAS, 434, 1098
Cano Z., de Ugarte Postigo A., Pozanenko A., et al., 2014, A&A, 568, id.A19
Cano Z., Wang S.-Q., Dai Z.-G., Wu X.-F., 2016, Xiv:1604.03549 Cenko S.B., A. Gal-Yam M. M., Kasliwal D., et al., 2013. GCN
Circ. No 14998
Chandra P., Dwarkadas V. V., Ray A., Immler S., Pooley D. 2009, ApJ, 699, 388
Cheung T., Vianello G., Zhu S., et al., 2013, GCN Circ. No 14971 Chugai N.N., Blinnikov S.I., Cumming R.J., et al., 2004,
MN-RAS, 352, 1213
Collazzi A. C., & Connaughton V., 2013, GCN Circ. No 14972 Corsi A., Perley D. A., & Cenko S. B., 2013, GCN Circ. No 14990 D’Avanzo. P., D’Elia. V., Tagliaferri. G., et al., 2013a. GCN Circ.
No 14984
D’Avanzo P., Porterfield B., Burrows D. N., et al., 2013b, GCN Circ. No 14973
D’Elia V., D’Avanzo P., Melandri A., et al., 2013, GCN Circ. No 15000
D’Elia V., Pian E., Melandri A., et al., 2015, A&A, 577, A116 [D15]
De Pasquale M., Oates S. R., Racusin J. L., et al., 2016, MNRAS, 455, 1027
Evans P. A., Beardmore A. P., Page K. L., et al., 2009, MNRAS, 397, 1177
Ferrero P., Palazzi E., Pian E., Savaglio S., 2007, AIP Conf. Proc., 924, 120
Filippenko A.V., 1997, Annu. Rev. Astron. Astrophys. 35, 309 Fioc M., Rocca-Volmerange B., 1997, A&A, 326, 950
Folatelli G., Contreras C., Phillips M., et al., 2006, ApJ, 641, 1039 Galama T. J., Vreeswijk P. M., van Paradijs J., et al., 1998, Nature,
395, 670
Gehrels N., Chincarini G., Giommi P., et al., 2004, ApJ, 611, 1005 Golenetskii S., R.Aptekar V., Pal’shin D., et al., 2013, GCN Circ.
No 14986
Gruber D., Goldstein A., Victoria Weller von Ahlefeld et al., 2014, ApJS, 211, 12
G¨uver T., & ¨Ozel F., 2009, MNRAS, 400, 2050
Hjorth J., & Bloom J. S., 2012, The Gamma-Ray Burst - Su-pernova Connection (Cambridge University Press: Cambridge), 169-190
Hurley K., Goldsten J., Connaughton V., et al., 2013. GCN Circ. No 14974
Ilbert O., Arnouts S., McCracken H.J., et al., 2006, A&A, 457, 841
Ishida E. E. O., Abdalla F. B., & de Souza R. S., Statistical Chal-lenges in 21st Century Cosmology, Proceedings IAU
Sympo-sium No. 306, 2014, A. F. Heavens, J.-L. Starck, & A. Krone-Martins, eds.
Ishida E. E. O. & de Souza R. S., 2013, MNRAS, 430, 509 Iwamoto K., Mazzali P. A., Nomoto K., et al., 1998, Nature, 395,
672
Kelly P. L., Filippenko A. V., Fox O. D., Zheng W., Clubb K. I. 2013, ApJ, 775, L5
Komissarov S. S., & Barkov M. V., 2009, MNRAS, 397, 1153 Kouveliotou C., Meegan C. A., Fishman G. J., et al., 1993, ApJ,
413, L101.
Kozyreva S., Gilmer M., Hirschi R., et al., 2017, MNRAS, 464, 2854.
Kulkarni S. R., Frail D. A., Wieringa M. H., et al., 1998, Nature, 395, 663
Leloudas G., Fynbo J. P. U., Schulze S., et al., 2013, GCN Circ. No 14983
Law N. M., Kulkarni S. R., Dekany R. G., et al., 2009, PASP, 121, 1395
Li K. L., Pun Chun. S. J. 2011, eprint arXiv:1109.0981 Liang E.-W., Racusin J.L., Zhang B., et al., 2008, ApJ, 675, 528 Lipkin Y. M., Ofek E. O., Gal-Yam A., et al., 2004, ApJ, 606, 381 Lyons N., OBrien P. T., Zhang B., et al., 2010, MNRAS, 402, 705 MacFadyen A. I., & Woosley S. E., 1999, ApJ, 524, 262 Markwardt, C. B., Astronomical Data Analysis Software and
Sys-tems XVIII ASP Conference Series, Vol. 411, proceedings of the conference held 2-5 November 2008 at Hotel Loews Le Con-corde, Qubec City, QC, Canada. Edited by David A. Bohlender, Daniel Durand, and Patrick Dowler. San Francisco: Astronomi-cal Society of the Pacific, 2009., p.251
Mazzali P. A., Deng J., Tominaga N., et al., 2003, ApJ, 599, L95 Meegan. C., Lichti. G., Bhat. P. N., et al., 2009. ApJ. 702. 791 Milgrom M, & Usov V.V., 2000, ApJ Letters, 531, L127 Moriya T. J., Pruzhinskaya M. V., Ergon M., Blinnikov S. I., 2016,
MNRAS, 455, 423
Mulchaey J., Kasliwal M. M., Arcavi. I., et al., 2013a, GCN Circ. No 14985
Mulchaey J., Kasliwal M. M., Arcavi I., Bellm E., Kelson D., 2013b, The Astronomer’s Telegram, 5191
Norris J. P., 2002, ApJ, 579, 386
Norris J. P., Bonnell J. T., Kazanas D., et al., 2005, ApJ, 627, 324 Perley D. A., Cenko S. B., Corsi A., et al., 2014, ApJ, 781, id. 37 Perley D., & Kasliwal M., 2013, GCN Circ. No 14979
Postnov K. A., Blinnikov S. I., Kosenko D. I., Sorokina E. I., 2004, Nuc. Phys. B Proc. Suppl., 132, 327
Pozanenko A., Volnova A., Burhonov O., Molotov I., 2013, GCN Circ. No 14988
Pr´evot M. L., Lequeux J., Pr´evot L., et al., 1984, A&A, 132, 389 Rau A., Kulkarni S. R., Law N. M., et al., 2009, PASP, 121, 1334 Sari R., Piran T., Narayan R., 1998, ApJ, 497, L17
Schlafly E. F., & Finkbeiner D. P., 2011, ApJ, 737, id.103 Schulze S., Leloudas G., Xu D., et al., 2013, GCN Circ. No 14994 Sim S.A., Kromer M., Ropke F.K., et al., 2010, Numerical Mod-eling of Space Plasma Flows, Astronum-2009, proceedings of a conference held 29 June through 3 July 2009 in Chamonix, France. Edited by Nikolai V. Pogorelov, Edouard Audit, and Gary P. Zank. San Francisco: Astronomical Society of the Pa-cific, 2010., p.148
Kromer M., Sim S.A., 2009, MNRAS, 398, 1809
Singer L. P., Cenko S. B., Kasliwal M. M., et al., 2013a, GCN Circ. No 14967
Singer L. P., Cenko S. B., Kasliwal M. M., et al., 2013b, ApJL, 776, L34
Sorokina E., Blinnikov S., Nomoto K., Quimby R., Tolstov A., 2016, ApJ, in press
Sukhbold T., Ertl T., Woosley S. E., Brown J. M., Janka H.-T., 2016, ApJ, 821, 38
Tauris T. M., Langer N., Moriya T. J., et al., 2013, ApJ, 778, 23 Tominaga N., Blinnikov S., Baklanov P., et al., 2009, ApJ, 705, 10 Toy V. L., Cenko S. B., Silverman J. M., et al., 2016, ApJ, 818, id.
79
Valenti S., Taubenberger S., Rastorello A., et al., 2012, ApJL, 749, 28
van der Horst A.J., 2013, GCN Circ. No 14987 Vietri M., Stella L. 1998, ApJL, 507, 45
Woosley S.E., Kasen D., Blinnikov S., Sorokina E., 2007, ApJ, 662, 487
Wright E.L., 2006, PASP, 118, 1711