HAL Id: hal-01595498
https://hal.archives-ouvertes.fr/hal-01595498
Submitted on 26 Sep 2017HAL is a multi-disciplinary open access archive for the deposit and dissemination of sci-entific research documents, whether they are pub-lished or not. The documents may come from teaching and research institutions in France or abroad, or from public or private research centers.
L’archive ouverte pluridisciplinaire HAL, est destinée au dépôt et à la diffusion de documents scientifiques de niveau recherche, publiés ou non, émanant des établissements d’enseignement et de recherche français ou étrangers, des laboratoires publics ou privés.
evidence
William Tottey, David Feria Gervasio, Nadia Gaci, Brigitte Laillet, Estelle
Pujos-Guillot, Jean-François Martin, Jean-Louis Sébédio, Benoît Sion,
Jean-François Jarrige, Monique Alric, et al.
To cite this version:
William Tottey, David Feria Gervasio, Nadia Gaci, Brigitte Laillet, Estelle Pujos-Guillot, et al.. Colonic transit time is a driven force of the gut microbiota composition and metabolism: In vitro evidence. Journal of Neurogastroenterology and Motility, Korean Society of Neurogastroenterology and Motility, 2017, 23 (1), pp.124-134. �10.5056/jnm16042�. �hal-01595498�
Colonic Transit Time Is a Driven Force of the Gut
Microbiota Composition and Metabolism:
In Vitro Evidence
William Tottey,1 David Feria-Gervasio,1 Nadia Gaci,1 Brigitte Laillet,2 Estelle Pujos,2 Jean-François Martin,2 Jean-Louis Sebedio,2 Benoit Sion,1 Jean-François Jarrige,1 Monique Alric,1 and Jean-François Brugère1*
1EA 4678 CIDAM, Clermont Université, Université d’Auvergne, CRNH Auvergne, Clermont-Ferrand, France; and 2INRA, UMR 1019, Plateforme
d’Exploration du Métabolisme, Nutrition Humaine, Saint-Genès Champanelle, France
Background/Aims
Human gut microbiota harbors numerous metabolic properties essential for the host’s health. Increased intestinal transit time affects a part of the population and is notably observed with human aging, which also corresponds to modifications of the gut microbiota. Thus we tested the metabolic and compositional changes of a human gut microbiota induced by an increased transit time simulated in vitro.
Methods
The in vitro system, Environmental Control System for Intestinal Microbiota, was used to simulate the environmental conditions of 3 different anatomical parts of the human colon in a continuous process. The retention times of the chemostat conditions were established to correspond to a typical transit time of 48 hours next increased to 96 hours. The bacterial communities, short chain fatty acids and metabolite fingerprints were determined.
Results
Increase of transit time resulted in a decrease of biomass and of diversity in the more distal compartments. Short chain fatty acid analyses and metabolite fingerprinting revealed increased activity corresponding to carbohydrate fermentation in the proximal compartments while protein fermentations were increased in the lower parts.
Conclusions
This study provides the evidence that the increase of transit time, independently of other factors, affects the composition and metabolism of the gut microbiota. The transit time is one of the factors that explain some of the modifications seen in the gut microbiota of the elderly, as well as patients with slow transit time.
(J Neurogastroenterol Motil 2017;23:124-134)
Key Words
Aging; Colon; Constipation; Gut microbiome; Microbiological techniques
Received: March 10, 2016 Revised: May 13, 2016 Accepted: June 14, 2016
This is an Open Access article distributed under the terms of the Creative Commons Attribution Non-Commercial License (http://creativecommons. org/licenses/by-nc/4.0) which permits unrestricted non-commercial use, distribution, and reproduction in any medium, provided the original work is properly cited.
*Correspondence: Jean-François Brugère, PhD
EA 4678 CIDAM, Clermont Université, Université d’Auvergne, CRNH Auvergne, F-63001 Clermont-Ferrand, France Tel: +33(0)4-7317-8391, Fax: +33(0)4-7317-8392, E-mail: jf.brugere@udamail.fr
Introduction
The gut harbors a complex ecosystem composed of 1 × 10¹⁴ microbial cells which present an important metabolic diversity1
and
notably contributes to the host’s health and well-being.2
Increases of transit time or even constipation is frequently observed among the human population. Recently, the colonic transit rate evaluated through stool consistency (categorized by the Bristol stool scale) has been strongly associated with gut microbiota composition,3
with Medium Continuous fermentation 1)- P Proximal 2)- T Transversal 3)- D Distal Waste 48 hr gut transit t of P0 48 t of T steady state 0 48 t of T steady state 0 48 Additional 90 hr Additional 90 hr Steady-state
(after 5 RT) 96 hr gut transit
Additional 125 hr 2nd steady state of reactor 1 t of T steady state 0 96 t of T steady state 0 96 t of P0 96 RT change in each fermentor
Sampling at each t and 48 hr after0
Microbial composition
(each t only) Taxonomic bacterial composition (HuGChip DNA microarray, qPCR)
0 Metabolic functions Atmospheric gases (GC) Metabolomics fingerprint (LC-MS) SCFAs production (HPLC)
A
B
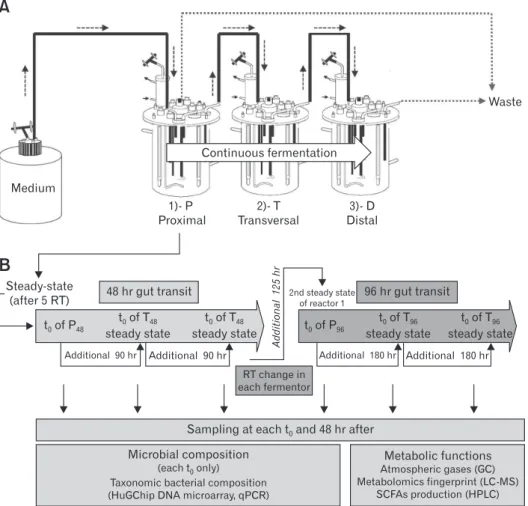
Additional 180 hr Additional 180 hrFigure 1. The 3-stage Environmental Control System for Intestinal Microbiota (ECSIM) and overall design of the experiment. (A) The 3S-ECSIM system is depicted with its 3 reactors: proximal, transversal, and distal (P, T, and D), respectively, simulating the physicochemical param-eters of the proximal, transversal, and distal parts of the colon. Each reactor is initially inoculated by the same regenerated fecal inoculum. The first one is fed with a growth medium simulating nutrients entering the proximal colon in a continuous fermentation process, using a retention time (RT) fitting with first a normal transit time (48 hours) and next a slow one (96 hours) (see Table 1 for parameters). Resulting medium from the P reac-tor is continuously used to feed the second reacreac-tor (T), and next the third reacreac-tor (D) in a similar process. Volumes of reaction are maintained by retrieving excess of medium to fit also with RT (reactors P and D, see Table 1). (B) After at least 5 RT of continuous feeding, the gut microbiota is considered to be in a steady-state (modeled at 96% stability) and the resulting metabolized medium considered to be stable. This time corresponds to t0 in each reactor (see additional data, at time t0 and 48 hours after, for metabolic comparisons at steady state). For a 48-hour gut transit
simula-tion (orange, left part), the resulting medium from the P reactor is used to feed the second reactor during 90 hours more (in case of a gut normal transit time of 48 hours, Table 1) in order to obtain 5 RT in the T reactor. The same principles are applied for the third reactor (D48) and the medium resulting from reactor T48. The RT is next changed in each compartment in order to simulate a slow transit time (96 hours all over the gut, blue, right part) and similar principles are applied (see Table 1 for parameters). At each t0 and 48 hours after, samplings are done and analyses
performed (in grey boxes, lower part). This encompasses the determination of the microbial composition by the Human Gut Chip (HuGChip), a DNA phylogenetic microarray detecting 16S bacterial sequences,20 and its metabolic behavior by measuring the fermentative atmospheric gases,
loose stool corresponding more frequently to the Prevotella entero-type4 and with more abundant Bacteroides spp.3
This increase of transit time is also one of the gastrointestinal modifications encountered in elderly people either living in a com-munity or in institutions5,6
and for whom human gut microbiota variations have been associated.7-10
To address the real part of the transit time influence, drugs have been administered to cohorts to change the patient transit time.11,12
These studies reported a negative correlation between the increase of transit time and fecal microbial biomass. Furthermore, the increase of transit time positively corre-lated with the increase of methanogens, of breath methane concen-trations and pH, while being inversely correlated to the proportion of sulfate reducing bacteria and the concentration of short chain fatty acid (SCFA).12
In vitro systems have been developed and used to study the hu-man gut13
overcoming ethical questions.14
In previous experiments conducted by MacFarlane and collaborators,15
an in vitro system was used to simulate the passage from an average colon transit (66.7 hours) to a quick colon transit (27.1 hours) by a change of retention time. This modification induced variations on the microbial com-munity structure and metabolic activity.15,16
The Environmental Control Systems for Intestinal Microbiota (ECSIM) models are inspired by those developed by MacFarlane and colleagues.17,18
In its 3-stage configuration (Fig. 1), it simulates the proximal, trans-versal and distal parts of the human colon in which gut microbes are known to be different,19
mimicking different physicochemical parameters and substrates availability for gut microbes.18
This bio-geography simulation is obtained by differential development of mi-crobes from a same fecal microbe repertoire in the 3 linked fermen-ters. A growth medium determined to be representative of nutrients entering the proximal part of the colon under standard diet15
is giv-en at a dilution rate that can be modified, therefore mimicking vari-ous retention times in the proximal part. This medium, modified by the microbial activity of the proximal part, is next used to feed the second reactor/transversal part, also with a specified dilution rate. The same principles are next applied to feed the third reactor/distal part. One of the other main characteristics of the ECSIM systems relies in the genesis of anaerobia which is necessary for microbial development: instead of being maintained by a continuous flush of gases devoid of O2, anaerobia is here generated by the fermentative metabolism of the microbes themselves17,18
supposedly simulating conditions more closely related to the one encountered in vivo.
The objective of our study was to evaluate the impact of the in-crease of the transit time on the gut microbiota in 3 anatomical parts of the colon. This question is addressable through the use of
dedi-cated parameters on the 3-stage ECSIM (3S-ECSIM) systems: the effect of retention time was evaluated, from a normal duration to an increased one (overall transit time from 48 hours to 96 hours) on the gut microbiota composition and its metabolism. This study should help to determine the gut microbiota modifications that would result in people with slow transit times and for which very sparse data are available regarding gut microbes. This would also contribute to determining to what extent the reduced transit time could contribute to the distinctive gut microbiota of elderly people.
Materials and Methods
Three-stage Environmental Control System for
Intestinal Microbiota Procedure
The fecal aliquot was obtained from a healthy female volunteer (29 years old), without recent treatment with antibiotics and who was not a breath methane-producer. Briefly, one 2-mL fecal aliquot with 30% (v/v) glycerol17
was unfrozen on ice and used to inoculate a 5-mL preculture of fermentation medium, grown at 37o
C for 10 hours. It was transferred for 15 hours into a 1-L Erlenmeyer flask containing 95 mL of fermentation medium and into a 2-L bioreac-tor (Global Process Concept Inc, Perigny, France) previously N2 flushed containing 900 mL of fermentation medium for a 24 hour batch culture at 37o
C, pH 5.7, and 400 rpm. The same opera-tions were used for each of the 3-stage bioreactors P (proximal), T (transversal), and D (distal) with working volume of 1 L for each. After the 24 hour batch condition, the procedure and medium used were as described previously (Table 1).18
Figure 1 illustrates the 3S-ECSIM and the overall experimental design. Briefly, an initial retention time of 48 hours was applied to the system and after 240 hours of stabilization; it was increased to 96 hours by a decrease of dilution rate and left to stabilize for 480 hours. Samplings were performed in each reactor over a 48-hour period for microbial and biochemical analyses (n = 6 samples per condition). No gases were flushed during the course of the continuous culture, the anoxic environment being progressively and dynamically enriched by the gases originating directly from the microbiota metabolism. The acquisition and control software C-BIO (Global Process Concept Inc) was used for the batch and culture continuous conditions.
In Vitro Microbiota Growth
Microbiota growth was evaluated by spectrophotometry (620 nm, Beckman Coulter DU 640B spectrophotometer; Beckman Coulter, Fullerton, CA, USA) and by dry weight measurements:
for this purpose, 5 mL of culture was first centrifuged (13 000 × g, 10 minutes), then the pellet was washed 3 times with distilled water before being deposited under vacuum and dried at 104oC onto a pre-weighted membrane (Polyamid 0.45 µm; Sartorius, Dourdan, France). The biomass (as a dry weight) was next determined.
Human Gut Chip Microarray Analysis
A community analysis was performed at the phylum and family level using the Human Gut Chip (HuGChip; GEO: GSE44752). The HuGChip is an explorative phylogenetic microarray designed to target the 66 bacterial families usually recovered from the human gastrointestinal tract, which provided positive correlations with data from pyrosequencing of amplicons and metagenomic analysis.20 It consists of around 3 × 4500 probes established from a previous work and was synthesized by Agilent Technologies (Palo Alto, CA, USA) as a 8×15K microarray.20 Bacterial DNA was extracted from a 0.25 mL sample of fermentation medium as described by Yu and Morrison21 and followed by the Qiagen’s DNA stool kit (Qiagen Ltd, West Sussex, UK). Small subunit RNA coding genes were then amplified by PCR and purified using the MinElute PCR purification kit (Qiagen Ltd). One microgram was then labeled us-ing either Cy3 or Cy5 (Genomic DNA ULS labelus-ing Kit; Agilent Technologies, Palo Alto, CA, USA) and hybridizations/washings were performed following the manufacturers recommendations. Microarray scanning was performed on a Surescan microarray scanner (Agilent Technologie, USA).
Short Chain Fatty Acid Analysis
SCFAs were quantified from a bioreactor volume of about 200 µL. It was quickly sampled, deproteinized using 400 µL of cold methanol and centrifuged (8000 × g, 10 minutes). The superna-tant was stored at -20oC until the analyses. It was used to determine the level of acetate, propionate, butyrate, isobutyrate, isovalerate, val-erate, caproate, isocaproate, and heptanoate using gas chromatogra-phy (HP 6890 series; Agilent Technologies, Les Ulis, France). The chromatography was carried out using HP-INNOVAX column (30 m × 250 µm × 0.25 µm, split ratio = 25:1, Agilent Technolo-gies, France). 2-Ethyl-butyrate was used as an internal standard.
Metabolomic Fingerprint
A deproteinized sample (same procedure as for SCFA analysis) was evaporated under nitrogen and the dry residue was dissolved in the injection solvent (50/50 water/acetonitrile with 0.1% for-mic acid). Six for-microliters of the solution were then injected into a chromatographic system (Waters Acquity UPLC module, Saint Quentin en Yvelines, France). Separations were carried out at 30oC using a 2.1 × 50 mm Acquity UPLC HSS T3 column (Waters), with a particle size of 1.8 µm at a flow rate of 0.4 mL/min. Plasma was eluted from the LC column using the following linear gradient (curve number 6): 0-2 minutes: 100% A; 2-15 minutes: 0-100% B; 15-22 minutes: 100% B; 22-26 minutes 100% A for re-equilibra-tion. Solvent A was water and solvent B was acetonitrile, both sol-vents containing 0.1% formic acid. The UPLC system was coupled to a Waters Qtof-Micro equipped with an electrospray source and a lockmass sprayer to ensure accuracy. Experiments were carried out
Table 1. Fermentation Conditions Used in the Environmental Control System for Intestinal Microbiota System to Simulation a Normal and a Slow Transit Time by a Modification of the Retention Time
Reactor pH Dilution rate
(hr–1)
Retention time (hr)
Minimum doubling time (hr) Simulation of a 48 hr transit P48 5.8 0.080 12.48 8.65 T48 6.2 0.056 17.76 12.31 D48 6.8 0.056 17.76 12.31 Simulation of an 96 hr transit P96 5.8 0.040 24.96 17.3 T96 6.2 0.028 35.52 24.62 D96 6.8 0.028 35.52 24.62
Minimum doubling time means the minimum doubling time of each bacterial species to avoid washing from the reactor and therefore the disappearance of the spe-cies when analyzed at steady-state.
P48, T48, and D48 indicate respectively the P (proximal), T (transversal), and D (distal) reactor simulating a 48-hour transit. P96, T96, and D96 indicate respec-tively the P (proximal), T (transversal), and D (distal) reactor simulating an 96-hour transit.
in positive ion mode with a scan range from 70 to 1000 m/z. Capil-lary voltage was set to 3 kV and cone voltage was optimized at 30 V. The scan time and the dwell time were fixed at 1 and 0.1 seconds, respectively. ESI needle and drying gas temperatures were set at 120 and 450o
C, respectively. The drying and nebulizing gas flows (nitrogen) were set to 50 and 500 L/hr. All analyses were acquired by using the lockspray with a frequency of 5 seconds to ensure accu-racy. Leucine enkephalin was used as the lock mass. To avoid pos-sible differences between sample batches, a Latin square was carried out to obtain randomized analytical sequences. Raw data files were converted to NetCDF format using the Waters DataBridge soft-ware. All liquid chromatography – mass spectrometry (LC–MS) data were processed using XCMS to yield a data matrix containing retention times, accurate masses and normalized peak intensities.22 An identification of the molecules was performed on the basis of their exact masses which were compared to those registered in the Kyoto Encyclopedia of Genes and Genomes (KEGG) database23
or in the Human Metabolome Database.24
Statistical Methods
For microarray analyses, pixel intensity data was extracted us-ing the Feature Extraction software (Agilent Technologies, USA). The retained intensity value for each probe was the spot’s median intensity signal. Specific scripts developed with the Delphi and C++ signal were used to automatically perform data extractions as defined previously.20
SCFAs means were analyzed using one-way ANOVA variance analysis and multiple comparison tests were further performed using Tukey’s test (KaleidaGraph 4.03, Synergy Software): differences were considered significant for P-values less than 0.05. For LC-MS experiments, data were normalized before analyses to an identical signal sum and analyzed using Log10 values. Normalized data are given as Supplementary Table. A Principal Component Analysis (PCA) was also performed using PAST based on a Var-Covar matrix.25
Results
Retention Time Affects Overall and Specific Gut
Microbiota Communities
The change of retention time passing from a total of 48 hours to 96 hours induced a significant decrease of biomass in the T96 and D96 reactors which simulate the transversal and distal colon re-spectively (Fig. 2A). The bacterial community was next determined at the bacterial family taxonomic level. Some diversity indexes were
used to assess the richness, evenness, and species abundance in each compartment, and allowed underlining an overall effect of the treatment on the ecosystem. They indicated modifications, with Shannon diversity indexes in the T and D reactors decreased with the slower retention time compared to the quicker one (Fig. 2A). When considering the proportions of bacterial families in both conditions, the Clostridium cluster IX family (Clostridium cl. IX) was increased in the 3 reactors with the increased retention time. Other changes were dependent of each simulated region: the P reactor, simulating conditions similar to the proximal colon, was the least affected: the main modifications were the diminution of Clos-tridium cl. I and of the bacteria belonging to the family Desulfovi-brionaceae. Furthermore, the apparition of bacteria from the family Enterobacteriaceae and the increase of Coriobacteriaceae were seen (Fig. 2A). In the T reactor simulating the transversal colon, an in-crease of the Clostridium cl. XIV with the higher retention time was observed associated with a decrease of the families Clostridium cl. I, Coriobacteriaceae, and Porphyromonadaceae, and a disappearance of Desulfovibrionaceae. Finally, the third reactor simulating the distal colon was characterized by the most important diversity and where the modifications were the most important: an increase of the relative abundance of Enterobacteriaceae, and in a lesser extent of Bacteroidaceae and Lactobacillaceae was observed. Inversely, there was a decrease of the relative abundance of Porphyromonadaceae and loss of some uncultured Clostridium and of bacteria belonging to the Rikenellaceae family. A Principal Component Analysis il-lustrates these changes induced by the retention time in each reactor (Fig. 2B): Microbial communities at the 2 different retention times coming from the same reactor shows a common clustering while microbial communities of the 3 reactors, whatever being the reten-tion time applied, are more distantly related. Importantly, the first component (which accounts for more than half of the explanation of the differences among reactors, x-axis) indicates that the normal retention time induces a greater differentiation among colonic parts than the increased one. This is also particularly highlighted by the second most important principal component (y-axis), that supports 15.5% of the differences among samples (Fig. 2B).
Retention Time Affects Fermentative Activities
As structural modifications were induced by the change of retention time, a qualitative and quantitative analysis of SCFA, one essential metabolic activity of the microbiota was performed. SCFA production is mainly formed of acetate, propionate and butyrate, the latter being the principal energy source of intestinal epithelial cells. The increase of retention time induced an increase of total SCFAs
in the first and second compartments. In the proximal-colon simu-lating reactor P96, this was principally due to the 3 major SCFAs (acetate, propionate, and butyrate) while in the transversal simulat-ing part T96, a rise of longer, branched chains SCFAs and also of propionate and butyrate was observed (Table 2). In the third reactor D96, total SCFAs remains unaffected quantitatively, but a cant decrease of acetate was seen, partly compensated by a signifi-cant increase of some SCFAs with longer and branched chains. This reveals a change in fermentative activities indicative of a higher putrefaction activity with the increase of the retention time in last 2 reactors (T96 and D96).
Retention Time Affects Metabolic Behavior of
Microbiota
A metabolomic analysis of the media of each reactor at both
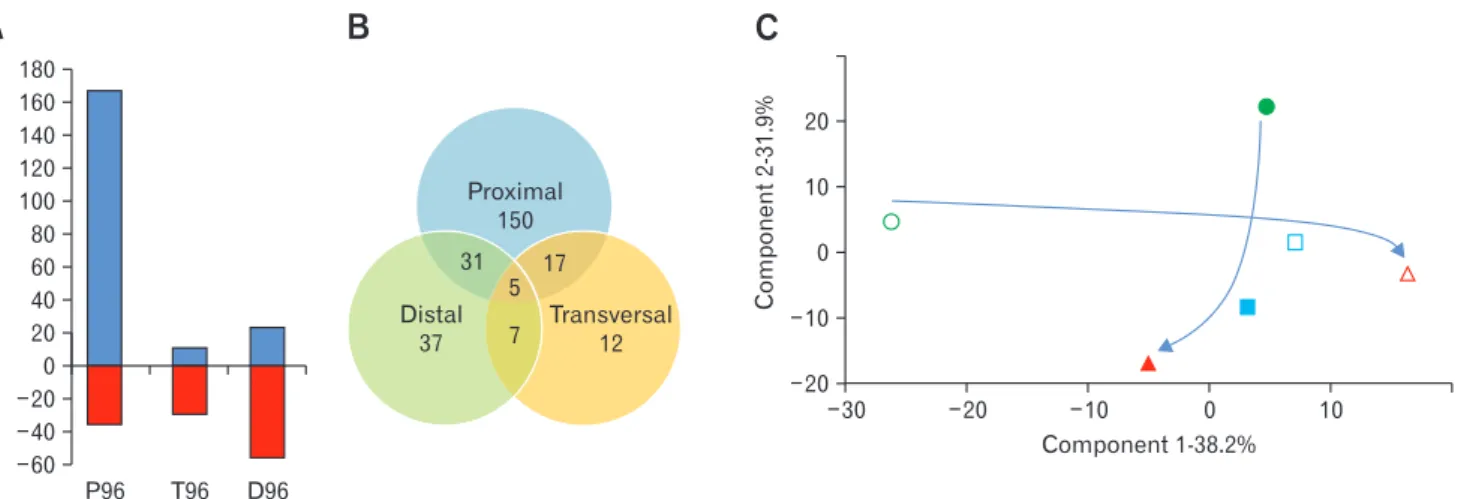
retention times was performed and revealed 554 different ions of over 100 Da (Supplementary Table). About half of them (259) were quantitatively affected, indicating important metabolic shifts in the system: the most affected compartment was the one simulating the proximal colon, with a majority of increases (167 of the 203 sig-nificantly modified ions, Fig. 3A). On the contrary, in the following compartments (T96 and D96) the majority of impacted ions de-creased. This indicates likely a decrease of possible microbial dietary intakes in the lower parts of the 3S-ECSIM when retention time increases, due to better energy retrieval in the upper part. Glob-ally these changes were region-specific with minor cases of shared changes throughout the compartments (5 ions, Fig. 3B). Overall qualitative changes with the increase of retention time were limited: only one ion appeared in P, and 13 and 6 metabolites disappeared in T and D, respectively. Using a Principal Component Analysis,
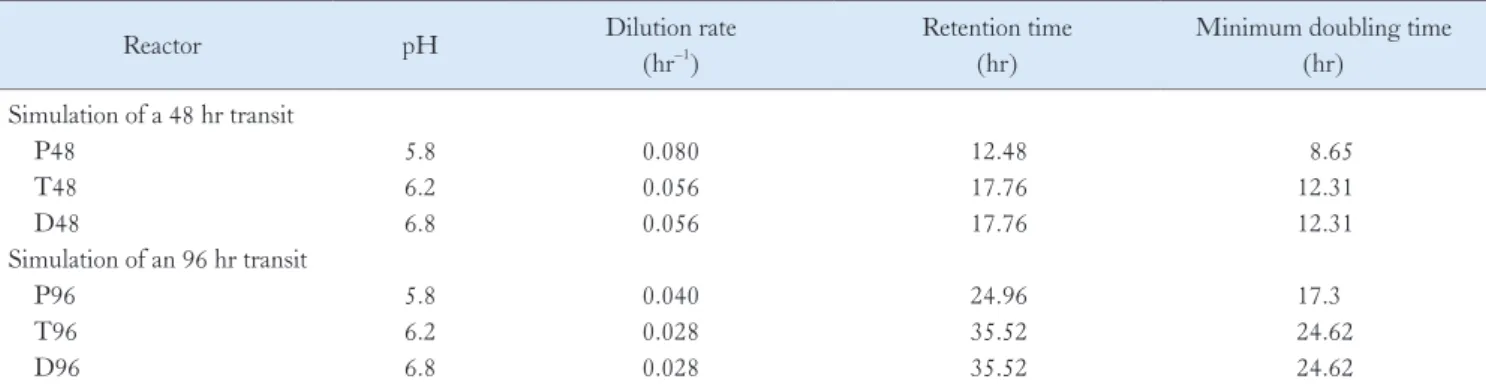
Figure 2. Microbial analysis of the gut microbiota in each reactor at the 2 different simulated transit time. (A) On the upper part are indicated the biomass of dry matter (in gram per liter of medium) and the Shannon diversity index (characterizing the diversity in a community, ie, species abun-dance and evenness). *Corresponds to values obtained at the slow simulated transit time which are significantly different when compared to the val-ues obtained in the same reactor at the normal simulated transit time (P < 0.05). The histogram below provides the proportion (in %) of each bac-terial family detected by the Human Gut Chip (HuGChip). The legend is indicated in the left part (each color is representative of one phylum). (B) Correlation matrix based Principal Component Analysis of the microbial profiles obtained with the 3 reactors at the 2 simulated transit times. The 2 axes represent the 2 first components (ie, those that account for the more differences between samples, above 70% in this example), with the part (in %) they account for the overall observed difference across samples. Empty symbols, 48-hour transit time simulation; filled symbols, 96-hour transit time simulation; circles, proximal part; squares, transversal part; triangle, distal part. The arrows highlights the lower variability observed between compartments at a slower retention time compared with a normal one, when comparing the bacterial community differentiation from the proximal part to the distal one at the 2 transit times.
P48 P96 D96
A
100 90 80 70 60 50 40 30 20 10 % 0 T48 T96 D48 Biomass (g/L)Shannon diversity index 3.7 1.80 P48 P96 T48 T96 D48 D96 3.4 1.84 2.6 1.87 1.5* 1.72 3.4 2.18 1.0* 2.03 Enterobacteriaceae Desulfovibrionaceae Clostridials Lactobacillaceae Clostridium c Uncultured I. VIX Clostridium Clostridium cI. IX cI. IV cI. III cI. I Clostridium Clostridium Rikenellaceae Porphyromonadaceae Bacteroidaceae Coriobacteriaceae Bifidobacteriaceae 1 0 1 Component 2-15.5% 2 4 2 0 2 4 Component 1-55.6%
B
the first component (x-axis, accounting for about 38% of the dif-ferences between reactors) discriminates all 3 compartments under a normal transit time (P48, T48, and D48), while little differences are observed according to this component for the slow transit time. The P96, T96, and D96 compartments are inversely discriminated by the second component contributing also to a large part of the dif-ferences (about 32%, y-axis, Fig. 3C): the proximal and distal parts are metabolically different when comparing respectively each
com-partment at the 2 retention times highlighting a distinct metabolic behavior induced by a normal or slow transit time according to the gut-simulated section.
Discussion
The aim of this study was to determine to which extent the transit time, considered as an independent factor, could affect the
Table 2. Short Chain Fatty Acid Analysis at the 2 Different Retention Times for Each Reactor
Conc (mM) P48 T48 D48 P96 T96 D96 Acetate 50.2 ± 1.7 19.7 ± 1.5 26.1 ± 2.2 60.8 ± 1.5a 19.9 ± 3.5 20.3 ± 1.4a Propionate 19.9 ± 0.6 5.4 ± 1.7 8.7 ± 1.1 22.7 ± 1.3a 8.6 ± 0.9a 8.6 ± 0.4 Butyrate 14.1 ± 1.5 3.4 ± 0.1 9.0 ± 1.0 17.1 ± 0.4a 9.5 ± 0.9a 11.6 ± 2.5 Total APB 84.2 ± 0.7 28.5 ± 3.2 43.8 ± 4.2 100.6 ± 3.1a 38.0 ± 4.8a 40.5 ± 4.3 Valerate 2.9 ± 0.1 0.8 ± 0.0 3.3 ± 0.6 2.8 ± 0.1 1.3 ± 0.2a 1.7 ± 0.3a Caproate 2.1 ± 0.1 0.7 ± 0.1 2.3 ± 0.1 2.0 ± 0.0 0.9 ± 0.0a 1.8 ± 0.2a Heptanoate 0.7 ± 0.1 0.7 ± 0.1 1.6 ± 0.1 0.7 ± 0.0 0.7 ± 0.0 1.7 ± 0.3 Isobutyrate 4.9 ± 0.3 1.3 ± 0.1 2.7 ± 0.4 4.7 ± 0.1 3.4 ± 0.0a 2.8 ± 0.6 Isovalerate 4.2 ± 0.5 1.0 ± 0.1 2.5 ± 0.2 3.7 ± 0.1 3.5 ± 1.0a 6.1 ± 1.0a Isocaproate 2.5 ± 0.0 1.0 ± 0.1 2.3 ± 0.1 2.6 ± 0.1 1.4 ± 0.1a 1.3 ± 0.1a Total SCFA 101.5 ± 0.4 33.8 ± 3.7 58.5 ± 5.7 117.0 ± 3.4a 49.1 ± 5.9a 55.7 ± 6.3
P48, T48, and D48 indicate respectively the P (proximal), T (transversal), and D (distal) reactor simulating a 48-hour transit while P96, T96, and D96 indicate re-spectively the P (proximal), T (transversal), and D (distal) reactor simulating an 96-hour transit. “Conc” stands for the concentration of short chain fatty acids (SCFAs) expressed in mM. Values reported in the table are corrected values (eg, the concentration in the reactor T48 corresponds to the concentration measured in the reactor to which the concentration of the reactor P48 was subtracted). “Total APB” indicates the total concentration of the 3 main SCFAs acetate, propionate and butyrate.
aIndicates SCFA concentrations at the slow retention time which are significantly different (P < 0.05) to the values obtained in the same reactor at
the normal simulated transit time.
Figure 3. Analysis of the metabolomic data obtained for each reactor at the 2 different simulated transit times. (A) Graphic representation of the proportion of ions which are significantly increased (blue) and decreased (red) in the 3 reactors with the simulated increase of transit time. (B) Venn diagram of the 259 ions which are significantly modified with the increase of the simulated transit time, showing shared ions among the different simulated anatomical parts. (C) Correlation matrix based Principal Component Analysis of metabolites profiles in each reactor (empty symbols, 48-hour transit time simulation; filled symbols, 96-48-hour transit time simulation; circles, proximal part; squares, transversal part; triangle, distal part). The arrows indicate the metabolic trajectory from the proximal part to the distal one at the 2 transit times.
A
P96 D96 180 160 140 120 100 80 60 40 20 0 20 40 60 T96 Proximal 150 31 17 5 7 Transversal12 Distal 37B
20 10 0 10 Component 2-31.9% 20 30 20 10 0 10 Component 1-38.2%C
microbiota and consequently its metabolic activity using a multi-compartmental in vitro continuous culture system (ECSIM) simulating the different physicochemical conditions encountered in the colon. Numerous systems have been developed and allowed to study the impact of prebiotics, probiotics, and antibiotics on the gut microbiota, or even the microbial composition at colon micro-environments.26-29
The system used here has the particularity to maintain anaerobia due to the metabolic activity of the microorgan-isms constituting the microbiota: therefore, it leads to atmospheres that are variable among fermenters and whose constitution influ-ences the microbial metabolism. In consequence, it is believed to simulate more closely the physiology of a human gut. It also enables microbiota differentiations between the compartments from a com-mon fecal bacterial repertoire, and leads to similar microbial signa-tures between the distal compartment and the fecal inoculum.18
In the present study, we increased the retention time of media in each compartment in order to simulate an increase of transit time, from a normal intestinal transit time of 48 hours to a slow one of 96 hours. This was realized by adjusting media supply rates, with no other parameters changes in the entry of the in vitro system.
This retention time change induced modifications to the recon-stituted gut microbiota such as a reduction of biomass, which is in line with in vivo modifications reported with a medication-induced reduction of transit time in humans.11
However, in vivo data on the effect of constipation and slow transit time in the general population and on their gut microbiota are sparse.3
Moreover, it is difficult to differentiate the effects due to transit time from other factors such as diet. The gut microbiota of elderly people is studied much more and more data are available.7-10,30
Aging is frequently associated with fecal microbiota modifications which can be explained by many dif-ferent factors.7,31
Diet is a key factor31
and aging has been associated to a decrease sensitivity of taste and smell,32,33
so these changes could lead to the consumption of a restricted, nutritionally imbalanced diet and in fine the modification of the gut microbiota. Here, we hypothesized that an increase of transit time which is frequently as-sociated with elderly people could be one of those factors.5,6
Indeed, in baboons, aging leads to an abnormal neuronal stimulation from the myenteric plexus and impairments in the cholinergic mecha-nism, therefore affecting the smooth muscle colonic contractile re-sponse.34
We observed that the increase of retention time induced a decrease of total bacteria in the compartments of the system simulat-ing the transversal and distal colon (data not shown), which is also frequently associated with the gut microbiota of elderly people.11,35,36 Furthermore, increasing the retention time decreased the gut mi-crobiota diversity in the transversal and distal compartment of the
system comparably to the fecal microbiota of elderly people.8,9,35-37 Consequently, an important metabolic shift, mainly at a quantitative level was observed, the proximal colon simulating reactor being the most affected.
The important metabolic shift in the proximal part together with the increase of total SCFA when retention time increases sug-gests an increase of carbohydrate fermentation in this compartment as previously reported.15
This has several consequences: first, carbo-hydrate availability become lower in the next compartments, result-ing in increased putrefaction by specialized groups, and, second, this induces a decrease in microbial diversity: this is also confirmed by an increase of concentrations of longer and branched fatty acids (isovalerate and isobutyrate typical of protein fermentation), and with the limited metabolic activity in the compartments simulating the transversal and distal colon.
Clostridium cl. IX spp. increased in the 3 compartments of our system, principally in the first compartment: this family includes bacteria belonging to the Veillonella genus which are however not capable to use carbohydrates as an energy substrate: they metabolize lactates into propionates and use amino acids as an energy source.38 Therefore their increased abundance in the first and second reactors likely increased the level of propionate. Furthermore, in the second and third fermentors the increase in branched fatty acids would suggest an increase of proteolytic bacterial activity that is frequently reported in elderly people.10,39
Also, our results support the decrease of Porphyromonadaceae and of Rikenellaceae40
and the increase of Enterobacteriaceae8,31,40-42
reported in the gut microbiota of elderly people. Last, no changes in Bacteroidaceae were observed in any reactors, agreeing with the recent finding that these bacterial species were associated with loose stool.3
Therefore, in vitro results obtained in this study provide strong elements that transit time seems a major driven force of the gut microbiota composition.
It also provides clues about the prevalence and abundance of methanogenic archaea, and among them, Methanobrevibacter smithii, the most important one, is increased in elderly people.43-45 They are described as being correlated with an increase of transit time and inversely correlated to sulfate reducing bacteria.12
Here, the initial stool from a healthy adult was chosen without methano-gens, which was confirmed by the absence of CH4 in the gas pro-duced by any reactor. In a recent study, we showed that the inocula-tion and development of Mb. smithii induced a specific increase of Clostridium cl. IV and cl. XIV,46
agreeing with one of the 3 human enterotypes, the so-called Ruminococcus-Mb. smithii one.4
Here also, without methanogens, and mainly in the second reactor, the in-crease of retention time induced an inin-crease of Clostridium cl. XIV,
possibly providing a favorable ecological nest for methanogens: 2 complementary non-exclusive mechanisms may be proposed: (1) in a similar way described for this methanogen and Bacteroides the-taiotaomicron,47
a mutualistic partnership may exist between these 2 groups, as Mb. smithii in turn favors the communities that degrade cellulose.48
Moreover, (2) increasing the retention time led to the decrease of one major competitor group of methanogenic archaea, the sulfate-reducing bacteria (disappeared in the T96 reactor), where Clostridium cl. XIV is increased the most. This has impor-tant physiological issues as it has been proposed that methane, one end-product of the gut metabolic processes, mediates slower transit time.49
If this is true, it would therefore sustain or even favor the slower transit time of elderly people. In consequence, we also tested the liquid media from reactors at various dilutions toward a direct action on the gut motility: the generated metabolites either retrieved from the elevated retention time or the normal retention time did not affect rats’ duodenum motility ex vivo on isolated organs (data not shown). Therefore, it seems that these metabolite changes do not in turn affect the transit time.
In vitro systems have several limitations with their reproduction of the colonic environment. The main limitation is that the inter-actions between the microbiota and the host are not reproduced: among them, the absorption of water and of nutrients leads in vivo to fecal consistency modifications, and together with peristalsis (also not simulated in ECSIM) has likely an effect on microbial develop-ment. However, our results show that such systems can replicate modifications seen in the gut microbiota of elderly people. The de-velopment of such models could help in understanding the impact of a factor on the gut microbiota and studying how some treatments could overcome deleterious bacterial developments. In vitro systems do not require the validation by ethic committees and could allow pre-clinical tests.14
In conclusion, although in vitro systems present some limita-tions, they allowed the independent study of the effect of a single factor. The one used here revealed that transit time and simulated through retention time is a driven force of the gut microbiota and has very likely a physiological incidence in slow transit-time or constipated patients. The transit time explains, at least partly, modi-fications seen in the gut microbiota of elderly people, inducing the structural and metabolic changes of the gut microbiota with other capital elements such as nutrition and health.
Supplementary Material
Note: To access the supplementary table mentioned in this
article, visit the online version of Journal of Neurogastroenterol-ogy and Motility at http://www.jnmjournal.org/, and at https://doi. org/10.5056/jnm16042.
Acknowledgements: Jean-François Brugère thanks bachelors’ students for their help, more specifically Céline Vidal, Claire Ardae-ns, Adeline Régnier, and Amandine Maurin, and Sylvain Denis for his valuable help concerning in vitro systems. In memory of George T MacFarlane (died in 2015) for all of his pioneering works on gut in vitro simulations systems.
Financial support: This work was supported by the European Union (UE) through the Auvergne Council (FEDER) with a PhD and a postdoctoral Scholarship support respectively to Wil-liam Tottey and to David Feria-Gervasio, and by a PhD scholarship support from the French “Ministère de l’Enseignement Supérieur et de la Recherche” to Nadia Gaci.
Conflicts of interest: None.
Author contributions: William Tottey, David Feria-Gervasio, and Nadia Gaci performed in vitro experiments and analyses, ex-cept metabolomics; Brigitte Laillet, Estelle Pujos, Jean-François Martin, and Jean-Louis Sebedio performed metabolomics studies; Benoit Sion and Jean-François Jarrige performed ex vivo experi-ments and helped in the redaction of the manuscript; William Tot-tey and Jean-François Brugère designed the experiments; and Wil-liam Tottey, Monique Alric, and Jean-François Brugère analyzed data and wrote the manuscript.
References
1. Qin J, Li R, Raes J, et al. A human gut microbial gene catalogue estab-lished by metagenomic sequencing. Nature 2010;464:59-65.
2. Aziz Q, Doré J, Emmanuel A, Guarner F, Quigley EM. Gut microbiota and gastrointestinal health: current concepts and future directions. Neu-rogastroenterol Motil 2013;25:4-15.
3. Vandeputte D, Falony G, Vieira-Silva S, Tito RY, Joossens M, Raes J. Stool consistency is strongly associated with gut microbiota richness and composition, enterotypes and bacterial growth rates. Gut 2016 ;65:57-62. 4. Arumugam M, Raes J, Pelletier E, et al. Enterotypes of the human gut
microbiome. Nature 2011;473:174-180.
5. Madsen JL, Graff J. Effects of ageing on gastrointestinal motor function. Age Ageing 2004;33:154-159.
6. Rao SS, Go JT. Update on the management of constipation in the elderly: new treatment options. Clin Interv Aging 2010;5:163-171.
7. Biagi E, Candela M, Turroni S, Garagnani P, Franceschi C, Brigidi P. Ageing and gut microbes: Perspectives for health maintenance and
lon-gevity. Pharmacol Res 2012;69:11-20.
8. Claesson MJ, Cusack S, O’Sullivan O, et al. Composition, variability, and temporal stability of the intestinal microbiota of the elderly. Proc Natl Acad Sci USA 2011;108(suppl 1):4586-4591.
9. Jeffery IB, Lynch DB, O’Toole PW. Composition and temporal stability of the gut microbiota in older persons. ISME J 2016;10:170-182. 10. O’Toole PW, Jeffery IB. Gut microbiota and aging. Science
2015;350:1214-1215.
11. Stephen AM, Wiggins HS, Cummings JH. Effect of changing transit time on colonic microbial metabolism in man. Gut 1987;28:601-609. 12. El Oufir L, Flourié B, Bruley des Varannes S, et al. Relations between
transit time, fermentation products, and hydrogen consuming flora in healthy humans. Gut 1996;38:870-877.
13. Payne AN, Zihler A, Chassard C, Lacroix C. Advances and perspec-tives in in vitro human gut fermentation modeling. Trends Biotechnol 2012;30:17-25.
14. Venema K, van den Abbeele P. Experimental models of the gut microbi-ome. Best Pract Res Clin Gastroenterol 2013;27:115-126.
15. Macfarlane GT, Macfarlane S, Gibson GR. Validation of a three-stage compound continuous culture system for Investigating the effect of reten-tion time on the ecology and metabolism of bacteria in the human colon. Microb Ecol 1998;35:180-187.
16. Child MW, Kennedy A, Walker AW, Bahrami B, Macfarlane S, Mac-farlane GT. Studies on the effect of system retention time on bacterial populations colonizing a three-stage continuous culture model of the human large gut using FISH techniques. FEMS Microbiol Ecol 2006;55:299-310.
17. Feria-Gervasio D, Denis S, Alric M, Brugère JF. In vitro maintenance of a human proximal colon microbiota using the continuous fermentation system P-ECSIM. Appl Microbiol Biotechnol 2011;91:1425-1433. 18. Feria-Gervasio D, Tottey W, Gaci N, et al. Three-stage continuous
culture system with a self-generated anaerobia to study the regional-ized metabolism of the human gut microbiota. J Microbiol Methods 2014;96:111-118.
19. Eckburg PB, Bik EM, Bernstein CN, et al. Diversity of the human in-testinal microbial flora. Science 2005;308:1635-1638.
20. Tottey W, Denonfoux J, Jaziri F, et al. The human gut chip “HuGChip”, an explorative phylogenetic microarray for determining gut microbiome diversity at family level. PLoS One 2013;8:e62544.
21. Yu Z, Morrison M. Improved extraction of PCR-quality community DNA from digesta and fecal samples. Biotechniques 2004;36:808-812. 22. Benton HP, Wong DM, Trauger SA, Siuzdak G. XCMS2: processing
tandem mass spectrometry data for metabolite identification and struc-tural characterization. Anal Chem 2008; 80: 6382-6389.
23. Kanehisa M, Goto S. KEGG: kyoto encyclopedia of genes and genomes. Nucleic Acids Res 2000;28:27-30.
24. Wishart DS, Tzur D, Knox C, et al. HMDB: the Human Metabolome Database. Nucleic Acids Res 2007;35:D521-D526.
25. Hammer Ø, Harper DAT, Ryan PD. 2001. PAST: Paleontological statistics software package for education and data analysis. Palaeontolia Electronica 2001;4:9.
26. Kovatcheva-Datchary P, Egert M, Maathuis A, et al. Linking
phyloge-netic identities of bacteria to starch fermentation in an in vitro model of the large intestine by RNA-based stable isotope probing. Environ Micro-biol 2009;11:914-926.
27. Payne S, Gibson G, Wynne A, Hudspith B, Brostoff J, Tuohy K. In vitro studies on colonization resistance of the human gut microbiota to Can-dida albicans and the effects of tetracycline and Lactobacillus plantarum LPK. Curr Issues Intest Microbiol 2003;4:1-8.
28. Macfarlane S, Woodmansey EJ, Macfarlane GT. Colonization of mucin by human intestinal bacteria and establishment of biofilm communi-ties in a two-stage continuous culture system. Appl Environ Microbiol 2005;71:7483-7492.
29. Van den Abbeele P, Belzer C, Goossens M, et al. Butyrate-producing Clostridium cluster XIVa species specifically colonize mucins in an in vitro gut model. ISME J 2012;7:949-961.
30. Biagi E, Nylund L, Candela M, et al. Through ageing, and beyond: gut microbiota and inflammatory status in seniors and centenarians. PLoS One 2010;5:e10667.
31. Claesson MJ, Jeffery IB, Conde S, et al. Gut microbiota composition correlates with diet and health in the elderly. Nature 2012;488:178-184. 32. Weiffenbach JM, Bartoshuk LM. Taste and smell. Clin Geriatr Med
1992;8:543-555.
33. Doty RL, Shaman P, Applebaum SL, Giberson R, Siksorski L, Rosenberg L. Smell identification ability: changes with age. Science 1984;226:1441-1443.
34. Tran L, Greenwood-Van Meerveld B. In a non-human primate model, aging disrupts the neural control of intestinal smooth muscle contractility in a region-specific manner. Neurogastroenterol Motil 2014;26:410-418. 35. Hopkins MJ, Sharp R, Macfarlane GT. Age and disease related changes
in intestinal bacterial populations assessed by cell culture, 16S rRNA abundance, and community cellular fatty acid profiles. Gut 2001;48:198-205.
36. Bartosch S, Fite A, Macfarlane GT, McMurdo ME. Characteriza-tion of bacterial communities in feces from healthy elderly volunteers and hospitalized elderly patients by using real-time PCR and effects of antibiotic treatment on the fecal microbiota. Appl Environ Microbiol 2004;70:3575-3581.
37. Woodmansey EJ, McMurdo ME, Macfarlane GT, Macfarlane S. Comparison of compositions and metabolic activities of fecal microbiotas in young adults and in antibiotic-treated and non-antibiotic-treated elderly subjects. Appl Environ Microbiol 2004;70:6113-6122.
38. Bernalier-Donadille A. [Fermentative metabolism by the human gut mi-crobiota.] Gastroenterol Clin Biol 2010;34(suppl 1):S16-S22. [french] 39. Woodmansey EJ. Intestinal bacteria and ageing. J Appl Microbiol
2007;102:1178-1186.
40. Rajilić-Stojanović M, Heilig HG, Molenaar D, et al. Development and application of the human intestinal tract chip, a phylogenetic microarray: analysis of universally conserved phylotypes in the abundant microbiota of young and elderly adults. Environ Microbiol 2009;11:1736-1751. 41. Mueller S, Saunier K, Hanisch C, et al. Differences in fecal microbiota
in different European study populations in relation to age, gender, and country: a cross-sectional study. Appl Environ Microbiol 2006;72:1027-1033.
42. Mariat D, Firmesse O, Levenez F, et al. The Firmicutes/Bacteroide-tes ratio of the human microbiota changes with age. BMC Microbiol 2009;9:123.
43. Mihajlovski A, Doré J, Levenez F, Alric M, Brugére JF. Molecular evaluation of the human gut methanogenic archaeal microbiota reveals an age-associated increase of the diversity. Environ Microbiol Rep 2010;2:272-280.
44. Fernandes J, Wang A, Su W, et al. Age, dietary fiber, breath methane, and fecal short chain fatty acids are interrelated in archaea-positive humans. J Nutr 2013;143:1269-1275.
45. Gaci N, Borrel G, Tottey W, O’Toole PW, Brugère JF. Archaea and the human gut: new beginning of an old story. World J Gastroenterol 2014;20:16062-16078.
46. Tottey W, Gaci N, Borrel G, Alric M, O’Toole PW, Brugère JF. In-vitro model for studying methanogens in human gut microbiota. Anaerobe 2015;34:50-52.
47. Samuel BS, Gordon JI. A humanized gnotobiotic mouse model of host– archaeal–bacterial mutualism. Proc Natl Acad Sci USA 2006;103:10011-10016.
48. Chassard C, Goumy V, Leclerc M, Del’homme C, Bernalier-Donadille A. Characterization of the xylan-degrading microbial community from human faeces. FEMS Microbiol Ecol 2007;61:121-131.
49. Pimentel M, Lin HC, Enayati P, et al. Methane, a gas produced by enteric bacteria, slows intestinal transit and augments small in-testinal contractile activity. Am J Physiol Gastrointest Liver Physiol 2006;290:G1089-G1095.