HAL Id: insu-00338694
https://hal-insu.archives-ouvertes.fr/insu-00338694
Submitted on 14 Nov 2008HAL is a multi-disciplinary open access archive for the deposit and dissemination of sci-entific research documents, whether they are pub-lished or not. The documents may come from teaching and research institutions in France or
L’archive ouverte pluridisciplinaire HAL, est destinée au dépôt et à la diffusion de documents scientifiques de niveau recherche, publiés ou non, émanant des établissements d’enseignement et de recherche français ou étrangers, des laboratoires
Microbiotic soil crusts in the Sahel of Western Niger and
their influence on Soil POROSITY and water dynamics
Oumarou Malam Issa, Christian Défarge, Jean Trichet, C. Valentin, J.L. Rajot
To cite this version:
Oumarou Malam Issa, Christian Défarge, Jean Trichet, C. Valentin, J.L. Rajot. Microbiotic soil crusts in the Sahel of Western Niger and their influence on Soil POROSITY and water dynamics. CATENA, Elsevier, 2009, 77 (1), pp.48-55. �10.1016/j.catena.2008.12.013�. �insu-00338694�
Microbiotic soil crusts in the Sahel of Western Niger and their influence on Soil POROSITY and water dynamics
Malam Issa O. 1, *, Défarge C. 2, Trichet J. 2, Valentin C. 3 and Rajot J-L. 3
(1)
Université de Reims Champagne-Ardenne, GEGENA EA 3795, CREA 2 Esplanade
Roland Garros, 51100 Reims, France
(2)
ISTO, UMR 6113 CNRS-Université d’Orléans, BP 6759, 45067 Orléans cedex 2,
France
(3)
UR "Solutions" Institut de Recherche pour le Développement - IRD Centre de
Recherche de l'Ile de France 32, av. H. Varagnat 93143 Bondy cedex
*
Corresponding author: Email: Oumarou.Malam-Issa@orleans.inra.fr
ABSTRACT
Microbiotic soil crusts are common features of the surface of fallow land in Western
Niger. We investigated the interaction between these microbial covers and the porosity
and water dynamics of soils at the surface of a Sahelian landscape. The soil pore system
was examined by microscopic observations and mercury porosimetry. The soil water
retention capacity was measured using a Richard pressure membrane apparatus. Runoff
measurements were performed in situ at a one m2 scale under natural rainfall.
Samples with dense cyanobacterial cover had microbially-originated pores ranging from
0.04 and 50 µm in size. These samples also showed higher total soil porosity and
properties are closely related to the hydrophobic nature of cyanobacterial components.
Final runoff values obtained on densely covered surfaces were significantly higher
compared to those measured on surfaces with thin microbial cover due to the geometry
of the microbially-originated pore system and its functioning.
Keywords: Microbiotic crusts; Cyanobacteria; Exopolysaccharides; Pore geometry;
Erosion; Runoff; Water retention; Sahel.
INTRODUCTION
Microbiotic soil crusts result when communities of extremely drought-resistant
microorganisms, dominated by cyanobacteria, colonise the soil surface. These crusts are
commonly found in arid environments where the vegetation cover is sparse. In the Sahel
of Western Niger (West Africa), microbiotic soil crusts are essential components of
fallow land and “tiger bush” ecosystems (landscapes of alternating bands of vegetation
and bare ground aligned along the contours; Valentin et al., 1999; Malam Issa et al.,
1999). They occur as a surficial organo-mineral soil layer, usually associated with
physical soil crusts, i.e. soil surfaces with a compacted structure, favourable to runoff
and interrill erosion (Valentin, 1995; Ambouta, 1997). Field observations showed that
microbiotic soil crusts control the development of physical crusting and the subsequent
removal of particles. These observations were supported by laboratory studies of soil
aggregate stability and micromorphological characteristics, which demonstrated the
prominent role played by microbiotic crusts in soil particle aggregation (Malam Issa et
Despite the abundant literature, the hydrological processes taking place at the surface of
microbiotic soil crusts are far from being well understood (Belnap, 2006). In some
cases, lower infiltration rates were observed for soils with microbial cover compared to
soils with low levels or no microbial cover (Kidron et al., 1999; Eldridge et al., 2000;
Yair, 2001; Li et al., 2002, Maestre et al., 2002), while in other circumstances the
presence of microbiotic soil crusts led to either positive effects (Loope and Gifford,
1972; Belnap and Gardner, 1993; and Pérez, 1997) or had no effect on water infiltration
in soil (Eldridge et al., 1997 and Williams et al., 1999). More recently, literature
reviews from Australia, Israel and North America argued that these discrepancies result
from a combination of factors related to methodological approaches, rainfall
characteristics, soil factors and the biological composition of crusts (Eldridge, 2001;
Warren, 2001; Yair, 2001). According to Belnap (2006), data related to soil bulk
density, micro- and macropores and the structure of biological crusts are needed to
provide insight into the mechanisms explaining how microbiotic soil crusts affect
infiltration and runoff. Soil characteristics, such as porosity, may affect water transit
through the soil, depending on the connectivity and the size of pores. However, little
information is available in the literature about the porosity system of microbiotic soil
crusts, which was quantitatively investigated in only a few cases (Verrecchia et al.,
1995).
Thus, in the present work we focused on soil porosity, runoff and the water
retention capacity of soils with microbiotic crusts in Sahelian environments. The study
aimed at highlighting soil hydrological processes at the surface of microbially covered
soils in a Sahelian ecosystem. The methodological approach was based on comparisons
Results of in-situ runoff measurements are discussed in light of microscopic
investigations and laboratory measurements of soil porosity and water retention
capacity.
MATERIALS AND METHODS
The study site
The study site is located near the village of Banizoumbou in the western region
of Niger (Sahel), 70 km NE of Niamey, the capital city.
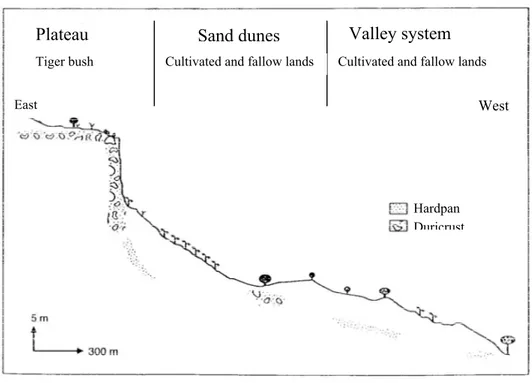
The landscape is composed of three major geomorphic units (Fig. 1; Valentin, 1995;
Courault et al., 1990):
- a plateau, formed by Tertiary fluvio-lacustrine deposits (‘Continental terminal’;
Greigert, 1966), which is dissected into several sections by erosion and has a slight
slope with a maximum of one percent ( Fig. 1; Ambouta, 1997). The plateau vegetation
shows a characteristic pattern of alternating densely vegetated bands, comprising small
trees and shrubs, and bare soil. The landscape structure is controlled by the downward
movement of water and is called ‘tiger bush’ (Ambouta, 1984; Cornet, 1992; Malam
Issa et al., 1999).
- sand dunes formed by Pleistocene stabilised-sand with a mean slope of approximately
two to five percent (Fig. 1). These are used for cropping pearl millet and cowpea, and
support vegetation areas used for pasture during fallow periods.
- valley systems, formed by aeolian, colluvial and fluvial sands, comprise broad sand
plains or sand-filled stream beds with a mean slope of three to five percent (Fig. 1).
The climate is typical of the southern Sahel, with a single rainy season lasting, roughly,
from May to mid October. Total annual rainfall amounted to 529 mm in 1996 and 534
mm in 1997. These values are slightly below the long-term average of approximately
560 mm (Le Barbé and Lebel, 1997).
Runoff was measured during the 1996 rainy season from July 16th to October 12th.
Daily rainfall varied from 0.5 to 69.5 mm (fig. 2a, 13.4 mm in average) and lasted from
93 to 160 minutes. The rainfall intensity recorded within the first minute and after 10
minutes of rain ranged from 64 to 86 mm/h and 37 to 55 mm/h, respectively. In total, 33
events occurred during the 1996 rainy season. Runoff measurements were made for
approximately 20 events.
Experimental Field parcels
The experimental parcels were located within the sand dune geomorphic unit
(Fig. 1). The textural characteristics of soils in this area are shown in table 1. These
consisted of poorly aggregated sandy materials of low organic matter content, which are
consequently prone to physical crusting. All the experimental parcels were protected
from animal disturbance and human activity. They were cut and treated with
pre-emergent herbicides to prevent plant growth. The parcels were classified into two types
depending on the age of fallow and their initial microbial cover: “densely covered” or
“thinly covered” surfaces. Densely covered surfaces comprised three parcels of nine m2
located on an area kept fallow and undisturbed for 3 years (a1, b1, c1; Table 2). The
percentage of microbial cover ranged from 75 to 80 % (Table 2). Thinly covered
surfaces comprised three similar experimental parcels located on 1-year fallow and
(physical and microbial) were mechanically destroyed to obtain an initial stage of crust
formation. The initial percentage of microbial cover ranged from 10 to 30 % (Table 2).
In situ measurements
Field experiments entailed observations and visual estimations of soil surface
cover, as well as measurements of runoff under natural rainfall. A runoff plot was set up
inside each experimental parcel by using a five centimetre high metallic frame. The
metallic frame used to isolate the runoff plot included a collector system to catch runoff
water and soil particles removed from the area. The collector system was formed by a
gutter located at the downslope side of the frame, connected to a tank by a pipe. Runoff
was measured by determining the amount of rainfall, with a pluviograph located next to
the experimental field, and the volume of water which flowed out of the plots following
rainfall events.
The soil surface cover inside the runoff plots was measured using the point-quadrats
method. The experimental plots were divided into 100 areas of 0.01 m2 each. A total of
five crust features grouped into microbial or physical types were defined on the basis of
visual criteria. Soil surface cover was estimated for the initial surface and at three
occasions throughout the rainy season.
Laboratory analyses
Two types of samples were analysed in the laboratory. The first type was a
sample of microbial cover obtained by removing the superficial layer (ca. 2-5 mm
thick), comprising living microorganisms, with a knife. The second type was devoid of
microbial cover and samples were made by collecting soil from the underlying soil
The water retention capacity, porosity and micromorphological characteristics of
the two sample types were investigated. The soil water retention capacity was
determined using a Richard pressure membrane apparatus. The samples were submitted
to pF 2.5 and 4.2. The water retained was measured by weighing the samples before and
after the experiments. Mercury porosimetry experiments were performed with a
Micromeritics 9310 porosimeter with an operating pressure between 0.003 and 200
MPa. The surface tension and contact angle between the mercury and the soil material
were 4.84 N.m-1 and 130°, respectively. The micromorphological characteristics of dry
and wet samples with microbial cover were investigated using a JEOL JSM 6400 SEM
and a high resolution Hitachi S-4200 SEM equipped with a Polaron LT 7400
cryopreparation system (Cryo-SEM).
Statistical analyses
Statistical analyses were made using XLSTAT 2006 (ADDINSOFT ™, Paris, France).
In order to compare runoff height and ratio from different plots, an analysis of
covariance (ANCOVA) was performed, with runoff as the dependent variable and
microbial cover and rainfall as covariates. Multiple comparison tests (Tuckey’s HSD)
were used to test for significant differences in water retention capacity and porosity
obtained for samples with dense and thin microbial cover and bare samples.
RESULTS
In situ observations of soil surface cover
The results of our estimations of the soil surface covered by microbial crusts are
by microbial surface crust decreased from its initial value (75-80 %) to final values
between 32 and 39 % (Table 2). The percentage of microbial cover on thinly covered
parcels also decreased from initial values (10-30 %) to 3-12 % at the beginning, and
then 0-8 % at the end of the rainy season (Table 2).
Rainfall and Runoff measurements
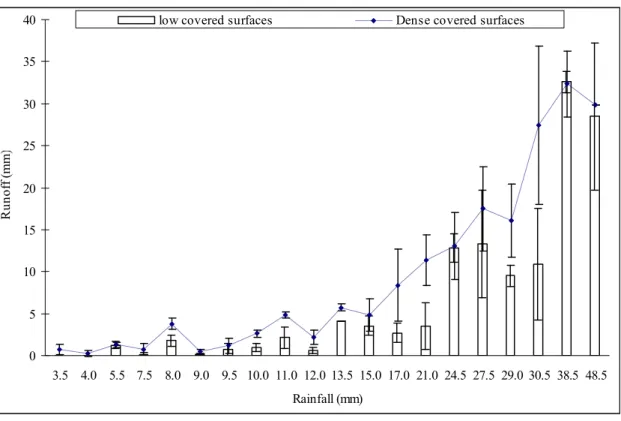
Runoff was measured under rainfall intensities ranging from 3.5 to 48.5 mm h-1. The
depth of runoff from the different experimental plots was between 0 and 39 mm (fig.
2b). Values measured at the surface of densely covered plots ranged from 0 to 37 mm
(8.3 mm in average) vs. 0 to 39 mm (6.6 mm in average) at the surface of thinly covered
plots. Runoff coefficient values ranged from 2 to 95 % (39% in average) at the surface
of dense covered plots vs. 0 to 93 % (28% in average) at the surface of thinly covered
surfaces. Statistical comparison tests (ANCOVA and Tukey HSD) of the results showed
that runoff was significantly higher, at the 95 % confidence interval, on plots with dense
microbial cover than on thinly covered plots. No runoff was detected for rainfall below
3.5 mm h-1. More runoff was produced from both plot types when a greater quantity of
rain fell during each rainstorm (fig. 2b). The x-intercepts of runoff and rainfall curves
were different for densely covered and thinly covered plots. Values of x-intercepts
obtained for the surface of densely covered plots (fig. 2b) were lower than those
obtained for thin plots (fig. 2b), which means that runoff was generated earlier at the
surface of densely covered plots compared to thinly covered plots.
The percentage of water retained by samples with dense microbial cover at pF
2.5 ranged from 12 to 14 % (mean 13 % ± 0.7, table 3). These water retention capacity
values were significantly higher, at 95 % confidence intervals, than those of thinly
covered samples (mean 7 % ± 0.5). The water retention capacity of samples with dense
microbial cover was also significantly higher than that of samples lacking microbial
cover, i.e. horizon underlying the crust (3 to 4 %, mean 3 % ± 0.6, table 3). The water
retention capacity values at pF 4.2 were not significantly different between samples
with or without microbial cover. Water retention values at pF 4.2 ranged from 2 to 4 %
(table 3, average 3 % ± 0.7), and 2 to 3 % (table 3, average 2 % ± 0.3) for soils samples
with, and without microbial cover, respectively.
Mercury porosimetry
The mean values of total pore volume ranged from 207 to 287 mm3 g-1 and 212
to 233 mm3 g-1 for samples with and without microbial cover, respectively (fig. 3). The
mean values for total pore volume were significantly higher for samples with dense
microbial cover compared to those with thin cover and the horizon underlying the crusts
(fig. 3, table 3). No significant difference was observed between thin cover samples and
samples from underneath the crust. The pore diameter corresponding to the maximum mercury intrusion was between 8.5 to 15 μm for samples with microbial cover and 27 to 35 μm for samples from the underlying horizons (fig. 3).
The cumulative pore volume curves (cpv) displayed different trends between samples (fig. 3). Mercury entry was continuous into pores between 0.006 and 400 μm in samples with dense microbial cover (fig. 3). On the contrary, samples from soil with
thin cover and crust-underlying horizons showed no or very little mercury entry for pores between 0.06 and 10 μm (fig. 3).
Micromorphological observations
The surface of bare samples was composed essentially of rounded quartz grains
with rare fine particles, whereas soils with microbial cover showed a superficial
network formed by cyanobacterial filaments (F, fig. 4) and extracellular polymer
secretions (EPS, fig. 5). The soil pore system and particle organisation differed between
samples from soil with dense microbial cover, and samples from thin cover and bare
soils. Soil with dense microbial cover showed round-shaped pores up to 50-60 µm in
diameter (arrows, fig. 4) and elongated angular-shaped pores with variable diameters
(fig. 4), both resulting from the rearrangement of filaments and EPS at the surface. At
depth, pores appeared to be caused by cyanobacteria filaments growing in the grain
inter-spaces (F, fig. 6a) and gluing these together, as well as causing finer soil particles
to adhere together (Mc, fig. 6). Pores in soils with low microbial cover were essentially
formed by the spaces between sand particles (V, top part of fig. 6b), partially filled with
fine particles (Pl, fig. 6b) and sparse filaments (F, fig. 6b). The profile underlying the
crust showed a more porous structure, comprised of tubular and interconnected packing
voids partially filled with fine particles, and vesicular and round-shaped pores formed
by particle compaction (see bottom part of fig. 6a and b). These pores were similar to
those found in bare samples.
The behaviour of the microbial cover upon wetting is illustrated in figures 3a. B.
Cyanobacteria of the genus Nostoc showed a spectacular increase in colony volume
during rewetting, when the mean diameter of the colonies grew from 50-100 µm to
(Schizotrix), with the mean diameter of individual filaments growing from 10-15 µm to
15-20 µm (Défarge et al., 1999).
DISCUSSION
Micromorphological structure of microbial crusts
Using mercury porosimetry, we observed a significant difference between the
pore system of samples with dense microbial cover and samples from soil with either
thin cover or from the horizon underlying the crust (fig.3). Samples with dense
microbial cover contained large pore volumes, and mercury entered, gradually and continuously, through pores of 400 to 0.006 μm in size (fig. 3; table 3). In contrast, the extent of mercury entry in samples of soil devoid of microbial cover and soil with thin microbial cover was low and discontinuous between 10 and 0.04 μm (fig. 3; table 3). Verrecchia et al. (1995) reported similar results with mercury porosimetry, and found a
higher proportion of small size pores (4 to 40 µm in size) in sandy soils with
microbiotic crusts compared to sandy soils without these crusts.
Characterisation of the micromorphology of the samples also suggests that
cyanobacterial cover is inducing differences in the soil pore system and soil particle
organisation (fig. 4 and 5). Soils from thin cover parcels mainly showed elongated and
rounded pores that are similar to those found in the sub-crust and bare soils. These pores
result from packing of sand and silt particles, infilling by finer particles, compaction due
to raindrop impacts and, to some extent, faunal activities and the action of plant roots
(Valentin and Bresson, 1992; Malam Issa et al., 1999). These mechanisms likely formed
the main pores revealed by mercury porosimetry in soils with thin cover, whose sizes
ranged from 100 to 400 µm. On the contrary, soils with dense microbial cover showed
between 0.04 and 50 µm (fig. 4). These pores are caused essentially by bacterial
filaments which are interwoven in a superficial network; additional pores are formed by
the remaining spaces between adjoining filaments (fig. 4). The occurrence of these
pores may be related to the physico-chemical properties of cyanobacterial material,
which include polymers of hydrophilic and hydrophobic molecules (Stanier and
Cohen-Bazire, 1977; Decho, 1990; Kidron et al., 1999). The hydrophilic molecules are
polysaccharides, known as adhesive exopolymers that help microbial cells to maintain
an association with other cells and the physical environment (Decho, 1990). The
hydrophobic molecules are glycoproteins and lipopolysaccharides; these increase the
adhesive forces between adjoining filaments (Kidron et al., 1999; Malam Issa et al.
2001). Both hydrophilic and hydrophobic components confer adhesive properties to
cyanobacterial material; these properties control the ability of filaments to adhere to one
another and bind soil particles, and hence affect the soil’s spatial organisation. The
number of microbial pores appeared to increase with the complexity of the superficial
network suggesting that the presence and geometry of the pores observed in the
microbiotic soil crusts are directly affected by cynaobacteria derived polysaccharides.
Thus, the difference in pore systems between the two types of soil samples, revealed by
mercury porosimetry, reflects the presence of micropores derived from cyanobacteria.
Those pores are expected to play a significant role in the water regime of soils with a
dense microbial cover.
Microbial cover affects water retention
We observed that water-holding by soil at field capacity (pF 2.5; table 3) of
(13 % vs. 3 % on average; table 3). High resolution Cryo-SEM investigations of
rewetted samples suggest that this high water-holding capacity is related to the
hygroscopic properties of cyanobacteria polysaccharide material (fig. 5B). The
spectacular size increase of cyanobacterial colonies in these samples, compared to dry
samples (fig. 5A), is due to water absorption and subsequent swelling of cyanobacterial
material (Galun et al., 1982; Campbell, 1979; Decho, 1990; Belnap and Gardner, 1993;
Verrecchia et al., 1995). The polysaccharide sheath and extracellular secretions of
cyanobacteria have been shown to absorb water in amounts several times their original
volume, within a period of time ranging from a few to 30 minutes (Durrell and Shields,
1961; Campbell et al., 1989; Belnap and Gardner, 1993; Verrecchia et al., 1995; Kidron
and Yair, 1997). Water absorption by swelling polysaccharide material allows
cyanobacteria to withstand osmotic and matrix water stress (De Winder et al., 1989) and
to recovery from drought periods (Ernst et al., 1987). This function also has a
significant effect on increasing soil moisture and absorption of rainfall.
Microbial cover affects water runoff
The results of runoff measurements showed that, regardless of the type of soil
cover, high runoff values were obtained. These results reflect the linear relationship
between runoff and rainfall characteristics (fig. 2b; Casenave and Valentin, 1992).
However our results also showed that water runoff is influenced by soil microbial cover;
the amount of rainfall necessary for runoff generation on densely covered surfaces was
lower than that on surfaces with thin microbial cover (fig. 2b). Final runoff measured on
densely covered surfaces was also higher compared to values obtained on surfaces with
The difference between the runoff characteristics of the two soil types is due to
the difference in micromophological features (the presence of microbial pores; fig. 4)
and the behaviour of microbial material upon wetting (fig. 5), i.e. repellence by
hydrophobic polymers and water retention by polysaccharides. Hydrophobic polymers,
which are abundant in dry soils with microbial cover, are known to prevent quick
wetting of microbiotic crusts (Kidron et al., 1999; Malam Issa et al., 2001); their
repellent effect ceases when soils become wet (Kidron et al., 1999). Earlier runoff
generation on soils with dense microbial cover is also caused by the repellent effect of
hydrophobic polymers at the beginning of rain events.
The polysaccharide material can have two types of behaviour upon wetting:
limited swelling allowing water circulation in the microbial pores, or a large degree of
swelling which reduces microbial pore size. Mazor et al. (1996) found that high
concentrations of polysaccharides in sandy soils reduced the amount of water that
penetrated the soil. By comparing microbiotic soil crusts containing different types of
polysaccharides, these authors demonstrated that runoff generation at the surface of
microbiotic soil crusts is positively correlated with the water holding capacity of
polysaccharides. According to Verrecchia et al. (1995), pores between 4 and 40 µm can
be blocked when cyanobacterial polysaccharide material absorbs water and swells. The
polysaccharide content of samples with a dense microbial cover is 1.5 to 3 times higher
than that of samples with low microbial cover (Malam Issa et al., 2001). Our cryo-SEM
images show the spectacular increase in the size of cyanobacterial colonies during
wetting of microbiotic crusts due to the swelling of polysaccharide material in their
cyanobacteria, and subsequently induces the high amount of runoff found on
well-developed microbial cover.
The roles of other factors, such as soil texture, in runoff generation on soil with
microbial cover, may also be considered. In microbial soil crusts of Western Niger, soil
texture is greatly affected by accretion of fine airborne particles which are trapped by
cyanobacterial material. Accumulation of these particles, observed in thin soil sections,
may also contribute to pore clogging and thus to runoff generation on soil with dense
microbial cover.
These results agree with work supporting the positive role of microbial cover in
runoff generation (Kidron et al., 1999, Eldridge et al., 2000, Yair, 2001). Soil surfaces
with dense microbial cover in the Sahelian environment of Western Niger are thus
potential areas which may contribute to capture limited water resources. Nevertheless,
further studies are needed to evaluate the potential role of microbial cover in water
redistribution in this environment. In particular, the impact of underlying physical crusts
should be investigated, this influence could be different depending on the degree of
microbial cover.
CONCLUSION
This study provides new data on the impact of microbiotic crusts on soil porosity
and water dynamics in a Sahelian environment. Our findings confirm that microbiotic
crusts are instrumental in generating high runoff. The results also show that
polysaccharides and hydrophobic polymers of cyanobacteria affect the porosity of soil
of microbial pores, which itself is closely related to water holding capacity and the
hydrophilic nature of cyanobacterial components. Hydrophobic polymers prevent quick
wetting of soils with dense microbial cover, and the swelling of polysaccharide material
reduces the effective porosity of soil, leading to early and high levels of runoff being
generated on these soils. Thus, microbial soil covers could potentially contribute to
form runoff-run-on systems that would help capture the limited water resources in the
Sahelian environment of Western Niger. This could be beneficial for plant growth in
tiger bush and fallow lands.
ACKNOWLEDGEMENTS
This study formed part of a research programme in West Africa (Projet Jachère) funded by the EU and IRD (Institut de Recherche pour le Développement). The authors gratefully acknowledge J-L. Rajot, Soumana, Alfari, Aboubacar, Abdoulaye and Moumouni for help with field work, and X. Dorothière, H. Gaillard, A. Genty, C. Le Lay, and A. Richard for their skilled technical assistance. The authors thank G. J. Kidron, Leigh Gebbie and an anonymous reviewer for their constructive suggestions and correction of the manuscript and the English.
REFERENCES
Ambouta, J.M.K., 1984. Contribution à l’édaphologie de la brousse tigrée de l’ouest
nigérien. Thèse de docteur ingénieur, Université Nancy I, France.
Ambouta, J.M.K., 1997. Définition et caractérisation des structures de végétation
contractée au Sahel : cas de la brousse tigrée de l’ouest nigérien. In J.-M. d’Herbès,
J.M.K. Ambouta, R. Peltier (Editors.), Fonctionnement et gestion des écosystèmes
Belnap, J., Gardner, J.S., 1993. Soil microstructure in soils of the Colorado Plateau: the
role of the cyanobacterium Microcoleus vaginatus. Great Basin Naturalist, 53: 40-47.
Belnap, J., Eldridge, D.J., 2001. Disturbance and recovery of biological soil crusts. In: J.
Belnap, O.L. Lange (Editors), Biological soil crusts: structure, function and
management. Springer, Berlin, pp. 363-383.
Belnap, J., 2006. The potential roles of biological soil crusts in dryland hydrologic
cycles. Hydrological Processes, 20: 3159-3178.
Campbell, S.E., 1979. Soil stabilization by prokaryotic desert crust: implications for
Precambrian land biota. Origin of Life, 9: 335-348.
Campbell, S.E., Seeler J.S., Golubic S., 1989. Desert crust formation and soil
stabilization. Arid Soil Res. Rehab., 3: 217-228.
Casenave, A., Valentin, C., 1992. A runoff capability classification system based on
surface features criteria in semi-arid areas of West Africa. J. Hydrol., 130: 231-249.
Cornet, A., 1992. Relations entre la structure spatiale des peuplements végétaux et le
bilan hydrique des sols de quelques phytocénoses en zone aride. In E. Le Floc'h, M.
Grouzis, A. Cornet, J.-C. Bille (Editors.), L'aridité, une contrainte au développement.
ORSTOM éditions, coll. Didactiques, Paris, France, pp. 241-261.
Courault, D., D'Herbes, J.M., Valentin, C., 1990. Le bassin versant de Sama Dey :
premières observations pédologiques et phyto-écologiques. ORSTOM, Paris.
Danin, A., Bar-Or, Y., Dor, I, Yisraeli, T., 1989. The role of cyanobacteria in
stabilisation of sand dunes in Southern Israel. Ecologia Mediterranea, XV: 55-64.
Decho, A.W., 1990. Microbial exopolymer secretions in ocean environments: their
Défarge, C., Malam Issa, O., Trichet, J., 1999. Apports du Cryo-microscope
électronique à balayage à émission de champ à l'étude des matières organiques et des
relations organo-minérales naturelles. II. Application aux croûtes microbiotiques des
sols. Comptes Rendus Acad. Sciences, 328: 591-597.
De Winder, B., Matthijs, H.C.P, Mur, L.R., 1989. The role of water retaining substrata
on the photosynthetic response of three drought tolerant phototrophic micro-organisms
isolated from a terrestrial habitat. Archives of Microbiology, 152: 458-462.
Durell, L.W., Shields, L.M., 1961. Characteristics of soil algae relating to crust
formation. Transactions of the American Microscopical Society, 80: 73-79.
Eldridge, D.J., 2001. Biological soil crusts and water relations in Australia deserts. In: J.
Belnap, O.L. Lange (Editors), Biological soil crusts: structure, function and
management. Springer, Berlin, pp. 315-325.
Eldridge, D.J., Tozer, M.E., Slangen, S., 1997. Soil hydrology is independent of
microphytic crust cover: Further evidence from wooded semiarid Australian
rangeland. Arid Soil Res. Rehab., 11: 113-126.
Eldridge, D.J., Zaady, E., Shachak, M., 2000. Infiltration through three contrasting
biological soil crusts in patterned landscape in the Negev, Israel. Catena, 40: 323-336.
Ernst, A., Chen, T., Böger, P., 1987. Carbohydrate formation in rewetted terrestrial
cyanobacteria. Oecologia, 72: 574-576.
Galun, M., Burbick, P., Garty, J., 1982. Structural and metabolic diversity of two desert
lichen populations. J. Hattori Bot. Lab., 53, 321-324.
Greigert, J., 1966. Description des formations crétacés et tertiaires du bassin des
Iullemmeden (Afrique occidentale). Publications de la Direction Mines et Géologie,
Kidron, G.J., Yair, A., 1997. Rainfall-runoff relationship over encrusted dune surfaces,
Nizzana, Western Negev, Israel. Earth Surf. Processes. Landf., 22, 1169-1184.
Kidron, G.J., Yaalon, D.H., Vonshak, A., 1999. Two causes of runoff initiation on
microbiotic crusts : hydrophobicity and pore clogging. Soil Science, 164: 18-27.
Le Barbé, L. and Lebel, T., 1997. Rainfall climatology of the HAPEX-Sahel region
during the years 1950-1990. J. Hydrol., 188-189: 43-73.
Li, X.-R., Wang, X.-P., Li, T., Zhang, J.-G., 2002. Microbiotic soil crust and its effect
on vegetation and habitat on artificially stabilised desert dunes in Tengger Desert,
North China. Biol. Fertil. Soils, 35: 147-154.
Loope, W.L., Gifford, G.F., 1972. Influence of a soil microfloral crust on select
properties of soils under pinyon-juniper in southeastern Utah. Journal of Soil and
Water Conservation, 27: 164-167.
Maestre, F.T., Huesca, M., Said, E., Bautista, S., Cortina, J., 2002. Infiltration,
penetration resistance and microphytic crust composition in contrasted microsites
within a Mediterranean semi-arid steppe. Soil Biol. Biochem., 34: 895-898.
Malam Issa, O., Trichet, J., Défarge, C., Couté, A., Valentin, C., 1999. Morphology and
microstructure of microbiotic soil crusts on a tiger bush sequence (Niger, Sahel).
Catena, 37: 175-196.
Malam Issa, O., Le Bissonnais, Y., Défarge, C., Trichet, J., 2001. Role of a microbial
cover on structural stability of a sandy soil in Sahelian part of western Niger.
Geoderma, 101: 15-30.
Mazor, G., Kidron, G.J., Vonshak, A., Abeliovich, A., 1996. The role of cyanobacterial
exopolysaccharides in structuring desert microbial crusts. FEMS Microbiology
Pérez, F.L., 1997. Microbiotic crusts in the high equatorial Andes, and their influence
on paramo soils. Catena, 31: 173-198.
Stanier, R.Y., Cohen-Bazire, G., 1977. Phototrophic prokaryotes: the cyanobacteria.
Annu. Rev. Microbiol., 31: 225-274.
Valentin, C., 1995. Sealing, crusting and hardesetting soils in sahelian agriculture. In
H.B. SO, G.D. Smith, S.R. Raine, B.M. Schafer, R.J. Loch (Editors.), Sealing,
Crusting and Hardsetting Soils: Productivity and Conservation. Australian Society of
Soil Science, Brisbane, pp. 53-76.
Valentin, C., Bresson L.-M., 1992. Morphology, genesis and classification of surface
crusts in loamy and soils. Geoderma, 55: 225-245.
Valentin, C., d'Herbes, J.-M., Poesen, J., 1999. Soil and water components of banded
vegetation patterns. Catena, 37: 1-24.
Verrecchia, E., Yair, A., Kidron, G.J., Verrecchia, K., 1995. Physical properties of the
psammophile cryptogamic crust and their consequences to the water regime of sandy
soils, north-western Negev desert, Israël. Journal of Arid Environments, 29: 427-437.
Warren, S.D., 2001. Biological soil crusts and hydrology in North American deserts. In:
J. Belnap, O.L. Lange (Editors), Biological soil crusts: structure, function and
management. Springer, Berlin, pp. 327-337.
Williams, J.D., Dobrowolski, J.P., West, N.E., 1999. Microbiotic crust influence on
Unsaturated hydraulic conductivity. Arid Soil Res. Rehab., 13: 145-154.
Yair, A., 2001. Effects of biological soil crusts on water redistribution in the Negev
desert, Israel: a case study in longitudinal dunes. In: J. Belnap, O.L. Lange (Editors),
Biological soil crusts: structure, function and management. Springer, Berlin, pp.
FIGURE CAPTIONS
Figure 1: Mean geomorphic elements found at Banizoumbou (modified from Courault
et al., 1990).
Figure 2a: Rainfall events throughout1996.
Figure 2b: Relationship between rainfall depth and runoff at the surface of soils with
dense (dotted line) and thin microbial cover (box).
Figure 3: Cumulative pore volume curves for microbiotic crust samples and samples
taken below these same crusts. Note the difference between microbiotic crust samples
with dense microbial cover (cross) and thin microbial cover (square) and samples from
the underlying horizon (round). Note similar trends between microbiotic crust samples
from soil with thin microbial cover and samples from under crusts.
Figure 4: SEM micrographs of the surface of soil covered with a dense microbial layer.
View showing the network of cyanobacterial filaments (F) enmeshing soil mineral
particles (Q). Note the presence of pores due to microbial cover, including rounded
pores delineated by filaments (arrows) and elongated pores between adjoining
filaments.
Figure 5: Cryo-SEM micrographs of the surface of soil with a dense cover of Nostoc
cyanobacteria. The filaments are grouped in globose colonies (B). The surface also
comprises filaments (F) of other cyanobacteria, cyanobacteria extracellular polymer
secretions (EPS), and soil mineral particles (Q). (A) View of dry sample. (B) View of
sample after rewetting.
Figure 6: Photomicrographs of thin sections. (A) View of the soil profile with a dense
associated with mineral particles (at the top), alternation of layers of fine (Pl) and coarse
(Q) particles, and ancient microbiotic crusts (arrows). Note the close fabric formed of
coarse and fine particles associated with cyanobacterial filaments (F). The sub-crust (at
the bottom) consists of coarse particles (Q) and shows a loose fabric with large pores
(V).
(B) View of the soil profile with thin microbial cover. The profile shows a superficial
discontinuous layer of living cyanobacteria (arrowed) associated with fine mineral
particles. Few cyanobacterial filaments (F) were observed among the soil profile. The
crust-underlying horizon (at the bottom) consists of aggregates (A), coarse (Q) and fine
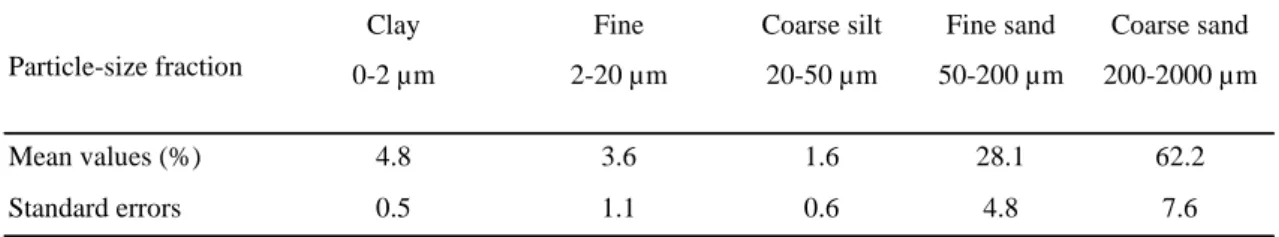
Table 1: textural characteristics of the studied soil.
Clay Fine Coarse silt Fine sand Coarse sand
0-2 µm 2-20 µm 20-50 µm 50-200 µm 200-2000 µm
Mean values (%) 4.8 3.6 1.6 28.1 62.2
Standard errors 0.5 1.1 0.6 4.8 7.6
Particle-size fraction
Table 2: Soil surface conditions of the experimental plots: initial and value of microbial cover measured at the beginning, during and at the end of runoff measurements periods.
Initial (15/06/96) 16/07/1996 04/09/96 23/10/1996 Period of observations
35
5 Soil with
dense microbial cover
Soil with thin microbial cover
80 14 62 3 50 4
Table 3: Water retention capacity and total pore volume measured by mercury porosimetry of samples with and samples devoid of microbial cover. (Mean values of 2 to 4 replicates).
pF 2.5 pF 4.2
% %
Soil with
dense microbial cover 13 ±0.7 3 ±0.7 Soil with
thin microbial cover 7 ±0.5 2 ±0.3 horizon underlying
the crust 3 ±0.6 2 ±0.3
Total pore volume mm3 g-1 280 ±10
210 ±4
Figure 1 : Figure 2a : 0 10 20 30 40 50 60 70 80 20 /4 2/6 9/6 25 /6 29 /6 7/7 22 /7 23 /7 27 /7 3/8 7/8 12 /8 15 /8 18 /8 21 /8 25 /8 27 /8 29 /8 4/9 10 /9 14 /9 19 /9 6/ 10 Date (day/month) R ai nf al l d ep th ( m m ) 10m 10m Hardpan Duricrust
Plateau Sand dunes Valley system
Tiger bush Cultivated and fallow lands Cultivated and fallow lands
East West
Figure 2b : 0 5 10 15 20 25 30 35 40 3.5 4.0 5.5 7.5 8.0 9.0 9.5 10.0 11.0 12.0 13.5 15.0 17.0 21.0 24.5 27.5 29.0 30.5 38.5 48.5 Rainfall (mm) R un of f ( m m )
low covered surfaces Dense covered surfaces
Figure 3 0 50 100 150 200 250 300 0.001 0.01 0.1 1 10 100 1000 Pore size (mm) C um ul at iv e po re v ol um e (m m 3/ g)
Figure 5A