Publisher’s version / Version de l'éditeur:
Vous avez des questions? Nous pouvons vous aider. Pour communiquer directement avec un auteur, consultez la
première page de la revue dans laquelle son article a été publié afin de trouver ses coordonnées. Si vous n’arrivez pas à les repérer, communiquez avec nous à PublicationsArchive-ArchivesPublications@nrc-cnrc.gc.ca.
Questions? Contact the NRC Publications Archive team at
PublicationsArchive-ArchivesPublications@nrc-cnrc.gc.ca. If you wish to email the authors directly, please see the first page of the publication for their contact information.
https://publications-cnrc.canada.ca/fra/droits
L’accès à ce site Web et l’utilisation de son contenu sont assujettis aux conditions présentées dans le site LISEZ CES CONDITIONS ATTENTIVEMENT AVANT D’UTILISER CE SITE WEB.
2nd International RILEM Symposium on Advances in Concrete Through Science and Engineering [Proceedings], pp. 355-366, 2006-09-01
READ THESE TERMS AND CONDITIONS CAREFULLY BEFORE USING THIS WEBSITE.
https://nrc-publications.canada.ca/eng/copyright
NRC Publications Archive Record / Notice des Archives des publications du CNRC :
https://nrc-publications.canada.ca/eng/view/object/?id=19ba5b1a-c171-48e5-bbb6-e15dda8de5d0 https://publications-cnrc.canada.ca/fra/voir/objet/?id=19ba5b1a-c171-48e5-bbb6-e15dda8de5d0
NRC Publications Archive
Archives des publications du CNRC
This publication could be one of several versions: author’s original, accepted manuscript or the publisher’s version. / La version de cette publication peut être l’une des suivantes : la version prépublication de l’auteur, la version acceptée du manuscrit ou la version de l’éditeur.
Access and use of this website and the material on it are subject to the Terms and Conditions set forth at The Effect of nano-sized CaCO3 addition on the hydration of OPC containing high volumes of ground granulated blast-furnace slag
http://irc.nrc-cnrc.gc.ca
T he Effe c t of na no-size d Ca CO3 a ddit ion
on t he hydrat ion of OPC c ont a ining high
volum e s of ground gra nulat e d bla st
-fur na c e sla g
N R C C - 4 6 6 5 4
S a t o , T . ; B e a u d o i n , J . J .
A version of this document is published in / Une version de ce
nddocument se trouve dans : 2 International RILEM
Symposium on Advances in Concrete through Science and
Engineering, Québec City, Sept. 11-13, 2006, pp. 355-366
THE EFFECT OF NANO-SIZED CaCO
3ADDITION ON THE
HYDRATION OF OPC CONTAINING HIGH VOLUMES OF GROUND
GRANULATED BLAST-FURNACE SLAG
Taijiro Sato and James J. Beaudoin
Institute for Research in Construction, National Research Council Canada
Abstract
The use of high volumes of supplementary cementing materials in cement systems is considered strategic with respect to sustainable development issues. The decreased rate of hydration at early ages, however, continues to be a disadvantage. The accelerating effect of nano-sized CaCO3 addition to ordinary Portland cement paste (OPC) containing high volumes of ground granulated blast-furnace slag (GGBFS) in lieu of micro-sized CaCO3 addition was investigated by conduction calorimetry and determinations of microhardness and modulus of elasticity. The results indicate that the hydration of OPC containing high volumes of GGBFS is significantly accelerated by the nano-sized CaCO3 addition. The times of occurrence of the main calorimetry peaks are remarkably decreased and the rate of heat development increases depending on the amount of the nano-sized CaCO3 addition. It is apparent from the calorimetry results and the engineering properties of the systems studied that the nano-sized CaCO3 addition to cement systems containing high volumes of GGBFS fully compensates for the delayed hydration process.
1. INTRODUCTION
Sustainable development has been an intensive topic in the field of cement-based construction materials. The cement industry has made significant progress in its effort to conserve energy and resources and to enhance the quality of its products. The amount of CO2 emitted in the course of cement manufacture accounts for 7% of the total CO2 emissions in the world [1]. Use of higher volumes of ground granulated blast-furnace slag (GGBFS), one of the most common supplementary cementing materials (SCMs), in a concrete mix as a partial replacement of ordinary Portland cement (OPC) serves to reduce the CO2 emissions and save the energy and natural resources. One of the major disadvantages of concrete
containing high volumes of SCMs however is the delayed initial setting and slower early strength development. This is critical especially in terms of concrete form stripping at construction sites.
The ground limestone (CaCO3) has been used to replace a certain portion of OPC in the concrete mix to save the energy and natural resources. The Canadian Standards Association, CSA and the American Society for Testing and Materials, ASTM allow a maximum of 5% addition of limestone to Portland cement in Canada and US, respectively. In Europe, the British / European Standard, BS EN 197-1 specifies “Portland limestone cement” which contains 6% to 35% of the ground limestone. The addition of CaCO3 was first considered as a simple replacement of a more valuable material (OPC) by a less valuable material (limestone). A number of studies, however, have indicated positive effects of the CaCO3 addition on the hydration of cement and strength development of hardened concrete, especially its accelerating effect on the rate of the hydration. The accelerating effect of the finely ground CaCO3 was observed on the hydration of C3S [2]. It was concluded that the hydration of C3S was accelerated by the addition of finely ground CaCO3 and the greater the CaCO3 content, the greater was the accelerating effect. The influence of the finely ground limestone addition on the hydration of OPC was also investigated and the accelerating effect of limestone was observed [3].
Nanotechnology has made it possible to synthesize a nano-sized CaCO3 within a relatively reasonable cost to be used for construction purposes. The accelerating effect of the nano-sized CaCO3 addition, as opposed to the reagent grade micro-sized CaCO3 addition, on the delayed hydration of OPC containing high volumes of GGBFS was investigated in this study.
2. EXPERIMENTAL
Type GU CSA cement was supplied by the Lafarge North America, Herndon, Virginia, USA. GGBFS was supplied by the Standard Slag Cement Co., Fruitland, Ontario, Canada. Reagent grade CaCO3 was supplied by the Anachemia Canada Inc., Montreal, Quebec, Canada. The nitrogen BET surface area measurement was 0.35 m²/g. A nano-sized CaCO3 was supplied by the READE, Riverside, Rhode Island, USA. The BET surface area measurement was 20.50 m²/g. The scanning electron microscope (SEM) images of reagent grade micro-sized CaCO3 and nano-sized CaCO3 are shown in Figures 1 (a) and (b), with magnifications of ×5,000 and ×50,000, respectively. The average particle size of the micro-sized CaCO3 is approximately 5 to 20 μm, whereas that of nano-micro-sized CaCO3 is about 50 to 120 nm.
The nitrogen BET surface area measurement was determined using the Quantachrome Corporation, Quantasorb Sorption System. A powder sample was dried in a heating mantle at 140°C for 10 minutes prior to the measurement. The SEM analysis was conducted using the Hitachi S-4800 Field Emission Scanning Electron Microscope, with the accelerating voltage and the emission current at 2.0 kV and 10 mA, respectively. The Thermometric TAM Air Isothermal Calorimeter, 3114/3236 was used for the conduction calorimetry. The instrument was set at 24°C and located in a 24°C-conditioned lab. The conduction calorimetry was conducted for two series of specimens which are summarized in Table 1. The CaCO3 content percentages for Series 1 are based on the mass of OPC excluding that of CaCO3. The OPC with and without CaCO3 was mixed with deaerated water for a w/c ratio of 0.5 based on the mass of OPC. The rate of heat development was calculated in calories per mass of OPC
(excluding that of CaCO3) per hour. The GGBFS content percentages for Series 2 are based on the total mass of OPC and GGBFS excluding that of CaCO3. The w/c ratio was 0.5 based on the mass of OPC and GGBFS. The rate of heat development was calculated in calories per mass of OPC and GGBFS (excluding that of CaCO3) per hour.
(a) (b)
Figure 1: SEM images of (a) reagent grade micro-sized CaCO3 and (b) nano-sized CaCO3 Table 1: Specimen descriptions
Specimens
Series 1
OPC
OPC + Nano-sized CaCO3 [10%] OPC + Micro-sized CaCO3 [10%] OPC + Nano-sized CaCO3 [20%] OPC + Micro-sized CaCO3 [20%]
Series 2
OPC
OPC + GGBFS [50%]
OPC + GGBFS [50%] + Nano-sized CaCO3 [10%] OPC + GGBFS [50%] + Micro-sized CaCO3 [10%] OPC + GGBFS [50%] + Nano-sized CaCO3 [20%] OPC + GGBFS [50%] + Micro-sized CaCO3 [20%]
Thermogravimetric analysis (TGA) was conducted, using a TA Instruments, Q600, to calculate the amount of CaCO3 in a specimen at various hydration periods. The temperature was ramped from room temperature to 1050°C at 10°C/min with a 100 ml/min nitrogen gas flow. TGA was conducted for the same series of specimens indicated in Table 1. All the specimens were mixed with deaerated water and cured at 23°C. The specimen was demoulded the day following the casting and cured at 23°C for a desired hydration period. The specimen was immersed in isopropyl alcohol for 1 day and dried under vacuum for another day in order to stop hydration at a specific period prior to TGA. The amount of CaCO3 in the specimen was calculated based on the total mass of OPC and CaCO3. The microhardness determination was performed using the DURIMET, Small-hardness Tester. The Clemex light microscope was used to measure the dimension of the indentation. A hydrated specimen was sliced into a circular plate, about 31.5 mm in diameter and 1.0 mm in thickness. An extra care was taken 2
for slicing the specimen in order to provide as a smooth surface as possible. The modulus of elasticity was determined using an instrument designed and fabricated at the Institute for Research in Construction, National Research Council Canada, shown in Figure 2. A circular plate specimen with approximately 31.5 mm in diameter and 1.0 mm in thickness supported at 3 points was tested with centre point loading. The deflection at the centre point was recorded. The helium pycnometry method was used to determine the porosity of a specimen using the Quantachrome Corporation, Stereopycnometer. A circular plate specimen was prepared in the same manner as for the TGA. The specimen was immersed in isopropyl alcohol for 1 day and dried under vacuum for 1 day. It was then weighed and its dimensions were determined before the testing in order to calculate the bulk volume of the specimen.
Loading Weights Loading Platform Specimen Compressometer Supports 120° a Supports Circular Specimen Point of Loading 1.00 mm P 35.00 mm
Figure 2: A schematic of a testing instrument used to determine modulus of elasticity of hydrated cement systems
3. RESULTS AND DISCUSSION
The effect of the additions of the reagent grade micro-sized CaCO3 and nano-sized CaCO3 on the hydration of the control OPC is discussed in the first part of this section (Series 1 in Table 1). The OPC was mixed with the additions of both micro- and nano-sized CaCO3 and a difference in their accelerating effects was observed. In the second part of this section, the effect of the additions of the reagent grade micro-sized CaCO3 and nano-sized CaCO3 on the hydration of OPC containing high volumes of GGBFS is discussed (Series 2 in Table 1). The efficacy of the nano-sized CaCO3 addition with respect to its ability to compensate for the delayed early hydration caused by the presence of high volumes of GGBFS was determined. The hydration, up to 28 days was also studied in order to observe the effect of accelerated early hydration on the long-term strength development.
3.1 The effect of micro- and nano-sized CaCO3 additions on the hydration of OPC
The calorimetry results for the control OPC and OPC containing 10% and 20% additions of reagent grade micro-sized CaCO3 and nano-sized CaCO3 are shown in Figure 3. The curves for the control OPC and those for the OPC containing 10% and 20% additions of micro-sized CaCO3 are almost overlapped, indicating that the additions of micro-sized CaCO3 have little or almost no effect on the hydration of OPC in terms of the rate of heat development. It is clear, however, that both 10% and 20% additions of the nano-sized CaCO3
significantly accelerate the early hydration of OPC. The first large peak of the main heat development curve for the control OPC and the OPC containing 10% and 20% nano-sized CaCO3 additions occurs at approximately 9.5, 5.8 and 4.8 hours, respectively. It is also evident that the greater the amount of CaCO3 addition, the greater is the accelerating effect.
0 1 2 3 4 5 0 1 2 3 Time, d
Rate of Heat Development,
Cal/g/h
OPC
OPC + Micro-sized CaCO3 [10%]
OPC + Nano-sized CaCO3 [20%]
OPC + Micro-sized CaCO3 [20%]
OPC + Nano-sized CaCO3 [10%]
10 hours
Figure 3: Calorimetry curves for control OPC and OPC with the additions of micro- and nano-sized CaCO3
The TGA was conducted for the same series of the specimens to determine the amount of CaCO3 in the specimens hydrated for 10 hours, 1 day and 3 days. The amount of CaCO3 in the specimens hydrated for 10 hours, 1 day and 3 days, is calculated from the TGA results and shown in Figure 4. 0 5 10 15 20 0 1 2 3 Time, d Amount of CaCO 3 , % OPC OPC + Micro-sized CaCO3 [10%] OPC + Nano-sized CaCO3 [20%]
OPC + Micro-sized CaCO3 [20%]
OPC + Nano-sized CaCO3 [10%]
Figure 4: The amounts of CaCO3 detected for OPC and OPC with the additions of micro- and nano-sized CaCO3 hydrated for 10 hours, 1 day and 3 days as determined by TGA
A certain amount of CaCO3 was constantly observed for the control OPC throughout the hydration, indicating that the anhydrous OPC powder might have been carbonated during the storage period. It is important to note that the amount of CaCO3 detected in each specimen is lower than the amount added to the mix and it decreases as hydration takes place. Correcting for the amount of CaCO3 in the control OPC, the CaCO3 content of specimens with the 10% and 20% micro-sized CaCO3 additions decreased by about 1.70% and 4.64% after 10 hours hydration, respectively. This decrease with the micro-sized CaCO3 was previously observed in C3S pastes [2]. It was suggested that the missing carbonates may be chemisorbed or even enter the interlayer region of C-S-H. The decrease of CaCO3 content becomes more predominant for the nano-sized CaCO3 addition. The CaCO3 content of the OPC containing 10% and 20% nano-sized CaCO3 addition decreased by approximately 4.26% and 8.61%, respectively after 10 hours hydration. It is clear that some portion of the added CaCO3 has interacted with the hydrated cement in the hydration process and/or was not detected by means of TGA.
It has been observed that the CaCO3 can chemically react with tricalcium aluminate (C3A) to form calcium carboaluminate hydrates [4, 5]. It can form both high- and low- carbonate forms of calcium aluminate hydrates in a very similar manner as C3A reacts with calcium sulphate (gypsum), CaSO4·2H2O to form both high- and low- sulphate forms of calcium aluminate hydrates. The high- and low- carbonate forms of calcium aluminate hydrates are respectively, 3CaO·Al2O3·3CaCO3·32H2O and 3CaO·Al2O3·CaCO3·11H2O. They are very similar to those of calcium sulphoaluminate hydrates, 3CaO·Al2O3·3CaSO4·32H2O (ettringite) and 3CaO·Al2O3·CaSO4·12H2O. The high-carbonate form, 3CaO·Al2O3·3CaCO3·32H2O occurs as a needle-like structure which is similar to that observed for ettringite [6]. It is widely known that the calorimetry curve of control OPC has a small shoulder right after the main peak of hydration, shown in Figure 3. It has been suggested that this is related to the formation of ettringite [7]. This small shoulder is significantly enhanced when the 20% nano-sized CaCO3 was added. The SEM images of the control OPC and the OPC containing 20% nano-sized CaCO3 addition hydrated for 10 hours are shown in Figures 5 (a) and (b), respectively.
(a) (b)
Figure 5: SEM images of (a) control OPC and (b) OPC with 20% nano-sized CaCO3 addition hydrated for 10 hours
In the control OPC, no typical needle-like characteristics of ettringite can be observed, because the amount of ettringite formed at 10 hours hydration is not sufficient enough to be observed by SEM, although the formation of ettringite itself starts within a few hours after mixing with water. In the OPC with the 20% nano-sized CaCO3 addition, however, the needle-like characteristics can be observed where the reaction peak has occurred before 10 hours by the presence of the nano-sized CaCO3. This could be a mixture of ettringite and 3CaO·Al2O3·3CaCO3·32H2O. The reaction between C3A and gypsum could be accelerated by the nano-sized CaCO3 addition and/or there could be a reaction between C3A and the added CaCO3, itself. Nevertheless, the formation of 3CaO·Al2O3·3CaCO3·32H2O was minimum. A previous study reported on the effect of the addition of finely ground limestone on the hydration of C3S [2]. It was concluded that some portion of the added CaCO3 had consumed during the hydration of C3S. This indicates that the added CaCO3 may also be consumed in the hydration of C3S and the amount of the added CaCO3 that may react with C3A can be very small.
3.2 The effect of micro- and nano-sized CaCO3 additions on the hydration of OPC
containing high volumes of GGBFS
It is commonly known that the rate of hydration of OPC containing high volumes of SCMs is significantly reduced along with the rate of early strength development. The calorimetry curves for OPC, OPC containing 50% GGBFS and OPC containing 50% GGBFS with the additions of both micro- and nano-sized CaCO3 are shown in Figure 6.
0 1 2 3 4 0 1 2 Time, d
Rate of Heat Developmenet,
Cal/g/h
3 OPC
OPC + GGBFS + Micro-sized CaCO3 [10%] OPC + GGBFS + Nano-sized CaCO3 [20%]
OPC + GGBFS + Micro-sized CaCO3 [20%]
OPC + GGBFS + Nano-sized CaCO3 [10%] OPC + GGBFS [50%]
Figure 6: Calorimetry curves for OPC, OPC containing 50% GGBFS and OPC containing 50% GGBFS with the additions of micro- and nano-sized CaCO3
In terms of the peak positions, the OPC containing 50% GGBFS is not delayed as significantly as that containing high volumes of other SCMs, however the rate of heat development is remarkably decreased. This would result in the delay of early strength development. The calorimetry curves for OPC containing 50% GGBFS with the additions of both 10% and 20% micro-sized CaCO3 are essentially overlapped with that for OPC containing 50% GGBFS, indicating that they had a little or no effect on the hydration of OPC
in terms of heat development. The rate of heat development was, however, much improved by the additions of the 10% and 20% nano-sized CaCO3. A considerable improvement on the mechanical properties might be expected.
Microhardness determinations were performed to investigate the mechanical property of the specimens. Microhardness data for control cement pastes correlate well with compressive strength data [8]. The microhardness values of OPC, OPC containing 50% GGBFS and OPC containing 50% GGBFS with the additions of micro- and nano-sized CaCO3 for the hydration up to 3 days and 28 days are shown in Figures 7 (a) and (b), respectively. In Figure 7 (a), it is clearly indicated that the strength development of the OPC containing 50% GGBFS is significantly delayed. The microhardness values at 1 day hydration for the control OPC and that containing 50% GGBFS are 48.2 MPa and 12.0 MPa, respectively. However, the microhardness value becomes 29.0 MPa when the 20% nano-sized CaCO3 was added. The addition of 10% nano-sized CaCO3 is as effective as that of 20% at 1 day hydration. The additions of micro-sized CaCO3 resulted in only a modest effect on the rate of heat development shown in Figure 6. The improvement of strength development, however, can be observed from the determinations of microhardness. A small difference observed in terms of rate of heat development resulted in a large difference in terms of values of mechanical properties. 0.0 20.0 40.0 60.0 80.0 100.0 120.0 140.0 160.0 0 10 20 Time, d 30 0.0 20.0 40.0 60.0 80.0 100.0 0 1 2 3 Time, d Microhardness, MPa
Legend is the same as Figure 6
(a) (b)
Figure 7: Microhardness values for OPC, OPC containing 50% GGBFS and OPC containing 50% GGBFS with the additions of micro- and nano-sized CaCO3 for the hydration period up
to (a) 3 days and (b) 28 days
It was suggested previously that some portion of the added CaCO3 reacts during the hydration of OPC to form calcium carboaluminate hydrates. The formation of calcium carboaluminate hydrates, however, is not solely responsible for the improved strength development with the additions of nano-sized CaCO3. It may not even be relevant to the improvement of strength development. One of the reasons is that the high carbonate form of calcium aluminate hydrates, 3CaO·Al2O3·3CaCO3·32H2O, detected by the calorimetry in
Figure 3 and the SEM analysis in Figure 5 (b) respectively, might not contribute significantly to the strength development, assuming its behaviour is analogous with ettringite, that would appear to have a small direct effect on the strength development. Another reason might be that, in addition to the small shoulder of the calorimetry curve, the main peak of the calorimetry curve was enhanced and accelerated by the additions of nano-sized CaCO3 as shown in Figure 3. This main peak is primarily attributed to the hydration of C3S that is the key part of strength development. It is apparent that the accelerated hydration of C3S in the OPC is responsible for this significant strength development. The study on the hydration of C3S with the finely ground limestone addition mentioned in the previous section noted that the products formed between the hydrating C3S and the added CaCO3 could not be identified, as they were present in only small amounts [2]. This suggests that there must be something else responsible for accelerating the C3S hydration and significant strength development. One possibility is that the nano-sized CaCO3 particles act as nucleation sites to accelerate the cement hydration process. The effect of two calcareous fillers, ground limestone and reagent grade CaCO3 on the compressive strength of OPC was studied and it was argued that the calcareous fillers acted as nucleation sites responsible for the acceleration effect on the early strength development [9]. The formation of C-S-H and/or Ca(OH)2 may be accelerated by the nano-sized particles of CaCO3. This could explain the lower efficacy of the micro-sized CaCO3 addition, as opposed to the nano-sized CaCO3 addition on the strength development. The micro-sized CaCO3 would be too large to function as effective nucleation sites.
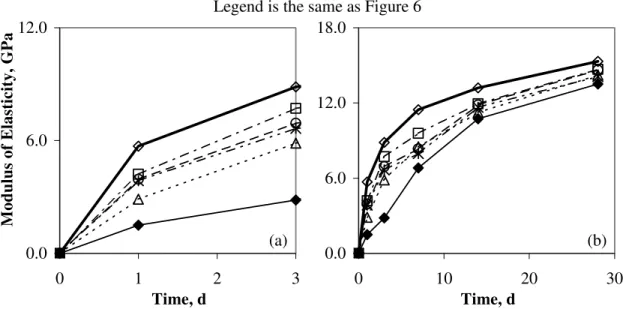
In addition to microhardness, the determinations of modulus of elasticity were performed to study the mechanical properties of the specimens. The modulus of elasticity is also an indicator of strength development in cement-based materials [8]. The modulus of elasticity has been improved by the additions of CaCO3, as shown in Figure 8 (a).
0.0 6.0 12.0
0 1 2 3
Time, d
Modulus of Elasticity, GPa
(a) 0.0 6.0 12.0 18.0 0 10 20 Time, d (b) Legend is the same as Figure 6
30
Figure 8: Modulus of elasticity values for OPC, OPC containing 50% GGBFS and OPC containing 50% GGBFS with the additions of micro- and nano-sized CaCO3 for the hydration
period up to (a) 3 days and (b) 28 days
The modulus of elasticity values at 3 days hydration for OPC and OPC containing 50% GGBFS are 8.9 GPa and 2.8 GPa, respectively. The value for OPC containing GGBFS with 20% nano-sized CaCO3 is however 7.7 GPa.
The accelerating effect of the nano-sized CaCO3 addition on the early hydration of OPC containing high volumes of GGBFS is effective as described above. The effect of accelerated reaction in the early hydration on the long-term hydration can also be observed in Figures 7 (b) and 8 (b). It is widely known that even if the early hydration is accelerated by the accelerating admixtures, the strength would be similar after long-term hydration, with or without the admixtures. This is not the case for the nano-sized CaCO3 additions. The mechanical properties in the early stages of hydration that were improved by the added CaCO3 continue to be improved up to 28 days hydration. The microhardness values at 28 days hydration for the control OPC and the OPC containing 50% GGBFS are 145.7 MPa and 28.7 MPa, respectively. The strength development of the OPC containing high volumes of SCMs is significantly lower than that of the control OPC. However, the additions of both micro- and nano- sized CaCO3 enhance the strength development. The microhardness value for the OPC containing GGBFS with the 20% nano-sized CaCO3 addition approaches closely that of the control OPC at 28 days hydration. The improvement of the modulus of elasticity is not as obvious as that of microhardness, however the positive effect of the nano-sized CaCO3 addition on the modulus of elasticity development can definitely be observed as shown in Figure 8 (b). These results suggest that the accelerated early hydration does not slow down but contributes to the strength development in the long-term hydration.
In addition to the determinations of microhardness and modulus of elasticity, the porosity determinations were performed by the helium pycnometer. The mechanical properties of the materials as a function of porosity in lieu of hydration in time were obtained. The logarithms of microhardness values versus porosity for OPC, OPC containing 50% GGBFS and OPC containing 50% GGBFS with the additions of micro and nano-sized CaCO3 are shown in Figure 9. The graph indicates the data distribution for the control OPC is much higher than that for the OPC containing high volumes of GGBFS. The specimens containing 10% and 20% and nano-sized CaCO3 additions are in the expected order as follows; 10% micro-sized CaCO3 < 20% micro- < 10% nano- and < 20% nano-sized CaCO3. The curve for the specimen containing 20% nano-sized CaCO3 intersects with the control OPC at a porosity of 41%. This indicates that the microhardness of the control OPC is lower than that of OPC containing GGBFS with the 20% nano-sized CaCO3 addition when the porosity is lower than 41%, and higher when the porosity is higher than 41%.
4. CONCLUSIONS
– The early hydration of OPC is significantly accelerated by the 10% and 20% additions of the nano-sized CaCO3. The greater the amount of CaCO3 addition, the greater is the accelerating effect.
– The added amounts of CaCO3 decrease as the hydration takes place, indicating some portion of CaCO3 interacts with the hydration products.
– The SEM analysis suggests that the hydrated OPC with the 20% nano-sized CaCO3 contains ettringite and carboaluminate phases.
Figure 9: The logarithms of microhardness values versus porosity for OPC, OPC containing
The significantly delayed hydration, observed by the conduction calorimetry, of OPC
– perties such as microhardness and modulus of elasticity are remarkably
– ized CaCO3 particles act as nucleation sites to
– of nano-sized CaCO3 are effective not only for the early hydration, but 10 100 1000 25.0 30.0 35.0 40.0 45.0 50.0 55.0 Porosity, % Microhardness, MPa OPC
OPC + GGBFS [50%] + Micro-sized CaCO3 [10%]
OPC + GGBFS [50%] + Nano-sized CaCO3 [20%]
OPC + GGBFS [50%] + Micro-sized CaCO3 [20%]
OPC + GGBFS [50%] + Nano-sized CaCO3 [10%]
OPC + GGBFS [50%]
50% GGBFS and OPC containing 50% GGBFS with the additions of micro- and nano-sized CaCO3
–
containing high volumes of GGBFS is compensated for by the addition of the nano-sized CaCO3.
Mechanical pro
improved in the early stages of hydration by the additions of CaCO3. The effect of nano-sized CaCO3 addition is very marked.
It is suggested that the added nano-s
accelerate the cement hydration process. This process results in the enhanced strength development.
The additions
also for the long-term hydration. The improvements of mechanical properties by the additions of the nano-sized CaCO3 were clearly indicated at 28 days hydration.
REFERENCES
oncrete Technology for Sustainable Development’, Concrete International, 21 [2] . and Zhang, C., ‘Influence of CaCO3 on Hydration and Microstructural
[3] tone on Cement
[4] Aluminate Carbonate
ry,
[5] s, L.D., ‘An Investigation of the Formation of Carboaluminates in
[6] e Chemistry of Cement and Concrete’, 3 Edn (Edward Arnold Ltd., London, [7] ose, A., ‘Electron Microscope Studies of Portland Cement Microstructures
310
[8] d Feldman, R.F., ‘A Study of Mechanical Properties of Autoclaved Calcium
[9] of Portland Cement’,
1] Mehta, P.K., ‘C [
(11) (1999) 47-53. Ramachandran, V.S
Characteristics of Tricalcium Silicate’, II Cemento, 3 (1986) 129-152. Péra, J., Husson, S. and Guilhot, B., ‘Influence of Finely Ground Limes Hydration’, Cement and Concrete Composites, 21 (2) (1999) 99-105. Carleson, E.T. and Berman, H.A., ‘Some Observations on the Calcium
Hydrates’, Journal of Research of the National Bureau of Standards – A. Physics and Chemist
64A (4) (1960) 333-341. Klemm, W.A., and Adam
Carbonate Additions to Cement’, ASTM STP 1064, American Society for Testing and Materials, (1990) 60-72.
Lea, F.M., ‘Th rd
England, 1970) Pratt, P.L. and Gh
During Setting and Hardening’, Philosophical Transactions of the Royal Society of London, A (1983) 93-103.
Beaudoin, J.J. an
Silicate Systems’, Cement and Concrete Research, 5 (2) (1975) 103-118. Soroka, I. and Stern N., ‘Calcareous Fillers and the Compressive Strength