HAL Id: hal-02172516
https://hal.archives-ouvertes.fr/hal-02172516
Submitted on 3 Jul 2019
HAL is a multi-disciplinary open access
archive for the deposit and dissemination of
sci-entific research documents, whether they are
pub-lished or not. The documents may come from
teaching and research institutions in France or
abroad, or from public or private research centers.
L’archive ouverte pluridisciplinaire HAL, est
destinée au dépôt et à la diffusion de documents
scientifiques de niveau recherche, publiés ou non,
émanant des établissements d’enseignement et de
recherche français ou étrangers, des laboratoires
publics ou privés.
Distributed under a Creative Commons Attribution - NonCommercial| 4.0 International
diversity
Francois Balfourier, Sophie Bouchet, Sandra Robert, Romain de Oliveira,
Hélène Rimbert, Jonathan Kitt, Frédéric Choulet, . International Wheat
Genome Sequencing Consortium, . Breedwheat Consortium, Etienne Paux
To cite this version:
Francois Balfourier, Sophie Bouchet, Sandra Robert, Romain de Oliveira, Hélène Rimbert, et al..
Worldwide phylogeography and history of wheat genetic diversity. Science Advances , American
As-sociation for the Advancement of Science (AAAS), 2019, 5 (5), pp.eaav0536. �10.1126/sciadv.aav0536�.
�hal-02172516�
G E N E T I C S
Worldwide phylogeography and history of wheat
genetic diversity
François Balfourier1*†, Sophie Bouchet1†, Sandra Robert1, Romain De Oliveira1, Hélène Rimbert1, Jonathan Kitt1, Frédéric Choulet1, International Wheat Genome Sequencing Consortium2‡, BreedWheat Consortium3‡, Etienne Paux1*
Since its domestication in the Fertile Crescent ~8000 to 10,000 years ago, wheat has undergone a complex history of spread, adaptation, and selection. To get better insights into the wheat phylogeography and genetic diversity, we describe allele distribution through time using a set of 4506 landraces and cultivars originating from 105 different countries genotyped with a high-density single-nucleotide polymorphism array. Although the genetic structure of landraces is collinear to ancient human migration roads, we observe a reshuffling through time, related to breeding programs, with the appearance of new alleles enriched with structural variations that may be the signature of introgressions from wild relatives after 1960.
INTRODUCTION
Bread wheat (Triticum aestivum L.) is an allohexaploid species originating from two successive rounds of hybridization. The second hybridization event is thought to have occurred in the Fertile Crescent during the Neolithic, ~8000 to 10,000 years ago (1, 2). Then, bread wheat germplasm has evolved along ancient human migration roads. It has been spread by the first farmers from this area both westward, to Europe, and eastward, to Asia, from 8500 to 2300 before the present (3). After their dissemination in Europe and Asia, domesticated wheat populations have adapted to local environments, becoming so-called landraces. From the 16th century, bread wheat was introduced in the New World, first in Latin America and then in Northern America and Australia (3). During the past two centuries, breeding programs were organized in Europe and Asia to improve these landraces. Last, after the Second World War, the introduction of dwarf genes in crops during the Green Revolution, particularly in wheat, contributed to marked modifications in the gene pool over the world (4). Today, with more than 220 million hectares and almost 750 metric megatons produced every year, wheat is one of the most cultivated and consumed crops worldwide, providing 15% of calories consumed every day. Since the transition from hunting- gathering to agriculture, bread wheat has been essential to the rise of civilizations. It has repeatedly been shaped by selection to meet human needs and adaptation to different environments. Here, we report on a worldwide phylogeographical study aiming at understand-ing this complex history of wheat dissemination and differentiation.
RESULTS AND DISCUSSION
Defining haplotypic blocks in the wheat genome
Since previous studies highlighted the importance of both geograph-ical and temporal effects in structuring wheat diversity (5), a set of 4506 wheat accessions was sampled that represented the worldwide
diversity (data file S1). These accessions were categorized in sets that were relevant in terms of agricultural practices: landraces corresponding to the original pool of worldwide diversity, traditional cultivars registered before the Green Revolution and the global introduction of dwarf genes (1960), and modern varieties registered after 1960. Following genotyping on a high-density single-nucleotide polymorphism (SNP) array containing 280,226 SNPs (6), a set of 113,457 high-quality SNPs showing less than 2% missing data was selected (data file S2). This dataset comprised 99,333 polymorphic high-resolution (PHR) biallelic SNPs and 14,124 off-target variants (OTVs), i.e., markers that detect both nucleotide polymorphisms and presence-absence variations. The genomic position of these SNPs was determined using the International Wheat Genome Sequencing Consortium (IWGSC) RefSeq v1.0 (7). The distribution of markers on the homoeologous genomes was consistent with previous studies (40% on the A-genome, 48% on the B-genome, and 12% on the D-genome) (8, 9).
However, as chip-designed markers can lead to ascertainment bias due to the marker type and selection (10), we inferred haplotype blocks and corresponding alleles along the genome (Fig. 1 and data file S3). We parsed the bread wheat genome in 8741 sizable regions over which there was little evidence for historical recombination and within which only a few common haplotypes were observed (data file S3). Mean similarities between accessions were 0.69 (SD = 0.07), 0.70 (SD = 0.05), and 0.49 (SD = 0.07) using 113,457 SNPs, 58,602 pruned SNPs, or 8741 haplotypes, respectively. Simi-larities calculated with haplotypes were much lower on average. The difference between similarities calculated with haplotypes or SNPs was low for individuals that were very similar, intermediate when individuals were very different, and high when individuals were moderately different. The smaller similarities using haplotypes may be due to the higher number of alleles, particularly rare ones. It may allow us to reveal recent differentiations that are not tractable with SNPs. The number of haplotype blocks was highly correlated with the overall number of SNPs per chromosome (Pearson correlation coefficient R = 0.79, P = 2 × 10⁻⁵). The average number of haplo-types per block was 4, ranging from 2 to 20. The median size of haplotype blocks was 105 kb, with 85% of the blocks being shorter than 1 Mb. The mean size was 863 ± 4595 kb. This huge SD reflects the structural partitioning of wheat chromosomes. The size was 1GDEC, INRA, Université Clermont Auvergne, 5 chemin de Beaulieu, 63000 Clermont-
Ferrand, France. 2IWGSC, 2841 NE Marywood Ct, Lee’s Summit, MO 64086, USA. 3BreedWheat, 5 chemin de Beaulieu, 63000 Clermont-Ferrand, France.
*Corresponding author. Email: francois.balfourier@inra.fr (F.B.); etienne.paux@ inra.fr (E.P.)
†These authors contributed equally to this work.
‡List of members can be found in the Supplementary Materials.
Copyright © 2019 The Authors, some rights reserved; exclusive licensee American Association for the Advancement of Science. No claim to original U.S. Government Works. Distributed under a Creative Commons Attribution NonCommercial License 4.0 (CC BY-NC). on July 3, 2019 http://advances.sciencemag.org/ Downloaded from
found to be different according to the five chromosomal regions defined by the IWGSC, as expected from the overall recombination pattern observed in wheat (7). In telomeric highly recombinogenic R1 and R3 regions, the mean size was 226 ± 47 and 338 ± 86 kb, respectively, 2239 ± 87 kb for the R2a/b regions, and 15,117 ± 3387 kb for the C region (Fig. 1).
Population structure in landraces
We estimated the main bread wheat genetic groups using the 632 landraces that are supposed to correspond to the first wave of wheat dissemination. According to STRUCTURE outputs obtained for a number of groups ranging from 2 to 12, K = 6 to K = 9 show the more stable assignments. We chose to describe the panel using eight groups as it discriminates the Iberian Peninsula (IBP) from Mediterranean lines and Caucasian lines from the Western Asia, which sounded bio-logically and historically relevant to notice (fig. S1). At K = 2, wheat landraces were separated according to their European versus Asian origins. At K = 3, the Asian cluster was divided in two clusters: Southeast Asia (SEA) and Central Asia and Africa (CAA). At K = 4, European landraces split in the Northwest Europe (NWE) and the Southeast Europe (SEE) clusters. At K = 5, the Mediterranean Basin (MED) cluster was separated from the NWE cluster. At K = 6, the Indian Peninsula (INP) cluster was derived from the CAA cluster. At K = 7, the IBP cluster was separated from the MED cluster. At
K = 8, the Caucasus (CAU) cluster split from the CAA cluster. The
geographical origin of landraces from these eight subpopulations is given in data file S1, and the composition of the eight subpopulations is given in table S1. CAA landraces, mostly spring type, were mainly from Asia, as well as Northern and Western Africa. CAU landraces were from the region located between the Black Sea and the Caspian Sea. Most INP landraces were from India, Pakistan, and Nepal and were exclusively spring type. Almost all SEA landraces were from China and Japan. NWE landraces, mostly winter type, came from
France, Germany, and UK, as well as, to a lesser extent, from Spain. MED landraces came from regions surrounding the Mediterranean Sea and were mostly spring type. Last, SEE landraces were spread throughout Eastern Europe, Western Europe, Western Asia, and Scandinavia.
MED, NWE, and SEE were the most admixed (mean assignment rate, 0.66, 0.68, and 0.71, respectively), and the most diverse groups [Nei diversity index (He) = 0.47, 0.45, and 0.44, respectively]. They also presented the highest number of rare alleles and singletons (table S1). INP, CAU, SEA, and IBP were the least admixed (mean assignment rate = 0.77, 0.80, 0.88, and 0.89, respectively) and the least diverse groups (He = 0.35, 0.40, 0.34, and 0.30, respectively). SEA and IBP were the most differentiated groups (FST = 0.32 and
0.36, respectively, compared to 0.2 on average for the other groups; Table 1). SEE, NWE, and MED were not highly differentiated from each other (pairwise FST = 0.10 on average). The global
differentia-tion index (FST) between the eight groups was 0.4.
Chronology of differentiation between genetic groups
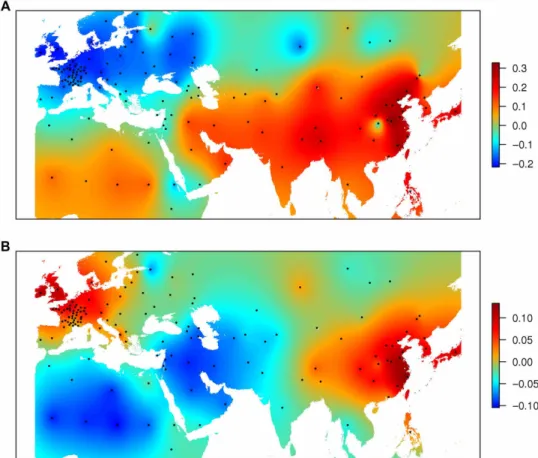
The principal coordinate analysis (PCoA) revealed a continuum of differentiation between genetic groups, consistent with the high admixture rate (fig. S2). Geographical projections of the first and second axes of the PCoA (Fig. 2) showed that there are two poles of differentiation, one in Europe and one in Asia. They both converge around the Mediterranean region, which is consistent with literature that places the domestication of wheat in the Fertile Crescent.
The relationship between genetic and geographical distances from the Fertile Crescent supports the fact that there were two poles of differentiation originating from one common center: the Fertile Crescent (fig. S3). They also show that although isolation by distance is the main driver of differentiation in Asian landraces, it is just one of the factors for European material, where migrations/exchanges obviously occurred before modern breeding. For instance, we observed MED and SEE materials in Western Europe (France), SEE material in Great Britain, or SEE material in China.
To confirm hypotheses about wheat dissemination along human migration roads, we searched for signatures of demography events (preferential gene flow and population expansion) through the analysis of the geographical distribution of rare alleles (frequency < 0.05 or 0.01) and singletons. We observed that Asian and European pools
Fig. 1. Size difference of haplotypic blocks along wheat chromosomes. (A) Boxplot of sizes in the R1, R2a, C, R2b, and R3 regions of wheat chromosomes. (B) Distribution of haplotypic blocks along chromosome 2B. The block color corresponds to its size.
Table 1. Pairwise comparisons of the eight subpopulations of landraces. Number of rare alleles (frequency < 0.05) specific to one genetic group in the diagonal (in blue). Pairwise differentiation index (FST)
above the diagonal. Number of rare alleles shared between populations below the diagonal.
NWE SEE IBP MED CAU CAA SEA INP
NWE 247 0.1 0.31 0.1 0.22 0.25 0.37 0.32 SEE 138 397 0.31 0.09 0.16 0.2 0.33 0.28 IBP 30 39 181 0.26 0.37 0.36 0.47 0.45 MED 113 169 115 359 0.14 0.17 0.32 0.27 CAU 26 103 22 73 126 0.13 0.3 0.25 CAA 22 41 24 77 55 104 0.21 0.17 SEA 23 52 45 64 88 129 357 0.25 INP 6 35 14 24 22 56 136 116 on July 3, 2019 http://advances.sciencemag.org/ Downloaded from
of rare alleles were distinct, with few overlap (Table 1). This suggests that these are not the same pools of rare alleles that have been trans-mitted to European and Asian germplasm from the center of wheat domestication. Both in Asia and Europe, rare alleles that were not specific were shared with MED in general, or CAA or CAU. When analyzing rare alleles in Europe and Asia separately, MED showed the highest number of specific alleles (tables S3 and S4). Both the fact that MED had the highest number of shared alleles with Asia or Europe and the fact that it had more specific alleles converged to the conclusion that MED expansion was anterior to any other group expansion. According to table S2, SEE is the group that shares the highest number of rare alleles with MED. Ancient SEE populations were probably derived from MED a long time ago according to the high number of specific rare alleles. NWE differentiation seems to have followed that of SEE with substantial gene flow. According to table S3, SEA expanded as well a long time ago but more recently than SEE and/or with a smaller rate of expansion and with CAA preferential gene flow. INP had more recent preferential gene flow with SEA and IBP with MED. CAA, CAU, and MED seem to have experienced regular and reciprocal gene flow according to the low
FST values and the high number of rare shared alleles. The higher
rate of rare alleles and singletons in Europe compared to Asia suggests a more ancient and/or a much higher expansion rate in Europe (fig. S4). In Eastern Europe, the high frequency of very rare alleles (frequency < 0.01) and singletons that are supposed to be more recent mutations points toward an expansion of wheat culti-vation that may have been not only more important in this region than in the MED but also more recent.
To conclude, wheat expansion probably started in the Mediter-ranean region. Bread wheat then differentiated in new environ-ments along two main human migration routes, from the Fertile Crescent toward Europe [northward along the Danubian route (SEE) and westward (NWE)] and Asia along the Silk Road (4). Expansion of wheat populations was particularly important in Eastern Europe.
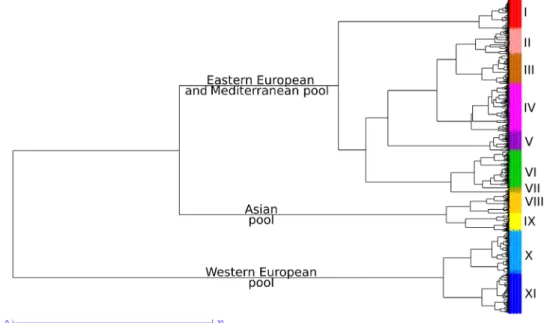
Worldwide wheat phylogeography
We selected a set of 4403 accessions including landraces, traditional cultivars, and modern varieties with less than 5% missing haplotypes to analyze the worldwide diversity. The phylogenetic tree revealed three large pools (Fig. 3). The Eastern European and Mediterranean gene pool gathered 94% of the SEE, MED, and IBP landraces, to-gether with 83% of all traditional and modern varieties not originat-ing from Northern and Western Europe. This is consistent with the successive introductions, first by the Spanish and Portuguese in South America, then by European in the United States, Canada, and Australia, and by the International Maize and Wheat Improvement Center (CIMMYT) and International Center for Agricultural Re-search in the Dry Areas (ICARDA) breeding programs worldwide. Although 94% of Asian landraces (SEA, INP, CAA, and CAU) were grouped in the Asian pool, only 7% of the traditional and modern varieties were, while 71% of Asian modern varieties were found within the Eastern European and Mediterranean pool. This shows that Asian breeding programs have mainly relied on European germplasm and more particularly on the Italian one (11). The high differentiation index between modern lines and Asian landraces
Fig. 2. Geographical projection of the PCoA axes for 632 landraces. (A) PCoA1. (B) PCoA2.
on July 3, 2019
http://advances.sciencemag.org/
(SEA and INP; mean FST = 0.35) supports the fact that the original
Asian diversity pool did not contribute much to modern varieties. The PCoA on 4403 wheat accessions supports this finding, as Asian material is almost absent from modern varieties (fig. S5). Last, the Western European gene pool contains most of NWE landraces (62 of 63), as well as 76% of the Northern and Western Europe tradi-tional and modern varieties. This demonstrates that Northern and Western Europe breeding programs have mainly used local landraces. At a finer scale, the phylogenetic analysis defined 11 groups within the worldwide diversity (Fig. 3, data file S1, and table S4). The proportions of those 11 groups in each country or state are shown in figs. S6 to S14. Group I was composed of Ukrainian, Hungarian, Russian, Yugoslavian, and Romanian modern winter-type lines. Group II was composed of French, Canadian, German, North American, and Swedish, accessions that are mostly spring type. Group III was composed of North American, Russian, Hungarian, Ukrainian, and Romanian, mostly winter-type accessions. Group IV was composed of the New World (America and Australia), French, and Spanish accessions. Group V was composed of Chinese, Italian, Yugoslavian, and Hungarian modern lines. Group VI was composed of CIMMYT, New World, and Chinese modern spring-type lines. Group VII was composed of Canadian, Chinese, and American modern exclusively spring-type lines. Group VIII was composed of Asian, mostly spring accessions, including most INP, CAA, and CAU landraces. Group IX was composed of Chinese and Japanese accessions, including most SEA landraces. Group X was composed of French and British modern winter-type lines. Group XI was composed of French and German modern winter- type lines.
All nonadmixed (mean assignment rate > 0.6) CAA, INP, and most CAU landraces were found in group VIII and most of the non-admixed SEA landraces (98%) in group IX. Nonnon-admixed NWE landraces were distributed in groups XI (56%) and X (24%), and to a lesser extent, V and IV. All nonadmixed MED and IBP landraces were in group IV. Nonadmixed SEE landraces clustered in groups
III, II, and IV. Note that no nonadmixed landraces were found in groups VI and VII and only eight in group I.
The most differentiated group was VII (FST > 0.3 with all other
groups). VII modern varieties were even more differentiated than VII traditional cultivars (mean FST = 0.39). IX traditional cultivars
were highly differentiated to all groups except group VIII (FST = 0.11). Note that IX modern varieties were less differentiated
than IX traditional cultivars. They were probably admixed between different ancestral groups. This suggests that IX traditional cultivars did not participate in any elite lines except IX elites. VIII traditional and VIII elites were very close to each other (FST = 0.02). VIII
tradi-tional was less differentiated to worldwide elite germplasm than IX traditional. They probably slightly contributed to modern elite germplasm, although IX traditional did not.
We mainly found accessions from European countries within groups I to III, X, and XI (fig. S6). Northwestern European acces-sions were clustered in groups X and XI, while accesacces-sions from Eastern European countries were mainly found in groups I and III. This strong structure between Northwestern and Southeastern European wheat gene pools may be related to the historical roads used by the first farmers during the spread of agriculture. In particular, the Danubian road can be a hypothesis to explain this geographical separation between groups X and XI on the one hand and groups I and III on the other hand. The split of Western Europe accessions between group X (France, UK, Belgium, etc.) and group XI (Germany, the Netherlands, Poland, Denmark, etc.) may be related to old selec-tion footprints under specific climatic condiselec-tions such as oceanic/ continental climates. Last, some accessions clustering in group II (pink) can be found in the northern part of Europe (Scandinavia). This group contained mainly spring-type accessions well adapted to specific day length and vernalization requirements in Northern European countries (Norway, Sweden, Finland, and Ireland).
The material from the MED differed from the European mate-rial (fig. S7). We observed four major groups (IV, V, VI, and VIII). Group I was also represented but only in the Balkans area (former
Fig. 3. Ward dendrogram showing phylogenetic relationships between 4403 wheat accessions revealed by 8741 haplotypes. The different colors correspond to the 11 groups.
on July 3, 2019
http://advances.sciencemag.org/
Yugoslavia, Macedonia, and Bulgaria). The level of diversity and ad-mixture was high in this region at the cross of different migration roads. The Mediterranean road from Turkey, Greece across Italy, France, and Spain was likely related to group IV, while the North African road might have given raise to groups VI and VIII. Last, we can notice a small group V with few accessions, highly specific from the Adri-atic sea (Italy, Croatia, Former Yugoslavia, Albania, Greece...) that might reflect high selection pressures under very specific environ-mental conditions such as drought resistance.
The large Middle East and Central Asia geographical area corresponds to the Cradle of Wheat (the center of wheat diversification) and the starting point of the main historical migration roads. We observed accessions from groups I, III, IV, VI, and VIII (fig. S8). Groups I and III seem to be originating from the region of the Caspian Sea, with CAU (Armenia, Georgia, Azerbaijan, and the Russian Fed-eration) on the West and former Persia (Kazakhstan, Turkmenistan, Uzbekistan, and Tajikistan) on the East. Note that group I was also well represented on the other side of the Black Sea, as previously observed in fig. S6. Accessions from group VIII mainly corresponded to landraces from the CAA and CAU populations. Last, most of the accessions belonging to groups IV and VI, previously observed in fig. S7, were from Turkey, Iraq, Iran, Israel, Lebanon, and Jordan, which is the former Fertile Crescent Area.
Southeast Asian diversity was largely dominated by five main groups (fig. S9). Group VIII was the most prevalent one in the INP (Pakistan, India, Nepal, and Bhutan), as well as in Myanmar, Philippines, and Indonesia, and comprised mainly landraces from the INP pop-ulation. In contrast, China, Japan, and Korea presented a high propor-tion of accessions from group IX that corresponded to SEA landra-ces, while one-third of recent Chinese cultivars clustered in group V. The distribution of accessions between groups VI, VIII, and IX (the first two also being observed at high frequency in the Middle East and Central Asia) varied along the Southern extremity of the Silk Road used by first farmers from the Fertile Crescent through Central Asia, Afghanistan, and Xinjiang (Northwest China). The importance of group V in Chinese modern cultivars and in Italy (fig. S7) can be explained by intensive uses of Italian germplasm in Chinese breeding programs during the second part of 20th century (12, 13). Several famous Italian accessions, such as Mentana, Mara, Funo, Libellula, or Virgilio that were developed by the Italian wheat breeder Strampelli and used as parents to create a large number of Chinese cultivars during the 1960s and the 1970s, belong to group V. Last, group III observed in CAU was also found in Mongolia, Republic of Korea, Japan, China, and Russian Federation. The occur-rence of this group supports the hypothesis of a secondary northern way of introduction from Eurasia to Southern Siberia and Mongolia, along the Eurasian Steppe road (14, 15). In China, we observed a quite good correlation between the four main wheat-growing zones and the different groups (fig. S10). Autumn-planted spring wheat region was related to group IV, while group IX was much more con-nected to winter habit and facultative wheat regions. Similarly, group VIII was mainly observed in spring-planted spring wheat and autumn- planted winter wheat area (western part of China), while group VI was specific to spring-planted spring wheat region. These results reflect the effects of environmental selection pressures on haplotypic diversity and are consistent with those described by Zhou and collaborators (16).
Despite the fact that not all African countries were represented in our panel, the African continent was largely dominated by the
three main groups observed in the MED (IV and VI) and Middle East (VIII) (fig. S11). This diversity may have been shaped along ancient human migration roads from the Fertile Crescent (along the Nile, Tigris, and Euphrates rivers, from the Red Sea to the Persian Gulf: Iraq, Syria, Lebanon, Cyprus, Jordan, Israel, Palestine, Egypt, the southeastern fringe of Turkey, and the western fringes of Iran) to Northern Africa (Egypt, Tunisia, Algeria, and Morocco; groups IV and VIII). Group VI contains mainly modern lines and is likely to correspond to recent introductions of ICARDA and CIMMYT wheat breeding materials to Eastern (Ethiopia and Kenya) and Southern (Zimbabwe and South Africa) parts of the continent.
Structure of wheat gene pool diversity in the American continent is shown in fig. S12. At the whole continent level, we clustered accessions in five main groups. Group IV mainly observed in the Eastern Coasts of both North and South America (United States, Venezuela, Brazil, Uruguay, and Argentina) is likely related to the first introduction of wheat landraces by Spaniards from the IBP to the Eastern American Coast during the 16th century. The pres-ence of group III can be explained by the introduction of wheat accessions related to Eastern European lines and more adapted to con-tinental climate. For instance, the Turkey Red Wheat was brought to Kansas by the Mennonites in the late 1800s (17, 18). The intro-duction of spring wheat from Scandinavia and northern part of Europe to Canada can explain the importance of group II in this country. Group VI differentiation reflects the remarkable breeding program developed at CIMMYT in Mexico since 1940 (4). This international organism, together with ICARDA in Alep (Syria), produced and spread new cultivars in developing countries. They played a key role during the Green Revolution and the generalization of semidwarf high-yielding varieties. Our results indicate that CIMMYT and ICARDA mostly used Mediterranean accessions (groups IV and VI) and, to a lower extent, Middle East accessions of group VIII to create then release new lines all over the world particularly to America, Oceania, and Africa. The very small group VII mostly observed in Canada and some northern states of the United States could be derived from recent Canadian breeding program using CIMMYT material. The geographical structuration of the U.S. varieties is mostly related to the four main wheat types grown in this country, namely, Soft White, Soft Red Winter, Hard Red Winter, and Hard Red Spring wheats (fig. S13) (4). The Eastern group IV overlaps the U.S. soft winter wheat pool. We also observed high frequencies of this group IV in Washington, Oregon, and Idaho, where the soft white wheats are produced. By contrast, we observed the highest frequencies for group III in central and western states where the hard winter wheats are grown. Groups I and VII, which are dominant in Canada, showed the highest frequencies at the Canadian border. These two groups can be related to the U.S. Hard Red Spring wheat pool. Last, accessions gathered in group VI, which can be observed in western part of the United States, are generally more recent cultivars derived from CIMMYT lines. This structuration is also coherent with historical information. The first introductions of wheat in the United States probably occurred on the Eastern Coast at the beginning of the 17th century. A more important introduction of Mediterranean material occurred during the 19th century with accessions such as Mediterranean Purple Straw or Red May. At the end of the 19th century, they were used as progenitors of better- adapted lines such as Goldcoin, Harvest Queen, Thorne, Chancellor, Atlas, Knock, Benhur, Arthur, or Caldwell. All these accessions belong to group IV. During the progressive settlement in western states of
on July 3, 2019
http://advances.sciencemag.org/
the country in the second part of the 19th century, new accessions from the Eastern European pool, such as Turkey Red or Crimean from Ukraine, were introduced to create more adapted cultivars such as Kharkov, Malakof, and varieties with higher yield potential such as Cheyenne, Nebred, Comanches, Wichita, Triumph, Centurk, Newton, or Tam. All these accessions belong to group III. Soft winter wheats from Europe appeared not adapted under northern states condi-tions. Thus, during the 19th century, settlers used spring types pre-viously introduced from Scandinavia to Canada, such as Red Fife, Preston, or Marquis to develop new cultivars as for instance Lee or Ceres, which all clustered in group II. Later, in the second part of the 1900s, introgressions of CIMMYT material in modern breed-ing programs produced more productive sprbreed-ing cultivars such as Justin, Chris, Era, Olaf, or Len, all belonging to group VI. Some spring-type European accessions from group III were at the origin of famous soft white wheat in Pacific Northwest region (Washington, Oregon, and Idaho), such as Little Club introduced from California, Baart, or Defiance. After the Second World War, introduction of CIMMYT wheat lines in plant breeding programs may also explain the importance of group VI in this Western part of the United States.
Wheat accessions from Oceania were clustered in four main groups: groups II and X from Europe and groups IV and VI from the Medi-terranean area and widely used by CIMMYT in recent breeding programs (fig. S14). This clustering is consistent with the evolution of Australian wheat as described by Joukhadar and collaborators (19). Wheat was first introduced in Oceania by the First Fleet in 1788. During the 1800s, growers used some famous lines from Europe and the MED, such as Fife (group II) or Purple Straw (group IV), and then from Africa, such as Gluyas (group IV). These lines were intensively used by breeders in the first half of the 20th cen-tury to develop the first commercial Australian varieties such as Federation, Bencubbin, Insignia, Olympic, Halbered, or Spears, which are all clustered in group IV. Since 1970, Australian wheat breeding has heavily relied on CIMMYT material to develop new famous cultivars such as Gabo, Gamenya, Condor, Egret, and Janz, which are all clustered in group VI. Therefore, groups IV and VI can be re-lated to the main periods defined by Joukhadar et al. (19): group IV from the second period (1921 to 1970) and group VI from the third period (1971 onward). It seems that these groups also define the two main Australian wheat classes, namely, white wheat (group IV) and hard wheat (group VI).
Temporal evolution of the worldwide genetic diversity
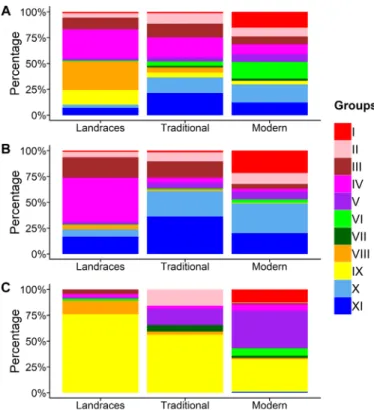
Note the shift in the genetic origin of wheat gene pool through time. The proportion of the 11 groups appeared to be different according to the status of accessions: landraces, traditional cultivars, and modern varieties (Fig. 4 and fig. S15). While groups IV, VIII, and IX were dominant in landraces (28, 28, and 14%, respectively), their proportion decreased in traditional and modern lines, group VIII being almost absent for the latter. Concomitantly, groups I, VI, X, and XI that were minority groups in landraces became dominant in modern varieties (15, 16, 17, and 12%, respectively). This can be explained by important breeding programs in Eastern Europe (group I), Western Europe (groups X and XI), as well as CIMMYT and ICARDA (group VI) that have spread their varieties around the world after the 1960s.
In Eastern Europe, landraces and traditional accessions that cluster mainly with group III were replaced by modern lines that mainly cluster with group I. In Southern and Western Europe,
group IV was dominant in landraces but was replaced in traditional cultivars and modern varieties by group V in Southern Europe and groups X and XI in Western Europe. In Northern Europe, we observed a gradual shift from groups XI and III in landraces to groups XI and II in traditional, to a dominant group X (55%) in modern lines. In Eastern Asia, while landraces, traditional, and modern accessions mainly cluster with group IX, we observed an increased proportion of the other groups, especially group IV, absent in landraces and present in traditional and modern lines. In Central Asia, group VIII that was dominant in landraces decreased in traditional to disappear almost completely from modern acces-sions. Concomitantly, we observed an increase in group III in tradi-tional and group I in modern lines. In Southern Asia, the landrace- and traditional-dominant group VIII was replaced by group VI in modern varieties. In Western Asia, although landraces mainly clustered with groups VIII and IV, modern lines mainly cluster with group VI. In Central-Eastern China (winter habit and facultative wheat), although group IX was the main group in landraces, traditional, and modern accessions, we observed an increase in group I in the most recent varieties. In Southeast China (autumn-planted spring wheat), group V gradually replaced the landrace-dominant group IX in traditional and modern lines. Our panel contained only landraces from Western China (spring-planted spring and autumn-planted winter wheat). In Northeastern and Central China (spring-planted spring wheat), we observed a complete change in the main groups, moving from III and IX in landraces to V and VI in modern varieties. In Africa, although landraces mainly cluster with groups IV and VIII, modern lines mainly cluster with group VI. In the New World, no accessions were considered as landraces. We thus only compared traditional
Fig. 4. Proportion of the 11 groups among the landraces, traditional cultivars and modern varieties from different regions of the world. (A) World, (B) Europe, and (C) China. The different colors correspond to the 11 groups.
on July 3, 2019
http://advances.sciencemag.org/
cultivars and modern varieties, when possible. In Canada, tradi-tional cultivars mainly clustered with group II, while groups VII and VI were dominant in modern varieties. In Northern United States (Hard Red Spring wheat), we observed an increase in group VI. We found a similar trend with group III in midwestern states (Hard Red Winter wheat). No notable change was observed in south-ern and eastsouth-ern (Soft Red Winter wheat) and northwestsouth-ern states (Soft white wheat), the groups III and IV dominating the former and group IV being the main group in the latter. In Central America and on the Western Coast of South America, the absence of traditional cultivars in our panel did not allow the comparison. However, on the Eastern Coast of South America, while traditional and modern lines mainly cluster with group IV, we observed a noticeable increase in the proportion of group VI. In New Zealand and Western Australia, the panel did not contain traditional cultivars. In Eastern Australia, group IV present in traditional disappeared almost completely from modern and was replaced by group VI. We observed a similar trend in Southern Australia where group VI that was absent in traditional appeared in modern varieties.
Structural variations and wheat breeding
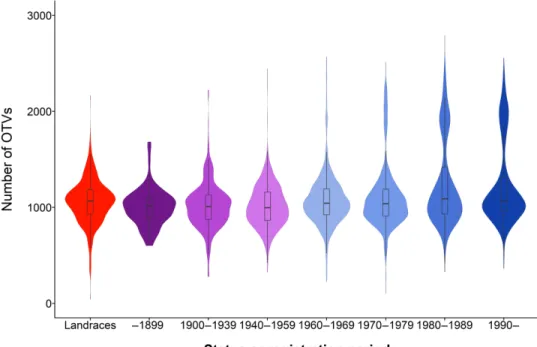
We observed that the composition in structural variations (SVs) evolved through time. When considering the 14,124 OTV markers, i.e., markers that reveal null alleles and can therefore be used to detect presence/absence variations (20), the number of null alleles appeared to be quite similar to landraces and traditional cultivars (~1000 OTVs per line). By contrast, we observed a second group of lines with more than 1700 OTVs, especially in modern varieties registered after 1970 (Fig. 5). The SVs may be due to the use of wild relatives in crop improvement that traces back to the early 1940s and gained prominence during the 1970s and 1980s (21). A detailed analysis of the OTV distribution revealed more than 80 SV blocks greater than 5 Mb with a cumulative length greater than 4600 Mb, i.e., almost
one-third of the entire bread wheat genome (table S5). These large blocks likely correspond to alien introgressions, for example, the rye (Secale cereale) 1RS on chromosome 1B or the Aegilops ventricosa 2NS translocation on chromosome 2A (22, 23). However, while these large blocks can be easily detected, smaller alien segments, referred to “cryptic introgressions,” are more difficult to identify (24). Therefore, it is likely that the total amount of alien DNA present in the current wheat germplasm is by far greater than that. To date, alleles have been introgressed from more than 50 species from 13 genera (25), highlighting not only the importance of these so-called alien introgressions for wheat breeding but also the com-plex genomic patterns that might have arisen.
It has been shown that SNP natural genetic diversity in the improved material is significantly lower than the one observed in landraces as a result of domestication and selection (26). However, in our analysis, the level of diversity calculated with haplotypes through time was similar to landraces, traditional accessions, and modern lines (0.52, 0.50, and 0.51, respectively), globally in the col-lection and in most groups. While 9% of alleles were lost in modern varieties compared to landraces, 8% of new alleles were observed in modern lines. Nineteen percent of these alleles that were specific to modern material contained OTVs, whereas only 7% of landrace- specific ones did. This suggests that breeding programs have brought some new alleles enriched in SVs related to alien introgressions, leading to an overall genetic diversity that is similar between landraces and modern varieties.
CONCLUSION
Together, these results brought new insights into the worldwide wheat genetic diversity diffusion and evolution. Recent selection and spread led to a modern germplasm that is highly unbalanced compared to the ancestral one found in landraces. Most of worldwide
Fig. 5. Frequency of occurrence of OTVs in wheat accessions according to the status or registration period. Landraces in red, traditional lines (before 1960) in purple, and modern varieties (from 1960 onward) in blue.
on July 3, 2019
http://advances.sciencemag.org/
modern cultivars are related to the SEE, IBP, and MED landraces, whereas NWE landraces contributed only to Western Europe modern germplasm and Asian landraces (SEA, CAA, INP, and CAU) have been scarcely used in modern wheat breeding programs. In addition, the introduction of wild relatives in crop improvement has resulted in a significant amount of alien DNA within the genome of wheat varieties.
From a breeder’s perspective, the Asian germplasm represents a significant fraction of the worldwide diversity that remains largely unexploited. Nevertheless, as exemplified by the Rht dwarfing genes (27), as well as by disease resistance genes, such as Fhb1 (28), these accessions are a valuable reservoir of novel alleles and genes. It is thus strategic to better characterize these genetic resources to exploit them efficiently into prebreeding programs and fully benefit from their natural resistance to biotic and abiotic stresses.
It is now widely admitted that, because of intraspecific SVs, a single individual genome is not sufficient to accurately describe the whole species (29). While some genes are shared between all indi-viduals (the core genome), some others may be absent from one or more of them (the dispensable genome), the sum of all of the genes defining the pangenome (30, 31). First attempts to get access to the wheat pangenome have already been made (32). However, in the absence of a preliminary detailed phylogeographical study, the se-lected lines might not be representative of the worldwide diversity. We think that nonadmixed landraces from each genetic groups described above can be considered as founder lines and would be the ideal candidates to characterize the wheat pangenome. After the completion of a high-quality reference sequence of the hexaploid wheat genome, this is the next challenge for the IWGSC.
MATERIALS AND METHODS Wheat accessions
The 4506 lines were chosen within a set of about 12,000 accessions constituting the Institut National de la Recherche Agronomique (INRA) bread wheat collection conserved at the INRA Biological Resources Center for small grain cereal. These lines were chosen according to previous results indicating strong genetic structure at both geographical and temporal levels in wheat gene pools (5). To reflect this expected genetic organization, passport data were used to select the accessions on three main criteria: their geographical origin, their status (landraces, traditional, or modern cultivars), and their registration period (for cultivars). Accessions were, as far as possible, sampled in a maximum number of different geographical unit (i.e., country and then subcountry such as regions, provinces, or states); in the same manner, within a same geographical unit, acces-sions were sampled according to their status and registration period to reflect potential breeding effects on genetic diversity; last, suffi-cient balanced sample size within geographical unit and registration period was chosen to allow further comparisons at both genotypic and phenotypic levels. Passport data per accessions are given in data file S1. The worldwide diversity panel included 4506 accessions originating from 105 different countries: 2185 accessions from 33 different European countries, 143 from 28 different regions of the Russian Federation, 534 from 29 U.S. states and 5 Canadian prov-inces, 946 from Asia, including 384 from 24 Chinese provprov-inces, 316 from 14 South American countries, 207 from 20 African countries, and 169 from Oceania. Pedigrees were known for 90% of the accessions. There were 59% of winter, 38% of spring, and 3% of
facultative types. Fourteen percent of these accessions (632) were landraces, 21% (965) corresponded to traditional cultivars (reg-istered before 1960), and 51% were modern varieties (reg(reg-istered after 1960; data file S1). To have a better understanding of the evo-lution of allelic diversity through time, we separated accessions in sets that were relevant in terms of agricultural practices: landraces corresponding to the original pool of worldwide diversity, traditional cultivars registered before the Green Revolution and the global in-troduction of dwarf genes (1960), and modern varieties registered after 1960.
Genotyping
The 4506 accessions were genotyped using a high-density Affymetrix Axiom SNP array containing 280,226 genic and intergenic SNPs (6). Genotyping was conducted on the Affymetrix GeneTitan system according to the procedure described by Affymetrix (Axiom 2.0 Assay Manual Workflow User Guide Rev3). Allele calling was carried out using a modified version of the Affymetrix proprietary software packages Affymetrix Power Tools and SNPolisher (www.affymetrix. com/estore/partners_programs/programs/developer/tools/ devnettools.affx) to take into account the specificities of the wheat genome. For all SNPs, HomRO, and HomFLD were calculated (http://media.affymetrix.com/support/developer/downloads/ Tools/SNPolisher_User_Guide.pdf). The HomFLD filter was set to 3.6. As a first step, all the probesets were processed with a mild inbred penalty equal to four on all samples. As a second step, the SNPs failing the quality check criteria (“Other” and “NoMinorHom”) were reprocessed using an inbred penalty of 16. Probesets classified as OTVs by SNPolisher were analyzed with OTV_caller in two steps. SNPs were classified in six main categories according to cluster patterns produced by the Affymetrix software: PHR, OTV, mono-morphic high resolution, no minor homozygous, call rate below threshold, and others. For further analyses, only PHRs and OTVs were selected.
Haplotyping
Missing data were estimated using the Beagle software. Lines with more than 5% missing data were discarded from this analysis. Hap-lotypic blocks and specific haplotypes contained in these blocks were defined in 4403 lines using Haploview algorithm (33) imple-mented in PLINK software (34). In each haplotypic block, 95% of pairwise measures of marker LD (D′) were superior to 0.98.
Genetic structuration
To define a relevant number of genetic groups in 632 worldwide bread wheat landraces and to assign lines to genetic groups, we used haplotypes defined above and the algorithm implemented in STRUCTURE software (35). We assumed a single domestication event and restricted our analysis to the correlated frequency model (36). We set other parameters at their default values using the admixture model and infer ALPHA option. We used a 10,000 burn-in period and 10,000 iterations. Allele frequencies burn-in each of the
K clusters (from 2 to 15) were estimated, and the percentage of genome
derived from each cluster was estimated for each accession. Pairwise differentiation indexes FST (37) were calculated with the hierfstat R
pack-age (38) to estimate the distances between groups.
Geographical projections of PCoA axes or admixture matrixes were obtained using a Kriging method. Kriging is an interpolation method that relies on a model where the covariance matrix of
on July 3, 2019
http://advances.sciencemag.org/
admixture coefficients or principal coordinate scores exponentially decreases with distance (39). The spatial prediction is based on a Gaussian model. It supposes that the covariance matrix is stationary. The one we used is implemented in TESS3 (40).
SUPPLEMENTARY MATERIALS
Supplementary material for this article is available at http://advances.sciencemag.org/cgi/ content/full/5/5/eaav0536/DC1
Fig. S1. Assignment of 632 landraces to genetic groups. Fig. S2. PCoA calculated with 8741 haplotypes on landraces. Fig. S3. Isolation by distance.
Fig. S4. Geographical projection of the frequency of rare alleles and singletons in landraces. Fig. S5. Temporal evolution of the worldwide genetic diversity.
Fig. S6. Frequency of major haplotype groups in Europe. Fig. S7. Frequency of major haplotype groups in the MED.
Fig. S8. Frequency of major haplotype groups in Middle East and Central Asia. Fig. S9. Frequency of major haplotype groups in South Eastern Asia. Fig. S10. Frequency of major haplotype groups in China. Fig. S11. Frequency of major haplotype groups in Africa. Fig. S12. Frequency of major haplotype groups in America. Fig. S13. Frequency of major haplotype groups in the United States. Fig. S14. Frequency of major haplotype groups in Oceania.
Fig. S15. Proportion of the 11 groups among the landraces, traditional cultivars, and modern varieties from different regions of the world.
Table S1. Description of the eight subpopulations of landraces.
Table S2. Pairwise comparisons of five subpopulations of landraces westward of the Fertile Crescent.
Table S3. Pairwise comparisons of five subpopulations of landraces eastward of the Fertile Crescent.
Table S4. Description of the 11 groups of accessions. Table S5. Main SVs (>5 Mb) detected in the wheat genome. Data file S1. List of 4506 wheat accessions and related information.
Data file S2. Genotyping data of 4506 wheat accession with 113,457 genome-wide SNPs. Data file S3. Haplotyping data of 4403 wheat accessions with 8741 haplotypic blocks. Members of the IWGSC Consortium
Members of the BreedWheat Consortium
REFERENCES AND NOTES
1. M. Heun, R. Schäfer-Pregl, D. Klawan, R. Castagna, M. Accerbi, B. Borghi, F. Salamini, Site of einkorn wheat domestication identified by DNA fingerprinting. Science 278, 1312–1314 (1997).
2. F. Salamini, H. Ozkan, A. Brandolini, R. Schäfer-Pregl, W. Martin, Genetics and geography of wild cereal domestication in the Near East. Nat. Rev. Genet. 3, 429–441 (2002). 3. A. P. Bonjean, W. J. Angus, The World Wheat Book: A History of Wheat Breeding (Lavoisier
Publishing Inc., 2001).
4. P. S. Baenziger, W. K. Russell, G. L. Graef, B. T. Campbell, Improving lives. Crop. Sci. 46, 2230–2244 (2006).
5. F. Balfourier, V. Roussel, P. Strelchenko, F. Exbrayat-Vinson, P. Sourdille, G. Boutet, J. Koenig, C. Ravel, O. Mitrofanova, M. Beckert, G. Charmet, A worldwide bread wheat core collection arrayed in a 384-well plate. Theor. Appl. Genet. 114, 1265–1275 (2007). 6. H. Rimbert, B. Darrier, J. Navarro, J. Kitt, F. Choulet, M. Leveugle, J. Duarte, N. Rivière,
K. Eversole; International Wheat Genome Sequencing Consortium, J. le Gouis; The BreedWheat Consortium, A. Davassi, F. Balfourier, M. C. le Paslier, A. Berard, D. Brunel, C. Feuillet, C. Poncet, P. Sourdille, E. Paux, High throughput SNP discovery and genotyping in hexaploid wheat. PLOS ONE 13, e0186329 (2018).
7. International Wheat Genome Sequencing Consortium; IWGSC RefSeq principal invetors, R. Appels, K. Eversole, N. Stein, C. Feuillet, B. Keller, J. Rogers, C. J. Pozniak, F. Choulet, A. Distelfeld, J. Poland, G. Ronen, A. G. Sharpe, O. Barad, K. Baruch, G. Keeble-Gagnère, M. Mascher, G. Ben-Zvi, A.-A. Josselin, A. Himmelbach, F. Balfourier, J. Gutierrez-Gonzalez, M. Hayden, C. S. Koh, G. Muehlbauer, R. K. Pasam, E. Paux, P. Rigault, J. Tibbits, V. Tiwari, M. Spannagl, D. Lang, H. Gundlach, G. Haberer, K. F. X. Mayer, D. Ormanbekova, V. Prade, H. Šimková, T. Wicker, D. Swarbreck, H. Rimbert, M. Felder, N. Guilhot, G. Kaithakottil, J. Keilwagen, P. Leroy, T. Lux, S. Twardziok, L. Venturini, A. Juhász, M. Abrouk, I. Fischer, C. Uauy, P. Borrill, R. H. Ramirez-Gonzalez, D. Arnaud, S. Chalabi, B. Chalhoub, A. Cory, R. Datla, M. W. Davey, J. Jacobs, S. J. Robinson, B. Steuernagel, F. van Ex, B. B. H. Wulff, M. Benhamed, A. Bendahmane, L. Concia, D. Latrasse, J. Bartoš, A. Bellec, H. Berges, J. Doležel, Z. Frenkel, B. Gill, A. Korol, T. Letellier, O.-A. Olsen, K. Singh, M. Valárik, E. van der Vossen, S. Vautrin, S. Weining, T. Fahima, V. Glikson, D. Raats, J. Číhalíková, H. Toegelová, J. Vrána, P. Sourdille, B. Darrier, D. Barabaschi, L. Cattivelli, P. Hernandez, S. Galvez, H. Budak, J. D. G. Jones, K. Witek, G. Yu, I. Small, J. Melonek, R. Zhou, T. Belova,
K. Kanyuka, R. King, K. Nilsen, S. Walkowiak, R. Cuthbert, R. Knox, K. Wiebe, D. Xiang, A. Rohde, T. Golds, J. Čížková, B. A. Akpinar, S. Biyiklioglu, L. Gao, A. N’Daiye, M. Kubaláková, J. Šafář, F. Alfama, A.-F. Adam-Blondon, R. Flores, C. Guerche, M. Loaec, H. Quesneville, J. Condie, J. Ens, R. Maclachlan, Y. Tan, A. Alberti, J.-M. Aury, V. Barbe, A. Couloux, C. Cruaud, K. Labadie, S. Mangenot, P. Wincker, G. Kaur, M. Luo, S. Sehgal, P. Chhuneja, O. P. Gupta, S. Jindal, P. Kaur, P. Malik, P. Sharma, B. Yadav, N. K. Singh, J. P. Khurana, C. Chaudhary, P. Khurana, V. Kumar, A. Mahato, S. Mathur, A. Sevanthi, N. Sharma, R. S. Tomar, K. Holušová, O. Plíhal, M. D. Clark, D. Heavens, G. Kettleborough, J. Wright, B. Balcárková, Y. Hu, E. Salina, N. Ravin, K. Skryabin, A. Beletsky, V. Kadnikov, A. Mardanov, M. Nesterov, A. Rakitin, E. Sergeeva, H. Handa, H. Kanamori, S. Katagiri, F. Kobayashi, S. Nasuda, T. Tanaka, J. Wu, F. Cattonaro, M. Jiumeng, K. Kugler, M. Pfeifer, S. Sandve, X. Xun, B. Zhan, J. Batley, P. E. Bayer, D. Edwards, S. Hayashi, Z. Tulpová, P. Visendi, L. Cui, X. Du, K. Feng, X. Nie, W. Tong, L. Wang, Shifting the limits in wheat research and breeding through a fully annotated and anchored reference genome sequence. Science 361, eaar7191 (2018).
8. K. Jordan, S. Wang, Y. Lun, L.-J. Gardiner, R. MacLachlan, P. Hucl, K. Wiebe, D. Wong, K. L. Forrest; IWGS Consortium, A. G. Sharpe, C. H. D. Sidebottom, N. Hall, C. Toomajian, T. Close, J. Dubcovsky, A. Akhunova, L. Talbert, U. K. Bansal, H. S. Bariana, M. J. Hayden, C. Pozniak, J. A. Jeddeloh, A. Hall, E. Akhunov, A haplotype map of allohexaploid wheat reveals distinct patterns of selection on homoeologous genomes. Genome Biol. 16, 48 (2015). 9. S. Wang, D. Wong, K. Forrest, A. Allen, S. Chao, B. E. Huang, M. Maccaferri, S. Salvi,
S. G. Milner, L. Cattivelli, A. M. Mastrangelo, A. Whan, S. Stephen, G. Barker, R. Wieseke, J. Plieske; International Wheat Genome Sequencing Consortium, M. Lillemo, D. Mather, R. Appels, R. Dolferus, G. Brown-Guedira, A. Korol, A. R. Akhunova, C. Feuillet, J. Salse, M. Morgante, C. Pozniak, M. C. Luo, J. Dvorak, M. Morell, J. Dubcovsky, M. Ganal, R. Tuberosa, C. Lawley, I. Mikoulitch, C. Cavanagh, K. J. Edwards, M. Hayden, E. Akhunov, Characterization of polyploid wheat genomic diversity using a high-density 90 000 single nucleotide polymorphism array. Plant Biotechnol. J. 12, 787–796 (2014).
10. J. Lachance, S. A. Tishkoff, SNP ascertainment bias in population genetic analyses: Why it is important, and how to correct it. Bioessays 35, 780–786 (2013).
11. Z. H. He, S. Rajaram, Z. Y. Xin, G. Z. Huang, A History of Wheat Breeding in China (CIMMYT, 2001).
12. S. Salvi, O. Porfiri, S. Ceccarelli, Nazareno Strampelli, the ‘Prophet’ of the green revolution.
J. Agric. Sci. 151, 1–5 (2013).
13. C. Hao, Y. Wang, S. Chao, T. Li, H. Liu, L. Wang, X. Zhang, The iSelect 9 K SNP analysis revealed polyploidization induced revolutionary changes and intense human selection causing strong haplotype blocks in wheat. Sci. Rep. 7, 41247 (2017).
14. A. Betts, P. W. Jia, J. Dodson, The origins of wheat in China and potential pathways for its introduction: A review. Quat. Int. 348, 158–168 (2014).
15. H. Tsujimoto, T. Yamada, T. Sasakuma, Pedigree of common wheat in East Asia deduced from distribution of the gametocidal inhibitor gene (Igc1) and -amylase isozymes.
Jpn. J. of Breed. 48, 287–291 (1998).
16. Y. Zhou, Z. Chen, M. Cheng, J. Chen, T. Zhu, R. Wang, Y. Liu, P. Qi, G. Chen, Q. Jiang, Y. Wei, M. C. Luo, E. Nevo, R. G. Allaby, D. Liu, J. Wang, J. Dvorák, Y. Zheng, Uncovering the dispersion history, adaptive evolution and selection of wheat in China. Plant Biotechnol. J.
16, 280–291 (2018).
17. A. L. Olmstead, P. W. Rhode, Adapting North American wheat production to climatic challenges, 1839–2009. Proc. Natl. Acad. Sci. U.S.A. 108, 480–485 (2011).
18. Q. M. Paulsen, J. P. Shroyer, The early history of wheat improvement in the Great Plains.
Agron. J. 100, S70 (2008).
19. R. Joukhadar, H. D. Daetwyler, U. K. Bansal, A. R. Gendall, M. J. Hayden, Genetic diversity, population structure and ancestral origin of Australian wheat. Front. Plant Sci. 8, 2115 (2017).
20. J. P. Didion, H. Yang, K. Sheppard, C.-P. Fu, L. McMillan, F. P.-M. de Villena, G. A. Churchill, Discovery of novel variants in genotyping arrays improves genotype retention and reduces ascertainment bias. BMC Genomics 13, 34 (2012).
21. R. Hajjar, T. Hodgkin, The use of wild relatives in crop improvement: A survey of developments over the last 20 years. Euphytica 156, 1–13 (2007).
22. X. Cai, D. Liu, Identification of a 1B/1R wheat-rye chromosome translocation.
Theor. Appl. Genet. 77, 81–83 (1989).
23. M. Helguera, I. A. Khan, J. Kolmer, D. Lijavetzky, L. Zhong-qi, J. Dubcovsky, PCR assays for the Lr37-Yr17-Sr38 cluster of rust resistance genes and their use to develop isogenic hard red spring wheat lines. Crop. Sci. 43, 1839–1847 (2003).
24. V. Kuraparthy, P. Chhuneja, H. S. Dhaliwal, S. Kaur, R. L. Bowden, B. S. Gill, Characterization and mapping of cryptic alien introgression from Aegilops geniculata with new leaf rust and stripe rust resistance genes Lr57 and Yr40 in wheat. Theor. Appl. Genet. 114, 1379–1389 (2007).
25. B. B. Wulff, M. J. Moscou, Strategies for transferring resistance into wheat: From wide crosses to GM cassettes. Front. Plant Sci. 5, 692 (2014).
26. S. D. Tanksley, S. R. McCouch, Seed banks and molecular maps: Unlocking genetic potential from the wild. Science 277, 1063–1066 (1997).
27. P. Hedden, The genes of the Green Revolution. Trends Genet. 19, 5–9 (2003).
on July 3, 2019
http://advances.sciencemag.org/
28. N. Rawat, M. O. Pumphrey, S. Liu, X. Zhang, V. K. Tiwari, K. Ando, H. N. Trick, W. W. Bockus, E. Akhunov, J. A. Anderson, B. S. Gill, Wheat Fhb1 encodes a chimeric lectin with agglutinin domains and a pore-forming toxin-like domain conferring resistance to Fusarium head blight. Nat. Genet. 48, 1576–1580 (2016).
29. A. A. Golicz, J. Batley, D. Edwards, Towards plant pangenomics. Plant Biotechnol. J. 14, 1099–1105 (2016).
30. R. K. Saxena, D. Edwards, R. K. Varshney, Structural variations in plant genomes.
Brief. Funct. Genomics 13, 296–307 (2014).
31. H. Tettelin, D. Riley, C. Cattuto, D. Medini, Comparative genomics: The bacterial pan-genome. Curr. Opin. Microbiol. 11, 472–477 (2008).
32. J. D. Montenegro, A. A. Golicz, P. E. Bayer, B. Hurgobin, H. Lee, C.-K. K. Chan, P. Visendi, K. Lai, J. Doležel, J. Batley, D. Edwards, The pangenome of hexaploid bread wheat.
Plant J. 90, 1007–1013 (2017).
33. J. C. Barrett, B. Fry, J. Maller, M. J. Daly, Haploview: Analysis and visualization of LD and haplotype maps. Bioinformatics 21, 263–265 (2005).
34. S. Purcell, B. Neale, K. Todd-Brown, L. Thomas, M. A. R. Ferreira, D. Bender, J. Maller, P. Sklar, P. I. W. de Bakker, M. J. Daly, P. C. Sham, PLINK: A tool set for whole-genome association and population-based linkage analyses. Am. J. Hum. Genet. 81, 559–575 (2007). 35. J. K. Pritchard, M. Stephens, P. Donnelly, Inference of population structure using
multilocus genotype data. Genetics 155, 945–459 (2000).
36. D. Falush, M. Stephens, J. K. Pritchard, Inference of population structure using multilocus genotype data: Linked loci and correlated allele frequencies. Genetics 164, 1567–1587 (2003).
37. B. S. Weir, C. C. Cockerham, Estimating F-statistics for the analysis of population structure.
Evolution 38, 1358–1370 (1984).
38. J. Goudet, hierfstat, a package for r to compute and test hierarchical F-statistics.
Mol. Ecol. Notes 5, 184 (2005).
39. N. Cressie, Statistics for Spatial Data (John Wiley & Sons Inc., ed. 1, 1993).
40. K. Caye, F. Jay, O. Michel, O. Francois, Fast inference of individual admixture coefficients using geographic data. Ann. Appl. Stat. 12, 586–608 (2018).
Acknowledgments: We would like to acknowledge the IWGSC and especially R. Appels
(Murdoch University, Murdoch, Australia), C. Feuillet (Inari Agriculture, Boston, USA), B. Keller (University of Zürich, Zürich, Switzerland), S. Praud (Biogemma, Chappes, France), U. Baumann (University of Adelaide, Adelaide, Australia), H. Budak (Montana State University, Bozeman, USA), J. Rogers (Eversole Associates, Bethesda, USA), and K. Eversole (Eversole Associates,
Bethesda, USA). We are also grateful to the BreedWheat Consortium leaders: M. Alaux (URGI, INRA, Versailles, France), B. Bejar (Céréales Vallée, Saint-Beauzire, France), S. Lafarge (Biogemma, Chappes, France), E. Lagendijk (INRA Transfert, Clermont-Ferrand, France), J. Derory (Limagrain, Chappes, France), and J. Le Gouis (GDEC, INRA, Clermont-Ferrand, France). Many thanks to M. Deloche and L. Bardy (GDEC, INRA, Clermont-Ferrand, France) for providing seeds and to M. Alaux and T. Letellier (URGI, INRA, Versailles, France) for hosting data. Axiom genotyping was conducted on the genotyping platform GENTYANE at INRA, Clermont-Ferrand (gentyane.clermont.inra.fr). Sample seeds were provided by the Small Grain Cereals Biological Resources Centre at INRA, Clermont-Ferrand (www6.clermont.inra.fr/ umr1095_eng/Teams/Research/Biological-Resources-Centre). Funding: The research leading to these results have received funding from the French Government managed by the Research National Agency (ANR) under the Investment for the Future program (BreedWheat project ANR-10-BTBR-03), from FranceAgriMer, French funds to support plant breeding (FSOV) from Région Auvergne, and from INRA. R.D.O. was funded by a grant from the French Ministry for Research. Author contributions: Conceptualization: F.B., S.B., and E.P.; methodology: F.B., S.B., and E.P; software: H.R. and F.C.; validation: F.B., S.B., and E.P; formal analysis: F.B., S.B., R.D.O., S.R., and E.P; investigation: J.K., H.R., F.C., and E.P; resources: F.B., IWGSC, BreedWheat Consortium, and E.P; data curation: H.R. and E.P; writing (original draft preparation): F.B., S.B., and E.P.; writing (reviewing and editing): F.B., S.B., and E.P; visualization: F.B., S.B., R.D.O., and E.P; supervision: F.B. and E.P; project administration: F.B. and E.P; funding acquisition: F.B., BreedWheat Consortium, and E.P. Competing interests: The authors declare that they have no competing interests. Data and materials availability: All data needed to evaluate the conclusions in the paper are present in the paper and/or the Supplementary Materials. Additional data related to this paper may be requested from the authors. Sample seeds of studied accessions can be requested under material transfer agreement at the INRA Small Grain Cereals Biological Resources Centre (crb-ara@inra.fr) or using SIReGal website (https:// urgi.versailles.inra.fr/siregal/siregal/grc.do).
Submitted 9 August 2018 Accepted 22 April 2019 Published 29 May 2019 10.1126/sciadv.aav0536
Citation: F. Balfourier, S. Bouchet, S. Robert, R. De Oliveira, H. Rimbert, J. Kitt, F. Choulet, International Wheat Genome Sequencing Consortium, BreedWheat Consortium, E. Paux, Worldwide phylogeography and history of wheat genetic diversity. Sci. Adv. 5, eaav0536 (2019).
on July 3, 2019
http://advances.sciencemag.org/
DOI: 10.1126/sciadv.aav0536 (5), eaav0536.
5 Sci Adv
ARTICLE TOOLS http://advances.sciencemag.org/content/5/5/eaav0536
MATERIALS
SUPPLEMENTARY http://advances.sciencemag.org/content/suppl/2019/05/23/5.5.eaav0536.DC1
REFERENCES
http://advances.sciencemag.org/content/5/5/eaav0536#BIBL
This article cites 37 articles, 6 of which you can access for free
PERMISSIONS http://www.sciencemag.org/help/reprints-and-permissions
Terms of Service
Use of this article is subject to the
registered trademark of AAAS.
is a Science Advances Association for the Advancement of Science. No claim to original U.S. Government Works. The title
York Avenue NW, Washington, DC 20005. 2017 © The Authors, some rights reserved; exclusive licensee American (ISSN 2375-2548) is published by the American Association for the Advancement of Science, 1200 New Science Advances
on July 3, 2019
http://advances.sciencemag.org/