Publisher’s version / Version de l'éditeur:
ASME Conference Proceedings, 2009, pp. 585-590, 2009-01-01
READ THESE TERMS AND CONDITIONS CAREFULLY BEFORE USING THIS WEBSITE. https://nrc-publications.canada.ca/eng/copyright
Vous avez des questions? Nous pouvons vous aider. Pour communiquer directement avec un auteur, consultez la première page de la revue dans laquelle son article a été publié afin de trouver ses coordonnées. Si vous n’arrivez pas à les repérer, communiquez avec nous à PublicationsArchive-ArchivesPublications@nrc-cnrc.gc.ca.
Questions? Contact the NRC Publications Archive team at
PublicationsArchive-ArchivesPublications@nrc-cnrc.gc.ca. If you wish to email the authors directly, please see the first page of the publication for their contact information.
NRC Publications Archive
Archives des publications du CNRC
This publication could be one of several versions: author’s original, accepted manuscript or the publisher’s version. / La version de cette publication peut être l’une des suivantes : la version prépublication de l’auteur, la version acceptée du manuscrit ou la version de l’éditeur.
For the publisher’s version, please access the DOI link below./ Pour consulter la version de l’éditeur, utilisez le lien DOI ci-dessous.
https://doi.org/10.1115/OMAE2009-80053
Access and use of this website and the material on it are subject to the Terms and Conditions set forth at
Mooring analysis of a weather vaning FPSO in bi-birectional sea states
Chillamcharia, G. K.; Thiagarajan, K. P.; Winsor, F.
https://publications-cnrc.canada.ca/fra/droits
L’accès à ce site Web et l’utilisation de son contenu sont assujettis aux conditions présentées dans le site LISEZ CES CONDITIONS ATTENTIVEMENT AVANT D’UTILISER CE SITE WEB.
NRC Publications Record / Notice d'Archives des publications de CNRC:
https://nrc-publications.canada.ca/eng/view/object/?id=992bd8e8-f31e-4935-987e-45773c15321e https://publications-cnrc.canada.ca/fra/voir/objet/?id=992bd8e8-f31e-4935-987e-45773c15321eNational Research Council Canada Institute for Ocean Technology Conseil national de recherches Canada Institut des technologies oc ´eaniques
IR-2009-03
Institute Report
Mooring analysis of a weather vaning FPSO in
bi-birectional sea states.
Chillamcharia, G.; Thiagarajan, K.; Winsor, F.
Chillamcharia, G.; Thiagarajan, K.; Winsor, F., 2009. Mooring analysis of a weather vaning FPSO in bi-birectional sea states. 28th International Conference on Ocean, Offshore and Arctic Engineering, 31 May - 5 June, 2009, Honolulu, Hawaii
1
Proceedings of the ASME 28th International Conference on Ocean Offshore and Arctic Engineering OMAE2009 May 31-Jun 05 2009, Honolulu, Hawaii, USA
OMAE2009-80053
Mooring analysis of a weathervaning FPSO in bi-directional sea-states
G K Chillamcharla1, K P Thiagarajan1 and F Winsor2
1School of Mechanical Engineering, University of Western Australia, Crawley, WA, Australia 2Institute of Ocean Technology, National Research Council, St. John’s Canada
ABSTRACT
Experimental studies were carried out at the Institute for Ocean Technology, Canada, in collaboration with the University of Western Australia (UWA) to assess the response of a moored 1:60 scaled Floating Production Storage and Offloading (FPSO) model in bi-directional sea-states. The seastates comprise of a regular swell approaching in the head sea condition, and a JONSWAP wind sea approaching at various angles. The FPSO was moored in position by four spring-loaded mooring lines attached to an internal turret about which the model could weathervane. Previous papers by the authors have described the unpredictable yaw instability of the FPSO driven by long period swells, which was evidenced in the experiments. This creates difficulties in comparing motions from uni-directional and bi-uni-directional seas, because the headings alter the response. However, the mooring tensions are relatively immune to yaw instabilities and this paper discusses effects of bi-directional seas on the mooring tensions.
Numerical simulations are conducted using a time domain analysis software which simulates the motions of floating and moored structures in response to irregular seas. Simulations based on the software when compared with model tests at 45, 60 and 90 deg separation between the sea and swell shows reasonable agreement in terms of mooring tensions. Simulations are then conducted for a range of separation angles, and the effects of bi-directionality are further evaluated. It is found that a linear addition of the individual seastates can produce non-conservative results, which reinforces the fact that bi-directional seastates are important considerations for offshore operations of an FPSO.
INTRODUCTION
Floating Production, Storage and Offloading (FPSO) systems are attractive options in the development of marginal fields with a short field life. FPSOs are ship-shaped vessels deployed to produce from subsea wells. They can be disconnected at the end of the field life, in principle, and moved to other locations for further production. The ability to store produced fluid is an important feature of FPSO, and enables application in remote fields. Offloading is made possible by means of shuttle tankers.
An FPSO may be moored by several lines connected to a freely rotating internal turret. Thus the FPSO can rotate naturally and position itself in the direction of maximum environmental forces. This process is called as “weathervaning”. The weathervaning process is strongly influenced by the nonlinear drift loads on the hull. Further, in complex sea states different environmental forces such as wind-sea, swell, wind and current arrive from different directions. This makes any prediction of intended weathervaning direction unreliable. Leite et al. (1999) discuss the directional stability of an FPSO in waves and current. These authors have discussed the use of rudders to maintain the heading of the FPSO.
Some studies on multi-directional metocean conditions have been published. Bitner-Gregerson (2005) for example published a model for joint probability of seas and swells. Young (2003) suggests that there is no universal correlation between wind-driven seas and long period swells, and these can virtually have any relative direction of propagation. Toffoli et al. (2006) found that the nonlinear interaction between various sea components can be significant if the components are slightly separated in their directions. The responses of moored floating offshore structures in a complex sea are essential for the analysis of mooring and positioning problems. For a weathervaning FPSO, the surge, sway and yaw motions are driven by the slow-drift effects, while heave, roll and pitch are mainly wave-frequency responses. The actual motions may depend on specific details of the sea state such as directionality. Yadav et al. (2007) found that an FPSO exhibited yaw instabilities in regular waves when the wave length to ship length ratio was in the range 0.6 – 1.7. This affected the motion response due to relative heading changes. Sphaier et al. (2002) discussed the stability of an FPSO during offloading and emphasized the importance of eigenvalue analysis for stable design of single point mooring (SPM) units.
Ewans and Shaw (2003) described the response statistics of a weathervaning LNG FPSO. They illustrated the dependency of the vessel heading on the direction of the wind-seas and swells and how these contributed to the motions of the FPSO. They pointed out the significance of roll motions as the single most important response parameter for a side-by-side offloading operation. Roll was in turn critically dependent on the relative direction of the swell to
Proceedings of the ASME 2009 28th International Conference on Ocean, Offshore and Arctic Engineering
OMAE2009 May 31 - June 5, 2009, Honolulu, Hawaii, USA
OMAE2009-
80053
the vessel which itself was largely aligned with the wind-sea and wind.
Wave bi-directionality plays an important role in fatigue damage estimates. Conventional fatigue calculations are normally based on one scatter diagram combined with a Pierson-Moskowitz, JONSWAP or Torsethaugen wave spectrum. Different directions and contributions between sea and swell are not taken into account. A refinement of this methodology for bi-directional seastate would be to calculate fatigue damages separately due to sea and swell and sum to obtain the total damage. Andersen et al (2008) proposed a new approach on fatigue assessment for non-collinear sea and swell. Their methodology combines the stress response spectra from sea and swell in order to calculate the total damage. The results showed that the conventional approach may give non-conservative fatigue damage estimates on the swell exposed side of the FPSO. The importance of wave directionality on fatigue design of flexible risers was emphasized by the study de Lemos et al. (2003), in particular for those deployed with a weathervaning FPSO.
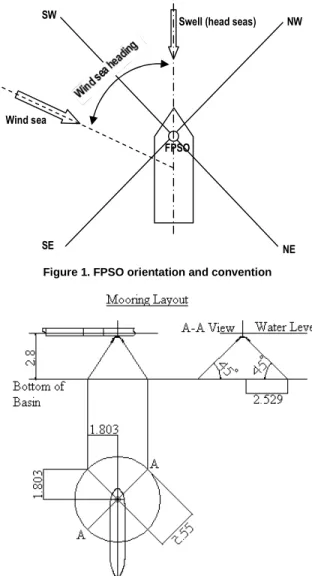
Our research is focused on behavior of FPSO in complex, bi-directional and bi-modal sea states. The seastates considered here comprise of a monochromatic swell in the head sea direction, combined with a wind-generated spectral sea coming from various angles with respect to the swell (Fig. 1). Previous papers by the authors (see e.g Yadav et al. 2007) showed complex motion behavior of the FPSO in such seastates. In this paper, we present the influence of seastates on mooring tensions. Further, we wish to investigate the conservativism of common industry practice of linearly superposing the loads from various directions. Numerical simulations backed by experimental studies are reported in this paper.
EXPERIMENTAL CAMPAIGN
The tests were conducted at the Ocean Basin, Institute of Ocean Technology, National Research Council, Canada. The basin is 75m long, 32m wide and 3.2m deep. The basin is equipped with 168 hydraulically actuated individual wave-maker segments in ‘L’ configuration. This allowed wind seas and swells to be generated at a relative angle varying from around 30o – 90o. Fixed and movable passive absorbers were installed at the opposite ends of the basin to maintain reflected energy under 5% incident.
The experiments were carried out on a 1:60 scaled down model of a generic FPSO fitted with an internal turret. The FPSO model characteristics are given in Table 1. The bottom of the turret was a circular turntable where four mooring lines were attached at 90o separation (Figs. 1 and 2). The mooring lines were pre-tensioned and equipped with inline load cells (Fig. 3) for measuring the tension in the lines. The model was free to pivot around the turret. A water depth of 2.8 m (168 m full scale) was used for the tests. It was equipped with a 6 DOF optical tracking system to measure the motions. In addition, a six-axis inertial system was used to record the three linear accelerations and the three angular velocities. An accelerometer was also used to record the vertical accelerations of the FPSO model. All
Figure 1. FPSO orientation and convention
Figure 2. Model test mooring layout
Figure 3. Load cells attached to FPSO Model
the instruments had a very good resolution and repeatability, with measured errors typically in the order of 0.1 - 0.5%. Prior to installing the FPSO model in the basin, all the sea states were run with an array of wave probes in place of the model. The measured waves were compared against input conditions. In regular waves, the measured wave heights were used for calculating the Response Amplitude Operators for the FPSO model.
3
Table 1 Model Characteristics
Parameter Notation Value Unit
Overall Length L 5.849 M
Length between perpendiculars Lpp 5.300 M
Beam W 0.954 M
Depth D 0.470 M
Draft df 0.176 M
Displacement Dhydro 672 Kg
Displacement (measured) Dmeasure 675 Kg
Metacentric Height GM 0.462 M
Vertical Centre of Gravity, above keel
VCG 0.284 M
Longitudinal Centre of Gravity, fore of aft perpendicular
LCG 2.873 M
Transverse Centre of Gravity TCG 0.000 M
Vertical Centre of Buoyancy VCB 0.091 M
Longitudinal Centre of Buoyancy, fore of aft perpendicular
LCB 2.873 M
Transverse Centre of Buoyancy TCB 0.000 M
Longitudinal Centre of Flotation, fore of aft perpendicular
LCF 2.811 M
Transverse Centre of Floatation TCF 0.000 M
Radius of Gyration about Roll Axis
rroll 0.272 M
Radius of Gyration about Pitch Axis
rpitch 1.404 M
Radius of Gyration about Yaw Axis ryaw 1.417 M Prismatic Co-efficient 0.772 Block Co-efficient 0.770 Midship Co-efficient 0.998 Waterplane Co-efficient 0.822 Waterplane Area 4.076 m2
Wetted Surface Area 5.427 m2
Table 2 Decay Test Analysis
Degree of Freedom Natural Period (sec) Damping Ratio (%) Surge 18.69 1.800 Sway 18.75 0.012 Pitch 1.46 1.070 Roll 1.56 1.310
Mooring stiffness tests were carried out to measure the restoring force characteristic of the moored FPSO model. Incremental forcing in the longitudinal and transverse directions with concurrent measurement of displacements were used to estimate the stiffness. Each mooring line consisted of a spring of spring stiffness 40N/m ±5% and 1.5 mm (1/16 inch) stainless steel, 7x7 wire rope, which has a manufacturer listed Young’s Modulus of 57.3 kN/mm2. Once the FPSO model was in place, decay tests were conducted in surge, sway, roll and pitch. A log-decrement calculation was performed to evaluate the natural periods and critical damping ratios as shown in Table 2. Heave
decay tests were not carried out since the relatively large heave stiffness makes setting up initial conditions difficult. Tests were conducted in regular waves, uni-directional spectral waves, and a combination of the two at different angles. The swell was modelled by regular sinusoidal waves, and the wind-seas by a JONSWAP spectrum of different significant wave heights and periods. The relative separation between the sea and swell was set at 45o, 60o and 90o. Table 3 lists the wave conditions used in this study. Experimental data was acquired at a sampling frequency of 50 Hz and the center of gravity was the reference point for the motions.
Table 3. Environmental conditions used
Wave System Hship Tship Hmodel Tmodel
Swell 1 4.26 11.65 0.071 1.504
Swell 2 9.54 12.363 0.159 1.596
Swell 3 15.9 12.363 0.265 1.596
Wind -sea 7.98 11.999 0.133 1.549
NUMERICAL MODELLING
The numerical modelling was done with help of a boundary element software suite, AQWA. The full scale FPSO model was developed. The following software tools were used to perform analysis sequentially.
AQWA-LINE, a 3-D diffraction and radiation analysis program for structure response calculations, hydrostatic analysis and hydrodynamic analysis. AQWA-LINE file coordinates was derived from a table of offsets to define half the hull structure. A half-hull discretization was used as the model was symmetrical about the x-axis. A total of 861 diffracting elements were required as shown in Fig. 4.
AQWA-LIBRIUM, an eigen value analysis program to find the equilibrium characteristics of a moored or freely floating body or bodies. AQWA-LIBRIUM was used to investigate the natural periods of the FPSO model and to verify the same with the model decay tests. An important aspect of this is the iterative procedure as shown in Figure 5. The
Figure 4. AQWA model showing diffracting elements and mooring lines
4
linear damping from the decay tests were used as input intoAQWA to obtain a good match in natural periods.
AQWA-DRIFT, is a time domain program for wave forces, structure motion and mooring analysis in sea spectrum. The hydrodynamic coefficients calculated in AQWA-LINE are used in AQWA-DRIFT for the time integration based on an input time step. A time step of one second was used in the analysis of the FPSO model in all analysis.
AQWA Post Processing
After the time domain calculations in AQWA-DRIFT, the results were post processed in AQWA-GS which hosts many tools for signal processing, result statistics etc.
DISCUSSION OF RESULTS
Validation of mooring line loads
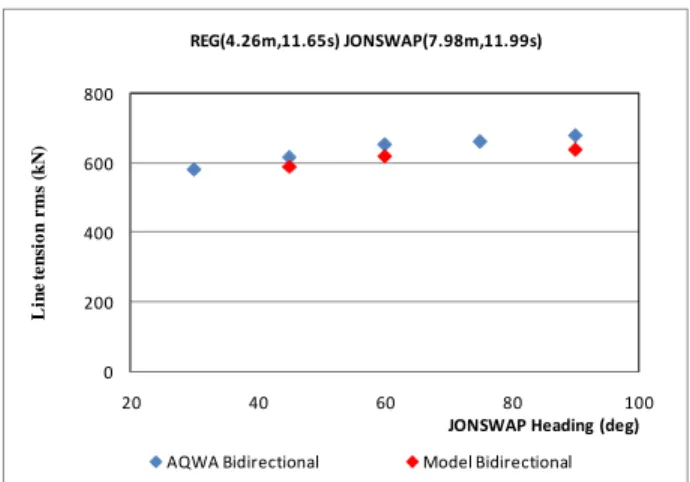
In uni-directional wind sea condition, the RMS line tensions obtained from AQWA were compared with the model test results in Fig. 6. The graph shows that the simulated tensions for the SE mooring line are slightly higher than model test results by 5 – 8%. Intermediate heading angles were also run with AQWA, and a systematic trend is noticed in good agreement with model tests. Fig. 7 shows similar results for bi-directional seastates where the swell is in the head sea condition. Here too, AQWA results are over-predicting by 4 – 7%.
Figure 5. Numerical processing flow chart Comparison of Wind Sea + Swell and Bidirectional sea
states
Figures 8 - 11 show the maximum tensions for the four mooring lines for different environmental conditions. The common variable is the wind sea heading relative to swell (Fig. 1). There is clearly an increase in tension with increasing seastates corresponding to increased swell height. The most loaded line is the SW line, corresponding to the occurrence of maximum loads. Also shown in the figures with filled symbols are corresponding results obtained by a linear sum of swell and seas. At the lower two seastates, the bi-directional condition consistently produces a higher tension for all headings. At the smaller heading of 30o, the tension obtained by linear summation can be up to 100%
Figure 6. SE Mooring Line load comparison for Unidirectional Wind sea
Figure 7. SE Mooring Line load comparison for Bidirectional Seas
lower than the result from bi-directional sea. This shows that loads on mooring lines may be under-predicted if a linear addition of seastate approach is used.
An interesting transition is observed at the highest seastate for a heading of 60o. For headings greater than 60o, the linear addition seems to produce a higher tension than the bi-directional seas. This difference is not as dramatic as the former case, and a maximum difference of 30% is noted. Figs. 12 - 15 show corresponding results for RMS tension for the four lines. These tensions are important for evaluating fatigue loads on the lines. Again the bi-directional sea condition shows a much larger tension for most heading conditions. In moderate seastate condition, the most loaded line (SW) shows a maximum of 50% higher RMS tension in the bi-directional condition compared to linear addition of uni-directional conditions. Furthermore, it is seen that the 60o heading is most critical, with the most loaded line showing almost 50% higher loading in this heading. 0 200 400 600 800 20 40 60 80 100 L in e t e n si o n r m s (k N )
JONSWAP Heading (deg) Unidirectional Wind Seas
AQWA Unidirectiona Wind Sea Model Unidirectiona l Wind Sea
0 200 400 600 800 20 40 60 80 100 L in e t e n si o n r m s (k N )
JONSWAP Heading (deg) REG(4.26m,11.65s) JONSWAP(7.98m,11.99s)
AQWA Bidirectional Model Bidirectional
5
Figure 8. SE mooring line maximum tension vs. wind seaheading
Figure 9. SW mooring line maximum tension vs. wind sea heading
Figure 10. NE mooring line maximum tension vs. wind sea heading
CONCLUSIONS
Model test results on a generic FPSO in bi-directional seastates were used to validate the numerical results for mooring loads. A good agreement between numerical results and model test results was found.
Further numerical studies highlighted the following:
• The loads on the mooring lines were dependent on the directionality of the wind sea and the ratio of the wave heights of the wind-sea and swell.
• The linear addition of the individual sea state mooring line tensions can produce non-conservative results.
Figure 11 NW mooring line maximum tension vs. wind sea heading
Figure 12. SE mooring line RMS tension vs. wind sea heading
Figure 13. SW mooring line RMS tension vs. wind sea heading
Figure 14. NE mooring line RMS tension vs. wind sea heading 0 2000 4000 6000 8000 15 30 45 60 75 90 105 M a x li n e t e n si o n ( k N )
Wind sea heading (deg)
SE Mooring line
Bi-directional Sea-State 1 Wind Sea + Swell 1
Bi-directional Sea-State 2 Wind Sea + Swell 2
Bi-directional Sea-State 3 Wind Sea + Swell 3
0 2000 4000 6000 8000 15 30 45 60 75 90 105 M a x L in e t e n si o n ( k N )
Wind sea heading (deg)
SW Mooring line
Bi-directional Sea-State 1
Wind Sea + Swell 1
Bi-directional Sea-State 2 Wind Sea + Swell 2
Bi-directional Sea-State 3 Wind Sea + Swell 3
0 2000 4000 6000 8000 15 30 45 60 75 90 105 M a x L in e t e n si o n ( k N )
Wind sea heading (deg)
NE Mooring line
Bi-directional Sea-State 1 Wind Sea + Swell 1
Bi-directional Sea-State 2 Wind Sea + Swell 2
Bi-directional Sea-State 3 Wind Sea + Swell 3
0 2000 4000 6000 8000 15 30 45 60 75 90 105 M a x L in e t e n si o n ( k N )
Wind sea heading (deg) NW Mooring line
Bi-directional Sea-State 1 Wind Sea + Swell 1
Bi-directional Sea-State 2 Wind Sea + Swell 2
Bi-directional Sea-State 3 Wind Sea + Swell 3
0 500 1000 1500 2000 2500 15 30 45 60 75 90 105 R M S li n e t e n si o n ( k N )
Wind sea heading (deg) SE Mooring line
Bi-directional Sea-State 1 Wind Sea + Swell 1
Bi-directional Sea-State 2 Wind Sea + Swell 2
Bi-directional Sea-State 3 Wind Sea + Swell 3
0 500 1000 1500 2000 2500 15 30 45 60 75 90 105 R M S L in e t e n si o n ( k N )
Wind sea heading (deg)
SW Mooring line
Bi-directional Sea-State 1
Wind Sea + Swell 1
Bi-directional Sea-State 2 Wind Sea + Swell 2
Bi-directional Sea-State 3 Wind Sea + Swell 3
0 500 1000 1500 2000 2500 15 30 45 60 75 90 105 R M S L in e t e n si o n ( k N )
Wind sea heading (deg) NE Mooring line
Bi-directional Sea-State 1 Wind Sea + Swell 1
Bi-directional Sea-State 2 Wind Sea + Swell 2
Bi-directional Sea-State 3 Wind Sea + Swell 3
6
Figure 15. NW mooring line RMS tension vs. wind sea heading• The 60o wind sea heading appears to be critical for RMS tensions when the wind-sea and swell conditions are almost equal.
• For the higher ratios of swell to wind sea wave heights the linear summation of wind sea + swell mooring line tensions were in good agreement with bi-directional mooring line tensions.
In parts of the world where bi-directional sea states are regular features, the findings could have important considerations for fatigue life predictions of mooring lines. In particular, linear addition of seastates (and by extension cyclical loading) from various directions may lead to non-conservative estimates, as seen in this paper. Time domain simulations with multi-directional seastates would perhaps be a better indicator of the cyclical loading experienced by the mooring lines of a FPSO.
ACKNOWLEDGEMENTS
The Australian part of the research is funded by the Australian Research Council.
The simulations were conducted using AQWA software provided to UWA by an academic agreement with ANSYS, Inc.
The tests were conducted at IOT as part of research collaboration between UWA and IOT. The authors acknowledge the support of the technical staff at IOT for their support during the tests.
REFERENCES
Andersen, O J, and HAVER, S (2008), “Fatigue assessment of side shell details of an FPSO based on non-collinear sea and swell”, Proceedings 27th Intl. Offshore Mech. Arctic Engng. Conf. Estoril, Portugal.
Bitner-Gregerson, E, (2005) “Joint probabilistic description of combined seas”, Proceedings 24th Offshore Mech Arctic Engng, Paper 67382.
Ewans, K, and Shaw, C, (2003) “Oceanographic and motion response statistics for the operation of a weathervaning LNG FPSO”, Proceedings 24th Intl. Offshore Mech. Arctic Engng. Conf., Cancun.
Leite, A, Simos, A, Tannuri, E and Pesce, CP, (1999), “FPSO turret system stability and wave heading”,
Proceedings, 9th ISOPE, Brest, France, pp. 265 – 272. Lemos, C, Vaz, M A and Siqueira, M Q, (2003). “Flexible Riser Fatigue Evaluation for FPSOs in Bi-Directional Sea Spectra”, Proceedings 24th Intl. Offshore Mech. Arctic Engng. Conf., Paper 37244.
Sphaier, S H, Fernandes, A C, Correa, S, and Castro, G A, (2002), “Maneuvering model for FPSOs and stability analysis of the offloading operation”, J. Offshore Mech
Arctic Eng., vol. 124, pp 196 – 202.
Toffoli, A, Onorato, M and Monbaliu, J, (2006), “Wave statistics in unimodal and bimodal seas from a second-order model”, Eur J. Mechanics B/Fluids, 25, pp. 649 – 661. Young, I R, (1999), Wind Generated Ocean Waves, Elsevier Publ. London. 0 500 1000 1500 2000 2500 15 30 45 60 75 90 105 R M S L in e t e n si o n ( k N )
Wind sea heading (deg) NW Mooring line
Bi-directional Sea-State 1 Wind Sea + Swell 1
Bi-directional Sea-State 2 Wind Sea + Swell 2
Bi-directional Sea-State 3 Wind Sea + Swell 3