New Phytologist Supporting Information
Article title: Genome-wide patterns of differentiation and spatially varying selection between postglacial recolonization lineages of Populus alba (Salicaceae), a widespread forest tree
Authors: KAI N. STÖLTING, MARGOT PARIS, CÉCILE MEIER, BERTHOLD HEINZE, STEFANO CASTIGLIONE, DENES BARTHA AND CHRISTIAN LEXER
Article acceptance date: 25 February 2015
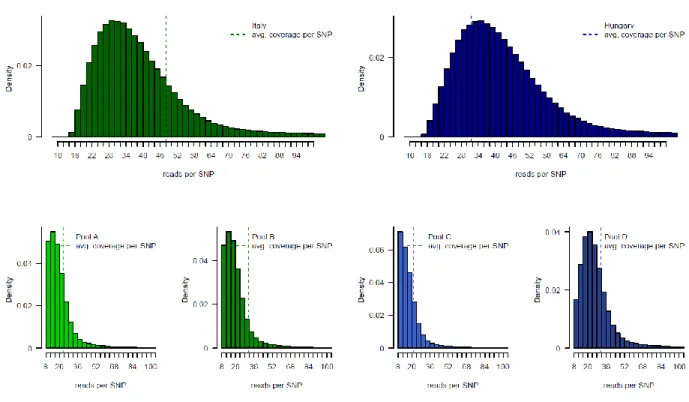
The following Supporting Information is available for this article: Fig. S1 Histogram of read coverage per SNP and DNA pool.
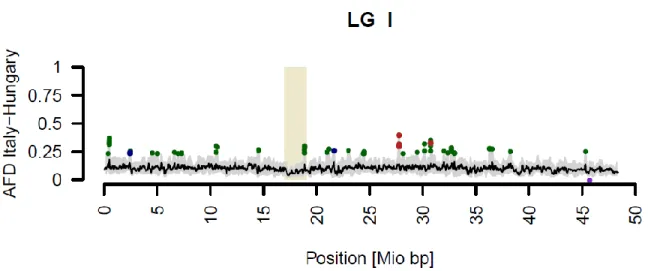
Fig. S2 Genomic patterns of genetic diversity and differentiation in P. alba visualized by windowed analysis.
Methods S1 Reference-mapping and SNP detection from pool-seq WGS data. Methods S2 SNP validation by Sanger sequencing.
Table S1 Microsatellite genotypes.
Table S2 Raw data for 1,775,768 SNP loci from pool-seq WGS in P. alba. Table S3 Description and primer sequences for five Sanger-sequenced genes.
Table S4 Number of haplotypes and reads recovered by Sanger sequencing and SOLiD4 pool-seq WGS.
Table S5 SNP outlier detection and allele frequency differentials (AFD) for comparisons among subpopulation replicates.
Table S6 Number of genes, Fisher's exact tests and false dicovery rates (FDR) for 63 gene ontology (GO) terms with significant enrichment in high-differentiation outlier genes. Table S7 SNP distribution along chromosomes.
Fig. S1 Distribution of read coverage per SNP and sampling locality for 1,775,768 SNP sites as recovered by pooled whole genome resequencing. The densities of reads covering SNPs are indicated together with the average coverages (hatched vertical lines) for each pooled DNA sample. Top row: A histogram of read coverage per SNP for the combined Italian DNA pools (dark green) and for combined Hungarian pools (dark blue). Bottom row from left to right: separate histograms of read coverage per SNP in pools A (Italy, light green), B (Italy, dark green), C (Hungary, light blue) and D (Hungary, dark blue).
Fig. S2 Genomic patterns of diversity and differentiation in populations from two different central European phylogeographic lineages of P. alba. Sliding windows (size 8000 bp, step size 2000 bp) summarize results for 10–200 SNPs per window on all 19 poplar linkage groups (LG) identified by roman numerals. Beige rectangles highlight putative centromere locations (Slavov et al., 2012) on each linkage group. A Loess smoother summarizes the region-wide levels of differentiation (window size 250 kb, sliding by 100 kb). Positive allele frequency differential (AFD) outliers (≥4SD different from genome-wide expectations) are highlighted in green for the comparison of Italian vs Hungarian populations. AFD outlier windows which are also of reduced diversity (logeRH≤-4SD different from genome-wide expectations) in Italian populations are indicated in red, whereas those of reduced diversity in Hungary (logeRH≥4SD) are indicated in blue. A region of reduced pooled heterozygosity (≤ -4SD different from genome-wide
expectations) in Italy is indicated by a purple dot.
Reference
Slavov GT, DiFazio SP, Martin J, Schackwitz W, Muchero W, Rodgers-Melnick E, Lipphardt MF, Pennacchio CP, Hellsten U, Pennacchio LA et al. 2012. Genome
resequencing reveals multiscale geographic structure and extensive linkage disequilibrium in the forest tree Populus trichocarpa. New Phytologist 196: 713-725.
Methods S1 Reference-mapping and SNP detection from pool-seq WGS data
Sequences were reference mapped against P. trichocarpa reference genome v2, build 156 (www.phytozome.org) using the LifeScopeTM Genomic Analysis Software v2 (Applied Biosystems) pipeline including the following parameters: clearzone of +5, pair uniqueness threshold of 10.0 and mismatch penalty of -2. Indels were not called in the present study. Only uniquely mapping reads were retained and mappings were considered unique if the quality difference between the first and second best pair was at least ten-fold. Although a P. tremula genome assembly is currently underway (ftp://plantgenie.org/PopGenIE/UPSC_genomes/
UPSC_Draft_Assemblies/), its assembly status is currently not comparable to that of recent versions of the P. trichocarpa genome used here. Mapping against a heterologous (P.
trichocarpa) reference assembly implies a bias of our sequence data towards more conserved (e.g. gene-rich) genome regions, which effectively increased our chance to detect selective sweeps.
Subsequent to reference mapping, read alignments were formatted with Picardtools 1.79 (http://broadinstitute.github.io/picard) for further analyses by adding readgroup headers
(readgroup IDs, identifiers for the read group library, the sequencing platform, barcode identfiers and readgroup sample names). Variable sites were extracted from the alignments using
GenomeAnalysisToolKit (GATK) version 2.1.13 using the UnifiedGenotyper defaults, which include downsampling of SNP sites covered by more than 250 reads. We only accepted sites with a minimum SNP quality of 30 for which the most likely genotype call was bi-allelic. The resulting raw vcf files were filtered using VCFtools 0.1.12a to retain only biallelic SNPs covered by 8 reads in each of the four subpopulation replicates. The dataset was further quality-filtered by removing sites with a minimum read count <3 for the minor allele to avoid spurious SNP calls (Supporting Information Table S2).
Methods S2 SNP validation by Sanger sequencing
For each gene selected for SNP validation by Sanger sequencing, PCR fragment size was chosen to facilitate reliable amplification and direct sequencing. Primers were designed using Primer-Blast (www.ncbi.nlm.nih.gov/tools/primer-blast) against P. trichocarpa genome assembly v1 (www.phytozome.org). Primers were selected with a minimum distance of 50 bp from the 3’-end of the oligonucleotide to the first SNP locus, and oligonucleotides were accepted only if they contained 50% GC content. In addition, a low-self complementary at a minimum linguistic complexity of 95% had to be met. Local BLASTN- searches of oligonucleotide sequences against the P. trichocarpa version 1 genome ensured unique binding of primer pairs to the desired locus in P. trichocarpa in silico. We optimized PCR annealing temperatures for each candidate gene in vitro until agarose gels confirmed unique amplification products of the expected size. Final PCR amplifications for automated Sanger sequencing were performed in 50 μl reaction volumes containing 1xTaq reaction buffer (Bioline), 5 mM MgCl2, 5 mM dNTPs, 50 pM of each
oligonucleotide and 2.5 units of taq polymerase (Bioline) amplifying candidate loci from 50 ng of genomic DNA. The same DNA extraction products were used for both, SOLiD pool-seq and Sanger sequencing. The amplification protocol consisted of 3min initial denaturation, followed by 30 cycles of 30 s denaturation at 94°C, 1min of primer annealing (see Supporting Information Table S3) and 45 s extension at 72°C, followed by a final elongation step of 30 min at 72°C. PCR products were visualized on 2% agarose gels, and unique ExoSAP (Affymetrix)-purified PCR products were sequenced by Macrogen Europe.
Table S1 Provided in separate file: Supporting Information Tables S1,S3–S8.xls
Table S2 Provided in separate file: Supporting Information Table S2.txt
Table S3, S4, S5, S6, S7, S8: Provided in separate file: Supporting Information Tables S1,S3– S8.xls