HAL Id: hal-00317620
https://hal.archives-ouvertes.fr/hal-00317620
Submitted on 23 Sep 2004
HAL is a multi-disciplinary open access
archive for the deposit and dissemination of
sci-entific research documents, whether they are
pub-lished or not. The documents may come from
teaching and research institutions in France or
abroad, or from public or private research centers.
L’archive ouverte pluridisciplinaire HAL, est
destinée au dépôt et à la diffusion de documents
scientifiques de niveau recherche, publiés ou non,
émanant des établissements d’enseignement et de
recherche français ou étrangers, des laboratoires
publics ou privés.
bubbles
W. J. Burke, C. Y. Huang, L. C. Gentile, L. Bauer
To cite this version:
W. J. Burke, C. Y. Huang, L. C. Gentile, L. Bauer. Seasonal-longitudinal variability of equatorial
plasma bubbles. Annales Geophysicae, European Geosciences Union, 2004, 22 (9), pp.3089-3098.
�hal-00317620�
Annales Geophysicae (2004) 22: 3089–3098 SRef-ID: 1432-0576/ag/2004-22-3089 © European Geosciences Union 2004
Annales
Geophysicae
Seasonal-longitudinal variability of equatorial plasma bubbles
W. J. Burke1, C. Y. Huang2, L. C. Gentile2, and L. Bauer3
1Space Vehicles Directorate, Air Force Research Laboratory, Hanscom AFB, MA, USA 2Institute for Scientific Research, Boston College, Chestnut Hill, MA, USA
3Department of Physics, Air Force Academy, Colorado Springs, CO, USA
Received: 25 September 2003 – Revised: 7 April 2004 – Accepted: 20 April 2004 – Published: 23 September 2004 Part of Special Issue “Equatorial and low latitude aeronomy”
Abstract. We compare seasonal and longitudinal
distribu-tions of more than 8300 equatorial plasma bubbles (EPBs) observed during a full solar cycle from 1989–2000 with pre-dictions of two simple models. Both models are based on considerations of parameters that influence the linear growth rate, γRT, of the generalized Rayleigh-Taylor instability in the context of finite windows of opportunity available during the prereversal enhancement near sunset. These parameters are the strength of the equatorial magnetic field, Beq, and the angle, α, it makes with the dusk terminator line. The inde-pendence of α and Beq from the solar cycle phase justifies our comparisons.
We have sorted data acquired during more than 75 000 equatorial evening-sector passes of polar-orbiting Defense Meteorological Satellite Program (DMSP) satellites into 24 longitude and 12 one-month bins, each containing ∼250 samples. We show that: (1) in 44 out of 48 month-longitude bins EPB rates are largest within 30 days of when α=0◦; (2) unpredicted phase shifts and asymmetries appear in occur-rence rates at the two times per year when α≈0◦; (3) While EPB occurrence rates vary inversely with Beq, the relation-ships are very different in regions where Beq is increasing and decreasing with longitude. Results (2) and (3) indicate that systematic forces not considered by the two models can become important. Damping by interhemispheric winds ap-pears to be responsible for phase shifts in maximum rates of EPB occurrence from days when α=0◦. Low EPB occurrence rates found at eastern Pacific longitudes suggest that radia-tion belt electrons in the drift loss cone reduce γRT by en-hancing E-layer Pedersen conductances. Finally, we analyze an EPB event observed during a magnetic storm at a time and place where α≈ −27◦, to illustrate how electric-field pene-tration from high latitudes can overwhelm the damping ef-fects of weak gradients in Pedersen conductance near dusk.
Key words. Ionosphere (electric fields and currents;
equato-rial ionosphere; plasma waves and instabilities)
Correspondence to: W. J. Burke
1 Introduction
The post-sunset ionosphere at low magnetic latitudes is in-herently unstable, allowing plasma density irregularities to develop. The irregularities initially form in the bottom side of the F layer through the generalized Rayleigh-Taylor (R-T) instability (Ott, 1978). Severe radio signal disruptions oc-cur when the irregularities propagate into the topside iono-sphere as density depletions called equatorial plasma bub-bles (EPBs). Because of their appearance in altitude-versus-time radar displays and ionograms, EPBs are also referred to as plasma plumes (Woodman and La Hoz, 1976) and range spread F (Aarons, 1993). Strong seasonal-versus-longitudinal (S/L) variability characterizes the frequency of EPB occurrence (Aarons, 1993; Huang et al., 2001).
An understanding of EPB variability with season and lon-gitude is obtained from the linear growth rate, γ , for the generalized R-T instability and the geophysical contexts in which it is realized. Haerendel (unpublished manuscript, 1973) pointed out that the flux-tube integrated Pedersen con-ductance, 6P, rather than local conductivity near the apex of magnetic field lines threading the bottom side of the F layer controls the magnitude of γRT. Ott (1978) showed that zonal electric fields also influence the R-T growth rate. Eastward fields enhance growth, and westward fields quench it. A for-mulation derived by Sultan (1996) captures both effects:
γRT = 6PF 6PE+6PF Vp +UnP + gL νineff ! 1 Ln −RT, (1)
where gLrepresents the local acceleration due to gravity at the magnetic equator, Vpis the vertically upward component of plasma drift (E×B/B2)due to the eastward electric field (E) at the magnetic equator, and UPn is the vertically down-ward component of neutral wind velocity perpendicular to B weighted by 6P. νineffis the effective, flux-tube integrated
F-region ion-neutral collision frequency weighted by number density in the flux tube. Lnis the scale length of the vertical gradient flux-tube integrated plasma density in the F-region, measured at the equator. RT is the recombination rate inte-grated along the flux-tube (Basu, 1997). 6PEand 6PF are the
contributions to 6P from the E and F regions, respectively. For the specified directions of E, UP
n, and g, γRT can be positive only when Lnis positive. Under typical ionospheric conditions, growth periods, 1/γRT, are ∼10 min. It takes sev-eral growth periods for large-amplitude irregularities to grow. Since g and B are constants at a given location, R-T growth rates are controlled by the variability of E0, UPn, 6PE, 6
F P,
νineff, RT and through the flux-tube integrated quantities by the height of the F layer.
Basu (1997) studied the temporal dependencies of the un-stable equilibria as plasma flux tubes in the evening sector respond to altitude variations of the various force fields. East-ward electric fields in the dusk sector have two sources, leak-age of the solar quiet (Sq) current system into the nightside ionosphere (Eccles, 1998) and penetration of high-latitude electric fields into the low-latitude ionosphere (Nopper and Carovillano, 1978). The Sq source acts systematically while penetration occurs during episodes of enhanced polar cap po-tential prior to the development of shielding (Harel et al., 1981; Burke et al., 1998). Systematic vertical plasma drifts near the dusk terminator are characterized by prereversal en-hancements (Fejer et al., 1991). In the early evening local-time (LT) sector plasma initially rises due to the development of negative polarization charge near the terminator. After
∼20:00 LT the direction of the vertical plasma drift usually reverses to stabilize the bottom side of the F layer against irregularity formation. Within this simple scenario a finite window of opportunity opens after sunset for EPBs to form before damping forces dominate.
The generalized R-T instability is most likely to evolve to the nonlinear stage at longitudes where zonal gradients of
6P near the dusk meridian are strongest. Conversely, the equatorial ionosphere is more stable in the presence of a spo-radic E layer (Stephan et al., 2002) and whenever one foot of a field line remains in sunlight for a substantial period af-ter the conjugate E region enaf-ters darkness. Tsunoda (1985) argued that the steepest gradients in 6EP develop where mag-netic flux tubes closely align with the terminator. Thus, the S/L variability of EPB and severe scintillation occurrence is largely controlled by magnetic declination, δ. At longitudes where δ≈ 0◦, EPB formation is favored near the equinoxes. In regions of westward (eastward) δ the angle between flux tubes and the dusk terminator minimizes closer to the June (December) solstice. Aarons (1993) demonstrated that the general features of Tsunoda’s prescription for S/L variations were replicated in rates of range spread F occurrence ob-served at six locations distributed around the globe. How-ever, he noted that although Huancayo and Guam share sim-ilar declinations, their seasonal variations are different.
Huang et al. (2001; 2002) examined latitudinal profiles of plasma density measured during more than 75 000 orbits of Defense Meteorological Satellite Program (DMSP) satellites at 840 km in the mid-evening local time sector. On more than 8300 of these orbits a DMSP satellite encountered one or more EPBs, defined as irregular plasma depletions at low magnetic latitudes. Four results of these studies are relevant
here. First, in six longitude sectors the observed S/L distri-butions of EPBs matched those of range spread F analyzed by Aarons (1993). Second, although DMSP observed more than an order of magnitude decrease in the rate of EPB activ-ity between solar maximum and solar minimum, S/L varia-tions remained similar within given longitude sectors. Third, over the full solar cycle, the rates of EPB occurrence were significantly larger at Atlantic-African longitudes than in the Indian-Pacific sectors. Huang et al. (2001) suggested that different equatorial magnetic field strengths (Beq)in the two regions contribute to this asymmetry. Fourth, a significant number of EPBs occur when auroral electric fields penetrate to low magnetic latitudes.
Burke et al. (2003) compared a subset of EPB detections by DMSP with radar plumes and intense UHF scintillation episodes observed at Jicamarca and Ancon, Peru. Again, the seasonal variabilities of EPBs, radar plumes, and intense scintillations were similar. The combined ground and satel-lite observations also suggested that plasma bubbles tend to form in bursts of activity rather than as isolated events. De-spite the obvious limitations of using polar-orbiting satellites to monitor equatorial electrodynamics, DMSP yields a cred-ible global climatology of EPB occurrence. The DMSP EPB database offers an opportunity to perform statistical tests of proposed hypotheses on a global scale. To what degree does the declination-terminator angle, α, control the S/L variabil-ity of EPB formation as predicted by Tsunoda (1985)? Does
Beqcontrol different EPB occurrence rates found at Atlantic-Pacific longitudes as predicted by Huang et al. (2001)?
The purpose of this paper is twofold. First, we report re-sults of simple statistical tests of hypotheses suggested by Tsunoda (1985) and Huang et al. (2001) based on EPB ob-servations by DMSP satellites from 1989 to 2000. The in-variance of α and Beq over a solar cycle makes the tests possible. We find that in more than 90% of the longitude sectors the explanation of Tsunoda (1985) adequately de-scribes observed S/L morphologies. However, EPB distri-butions in the remaining longitude sectors are marked by unpredicted phase shifts and/or asymmetries. We also find that in the eastern hemisphere, where magnetic declination δ is small and the geographic location of the magnetic equa-tor λeq is nearly constant, the rate of EPB occurrence has a strong negative correlation with Beq. In much of the West-ern Hemisphere, where δ, λeq, and Beq are most variable, a significantly different correlation is found. Second, we dis-cuss some geophysical implications of intense EPB activity detected in regions of strong eastward declination during a magnetic storm in November 2001, a place and time “forbid-den” by the Tsunoda model.
Section 2 briefly describes DMSP measurement capabil-ities and our methodology for testing the two hypotheses. Section 3 compares solar-cycle averaged monthly rates of EPB encounters by DMSP with values of α and Beq appro-priate for 24 different longitude bins. We then analyze in-tense EPBs simultaneously observed by two DMSP satellites during a magnetic storm at a season/longitude when/where
W. J. Burke et al.: Seasonal-longitudinal variability of equatorial plasma bubbles 3091 may overwhelm normal S/L constraints. Section 4
summa-rizes observational results and suggests how systematic pa-rameters, in addition to α and Beq, influence EPB climatol-ogy.
2 Instrumentation
DMSP satellites are three-axis stabilized spacecraft that fly in Sun-synchronous, circular 98.7◦ inclination orbits at an altitude of ∼840 km. The geographic local times of the or-bits are either near the 1800–0600 (F8, F13) or 2100–0900 (F9, F10, F11, F12, F14, F15) local-time meridians. Begin-ning with the launch of DMSP F10, the ascending nodes of DMSP orbits were changed from the dawn to the dusk side of the Earth. Each satellite carries a suite of sensors called the Special Sensors-Ions, Electrons, and Scintillation (SSIES) to measure the densities, temperatures, and drift motions of ionospheric ions and electrons. SSIES consists of a spheri-cal Langmuir probe mounted on 0.8 m booms to measure the densities and temperatures of ambient electrons along with three separate sensors mounted on a conducting plate fac-ing in the ram direction (Rich and Hairston, 1994). These are: (1) an ion trap to measure the total ion density, (2) an ion drift meter to measure horizontal and vertical cross-track components of plasma drifts, and (3) a retarding potential analyzer. Electric field components along DMSP trajectories are inferred from horizontal ion drifts. From these we can calculate potential distributions and identify latitudinal ex-tents of penetration electric fields (Burke et al., 1998; Wilson et al., 2001).
Our criteria for identifying EPBs are described in detail by Huang et al. (2001). Briefly, we examined individual plasma density profiles acquired within ±30◦of the magnetic equa-tor during all DMSP satellite passes at local times greater than 19:30. If a DMSP satellite crossed an ion density de-crease and recovery of a factor of two or greater at low mag-netic latitudes with embedded small-scale irregularities, we attributed an EPB encounter to the particular pass. No dis-tinction was made between one and several such plasma den-sity depletions. Data presented below are of EPB occurrence rates determined from the ratio of orbits with EPBs divided by the total number of orbits in a bin.
Orbital periods of DMSP satellites of ∼104 min allow an average of 14 orbits per day. Between orbital ascending nodes, DMSP satellites regress ∼25◦in longitude. Follow-ing Huang et al. (2002), we first divide the DMSP data into 24 longitude bins, each 15◦ wide. During the course of a month a DMSP satellite revisits each longitude sector ∼18 times. To establish meaningful annual statistics and to com-pare EPB encounters with range spread F climatologies pub-lished by Aarons (1993), Huang et al. (2001, 2002) com-bined DMSP measurements into four three-month intervals. The central month of each seasonal bin contains an equinox (March, September) or a solstice (June, December). On a seasonal scale Tsunoda’s hypothesis has proven to be useful for understanding the longitudinal variability of EPBs.
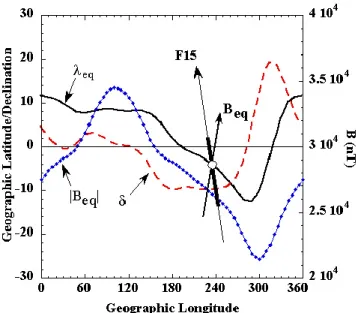
Fig. 1. The geographic latitude λeq, declination δ, and field strength
Beq at the magnetic equator plotted as a function of geographic longitude. The quantities δ and Beq come from the IGRF model for an altitude of 350 km. The open circle and intersecting lines representing the F15 trajectory and the local magnetic field Beqare used in our analysis of data acquired during the 6 November 2001 magnetic storm.
3 Observations
To test Tsunoda’s model with monthly temporal resolution we first estimate α then compare it with EPB variabilities found in the DMSP database. By definition, α=δ-ξ where
δ and ξ represent the declination and the terminator angles at the magnetic equator. As a function of Julian day, D,
ξ ≈23.5◦Sin (π (D−81.)/182.5). For reference, Fig. 1 con-tains plots of the geographic latitude of the magnetic equator
λeq(solid line), along with the declination (dashed line) and strength of the magnetic field as functions of geographic lon-gitude, φ. Values of δ and Beq are those of the International Geomagnetic Reference Field model at an altitude of 350 km. We arbitrarily assign positive values to regions of westward declination. Along the magnetic equator Beq decreases by 28% from 3.45 104nT near φ=100◦, to 2.14 104nT in the South Atlantic Anomaly (SAA) (φ= 300◦). A region of steady δ≈ − 10◦spans the longitude range 160◦< φ<260◦. At φ= 320◦, where the magnetic and geographic equato-rial planes cross, the declination sharply peaks at δ≈19.3◦. For future reference, the open circle on the λeq trace, with a DMSP F15 trajectory intersecting a magnetic field line
Beq, marks the location where DMSP satellites observed a sequence of EPBs during the 6 November 2001 magnetic storm.
3.1 Statistical perspectives
We have taken advantage of more than 75 000 DMSP passes across the evening, low-latitude ionosphere accumulated
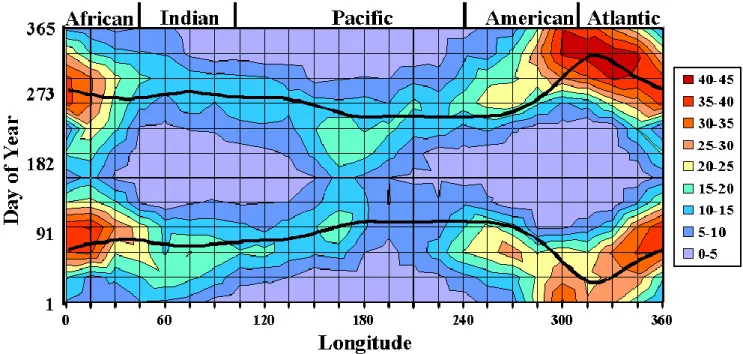
Fig. 2. Contour plot representing rate of EPB occurrence on a month-versus-longitude grid in increments of 5%. The solid lines indicate the two times per year when α=0◦within given longitude bins.
over a full solar cycle. Each month-longitude bin contains data points from more than 250 DMSP orbits. While Fig. 1 of Huang et al. (2002) demonstrates more than an order of magnitude range in rates of EPB occurrence between solar maximum and minimum, the annual variation of α at a given longitude is independent of the solar cycle. Figure 2 displays a contour plot of solar-cycle averaged rate of EPB occurrence on a month-versus-longitude grid in 5% increments. For de-scriptive convenience we divide the globe into five longitude sectors that roughly correspond to the widths of the African and American continents and the Indian, Pacific, and Atlantic oceans. The solid lines indicate the two days per year when
α=0◦as a function of geographic longitude. Consistent with previous reports, Fig. 2 shows different morphologies both between and within the five sectors. The highest and low-est rates of EPB detection occurred in the Atlantic-African and Indian-Pacific sectors, respectively. The contours show broad trends, but no simple temporal or longitude patterns emerge. Figure 3 provides 24 vertical cuts through data sum-marized in Fig. 2.
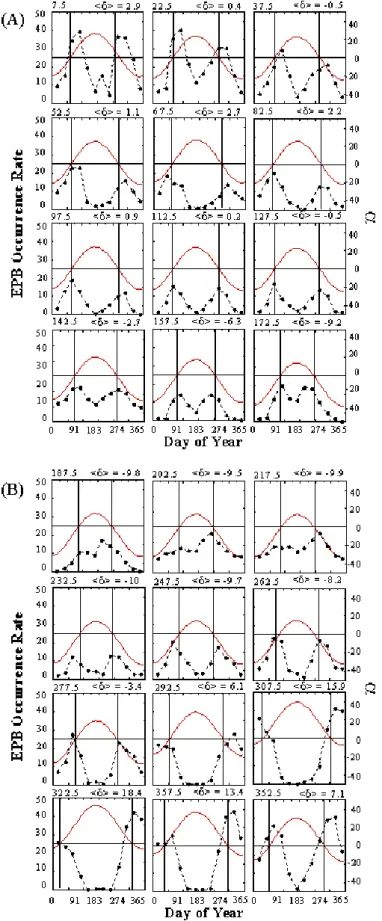
Figures 3a and 3b plot alignment angles α (solid line) and rate of EPB occurrence (dashed line) as functions of the day of year for the 24 longitude sectors of the Eastern and West-ern Hemispheres, respectively. The top of each panel dis-plays the central longitude and average declination < δ> within the bin. Values of <δ> were used to calculate values of α within the individual longitude bins. EPB occurrence rates are assigned to the middle days of the various months. Solid vertical lines superposed on the plots indicate the two days of each year when α=0◦within the different longitude bins.
Looking first at Fig. 3a we see that across the entire East-ern hemisphere the occurrence of EPBs is very low dur-ing January and December. The occurrence rate has a sec-ondary minimum near the June solstice. Across the longi-tude sector 0◦<φ<135◦the maximum occurrence observed in March-April exceeds that near the September equinox. In the 135◦<φ<180◦ sector, spring and fall occurrence rates are similar. The spring/fall asymmetry reverses sign in the 180◦<φ<225◦sector. While all maximum occurrence rates are found near the α= 0◦lines, in many sectors they are dis-placed by about a month. As noted by Huang et al. (2001), EPB occurrence rates decrease toward the Indian Ocean -eastern Pacific sectors (60◦< φ<150◦), where B
eq increases with longitude.
Figure 3b shows similar asymmetries in the distribution of EPB occurrence and about a month phase shift in maximum rates of EPB occurrence from the α=0◦lines. The most dis-tinctive features of the Western Hemisphere data are the deep minima in occurrence rates between May and August in the 270◦<φ<345◦sector. Within this longitude sector rates of EPB detections remained high during December and January. We note that EPB occurrence rates in Figs. 3a and 3b show significant asymmetries between maximum occurrence rates, %max, observed in the first and second halves of the year.
The Tsunoda model does not predict such asymmetries. Al-though some EPB asymmetries tend to cluster in longitude in the first rather than the second half of the year, we are unable to identify any dependence on λeqor δ.
We suggest a semi-quantitative method for assessing sta-tistical agreement between observations and the Tsunoda model by comparing the months in which DMSP satellites detected %maxwith the two times per year when α=0◦within
W. J. Burke et al.: Seasonal-longitudinal variability of equatorial plasma bubbles 3093
Fig. 3. Values of α and measured rates of EPB occurrence plotted as functions of day of the year. Vertical lines indicate days when α=0◦. Central longitudes and average declinations are noted at the top of each panel. Segment A (B) summarizes data acquired in the 0◦to 180◦ (180◦to 360◦)longitude range.
Fig. 4. DMSP measurements compared with predictions of Huang et al. (2001). Plotted as functions of geographic longitude are the IGRF values of Beq at 840 km (top panel) and maximum (%max)
and average (<%>) EPB occurrence rates (bottom panel). Circles and triangles represent values of % max and <%>, respectively.
each longitude bin. DMSP data were sorted by month with occurrence rates “assigned” to the middle day of each month Dj(φi). Here the subscripts j and i refer to the jt hmonth and the it h longitude bin. Corresponding days on which α=0◦ are noted as dj(φi). We next define 1j i=dj(φi)-Dj(φi)as the difference between the predicted and “assigned” dates for %max. Positive 1j i values indicate that DMSP observed maxima after a day when the dusk terminator entered align-ment with the equatorial magnetic field. Within the con-straints of our database, predictions of the Tsunoda model are considered fully accurate if −15 ≤1j i≤15 days. For the 48 intervals when α≈0◦, 1=−6.7± 24.7 days. The negative value of 6.7 days comes primarily from EPBs observed dur-ing July and August in the mid-Pacific. Eighteen of the max-ima occurred within two weeks and 44 out of 48 occurred within a month of the days predicted by the Tsunoda model. Fig. 3a shows that model predictions are most accurate in the Indian to western Pacific sector. The largest deviations occur at central Pacific (150◦–195◦)and South American (285◦– 300◦)longitudes.
Data plotted in Figs. 4 and 5 allow us to test the suggestion of Huang et al. (2001) that EPBs are most likely to develop at longitudes where Beqis weakest. Figure 4 displays Beqat DMSP altitude (top panel) and two representations of EPB occurrence rates (bottom panel) as functions of geographic longitude. The bottom panel represents maximum (%max)
and average (<%>) EPB occurrence rates as circles and tri-angles, respectively. As noted above, Beq is strongest near 100◦and weakest near 300◦longitude. If the conjecture of Huang et al. (2001) were exactly correct, DMSP should have
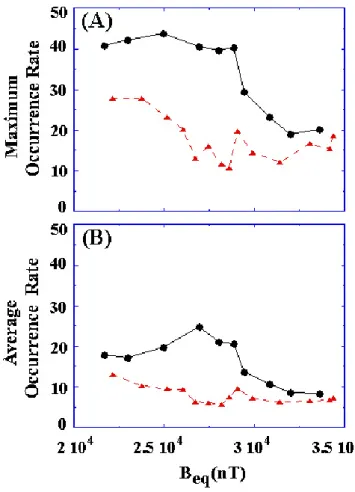
Fig. 5. Values of %maxand <%> plotted as functions of Beq in regions of positive (circles) and negative dBeq/dφ.
detected a maximum occurrence rate near 300◦and a mini-mum near 100◦. Data plotted in the bottom panel of Fig. 4 show the expected general trend with a maximum occurrence rate in the Atlantic longitude sector and minimum in the Pa-cific. However, the extrema are displaced from longitudes of maximum and minimum Beq, and their shapes are asym-metric. Of particular interest for discussion in Sect. 4 is the positive gradient in %maxand <%> observed at longitudes
between 240◦and 300◦.
Figures 5a and 5b plot %max and <%> as functions of Beq. We divided both data sets into two groups representing occurrence rates measured at longitudes (φ), where dBeq/dφ was positive (circles) or negative (triangles). Attention is directed to two empirical facts about the behavior of %max
and <%>. First, consistent with the conjecture of Huang et al. (2001), both quantities tend to decrease with increasing
Beq, but not in the same way. Second, both occurrence pa-rameters were higher at longitudes where dBeq/dφ>0. The second observation strongly indicates that systematic effects not considered by Huang and coworkers produce signifi-cantly fewer EPBs in the eastern Pacific longitude sector.
W. J. Burke et al.: Seasonal-longitudinal variability of equatorial plasma bubbles 3095 3.2 Magnetic storm of 6 November 2001
This subsection concerns detection of deep plasma deple-tions during the maximum epoch of a severe geomagnetic storm on 6 November 2001. The example is relevant to our comparison of DMSP observations with predictions of the Tsunoda model because these were the only EPBs detected during this storm in a region of eastward declination when
α=27◦. The storm occurred 73 days after local flux tubes were best aligned with the dusk terminator. We also relate the storm time observations to the DMSP statistical database. Figure 1 of Mishin et al. (2003) summarizes interplanetary drivers and geomagnetic responses for the 6 November 2001 magnetic storm. Early in the day the Advanced Composition Explorer (ACE) satellite observed a shock propagating to-ward Earth. The IMF magnitude rapidly increased from ∼20 to 80 nT, dominated by its southward component. Solar wind plasma measurements from the ACE and Wind satellites are unavailable for most of the day. A sudden storm commence-ment (SSC) impulse at 01:50 UT was followed by a rapid (∼2 h) decrease in the SYMH index to −300 nT. SYMH is a measure of the symmetric ring current equivalent to Dst, but is calculated at one minute rather than one hour intervals. It remained below −275 nT until ∼08:00 UT when a sustained recovery began. The period of present interest extends to 06:00 UT during the storm’s maximum epoch.
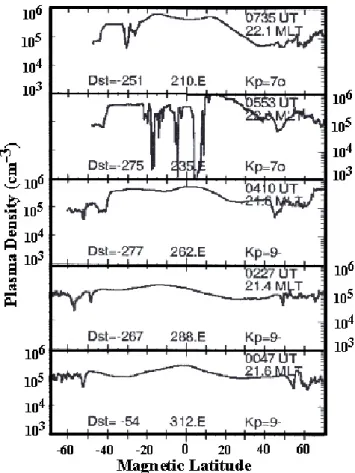
Figure 6 shows plasma densities measured by the F15 satellite in the evening local-time sector during the first eight hours of 6 November 2001, plotted as functions of magnetic latitude. Plot ordinates range from 103to 106cm−3. Indi-cated in the upper right corner of each panel are the universal (UT) and magnetic local times (MLT) of magnetic equatorial crossings. In the figure UT progresses from the bottom to the top panel. Current values of the Dst and Kpindices, as well as the geographic east longitude of the ascending node, ap-pear at the bottom of each plot. The orbit moves ∼25◦ west-ward in longitude between nodal crossings. Similar density profiles at low (± 30◦)magnetic latitude, found in the bot-tom two plots, were acquired about an hour before and a half hour after the SSC, respectively. Even prior to onset the level of geomagnetic activity was elevated with AE ≈ 1000 nT (cf. Fig. 1 of Mishin et al. (2003)). By the time of the 04:10 UT crossing the equatorial plasma density had risen from 2 to 5×105cm−3, indicating that the topside ionosphere had been uplifted by an eastward electric field. Ionospheric uplift is even more evident in densities measured at the dusk termina-tor by DMSP F13 (not shown).
The 05:53 UT density plot in Figure 6 is marked by a se-quence of deep plasma depletions that extend from approxi-mately −20◦to +10◦in magnetic latitude. In this interval the spacecraft moved westward in longitude from 239◦to 233◦. Figure 1 illustrates the geometry of the F15 trajectory, the region of EPB activity (heavy line), and the eastward decli-nation of the local magnetic field, Beq. When F15 returned to the magnetic equator near 210◦at 07:35 UT (top panel), EPB disturbances were absent. Quiescent plasma charac-terized measurements acquired during the remainder of the
Fig. 6. Plasma densities measured during five consecutive evening sector passes of DMSP F15 before and during the main phase of the 6 November 2001 magnetic storm and plotted as functions of mag-netic latitude. Data progress in universal time from bottom to top. Notation within the panels includes the universal (UT) and mag-netic local times (MLT) of magmag-netic equatorial crossings, values of
Dst and Kp, as well as the geographic longitude of the ascending node.
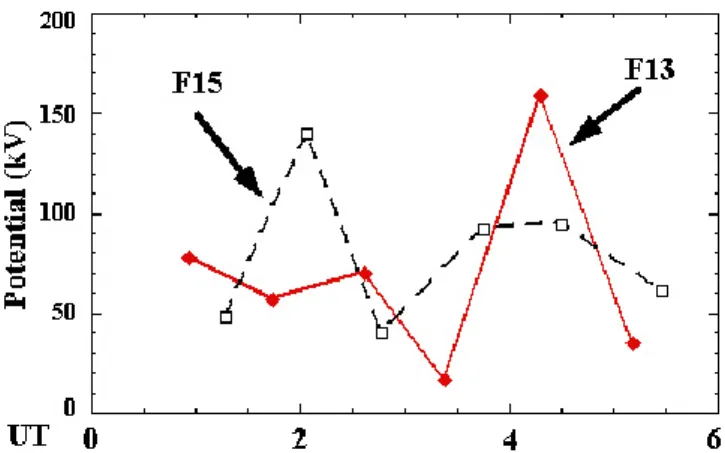
day. DMSP F14 observed a similar sequence of plasma de-pletions, but earlier than F15 by about an hour in MLT and 45 min in UT. These plasma depletions also appeared at low magnetic latitude in the 236◦–231◦ longitude range. The similarity of F14 and F15 morphologies suggests a signifi-cant overlap in observed phenomena, that is, the two space-craft sampled the same set of plasma disturbances. An iso-lated burst of EPB activity is consistent with previously re-ported radar/satellite results (Burke et al., 2003). Figure 7 suggests one possible cause of this EPB burst by showing po-lar cap potentials, 8P C, measured by the F13 and F15 satel-lites. Recall that F13 and F15 fly near the 18:00 and 21:30 LT meridians where they sample some fraction of the full poten-tial drop. The upper envelope of combined spacecraft mea-surements represents a best estimate of 8P C. Measured 8P C rose from ∼80 to 140 kV at the time of the SSC, then de-creased and recovered to ∼160 kV shortly after 04:00 UT. The universal times of F14 and F15 magnetic-equator cross-ings in which EPBs were detected are indicated at the bot-tom of the figure. EPB detections soon after the spike in
Fig. 7. Polar cap potentials measured by the DMSP F13 (solid line) and F15 (dashed line) satellites during the first six hours of 6 November 2001.
8P C suggest that penetration electric fields were responsi-ble for their sudden appearance. A survey of availaresponsi-ble ion drift meter measurements from all DMSP satellites confirms the presence of electric-field penetration to low magnetic lat-itudes from storm onset until 05:30 UT. They were absent prior to the SSC and after 06:00 UT.
The locations of EPBs detected by DMSP F14 and F15 place them in the longitude bin centered at 232.5◦. Data plot-ted in the appropriate panel of Fig. 3b indicate that observing EPBs in November is rare at this longitude, but not without precedent. The DMSP historical database from 1989 through 2002 shows a total of seven EPB detections in November dur-ing 333 orbits, a rate of ∼2%. A feature common to all these EPB events is that they occurred during periods of elevated geomagnetic activity when ion drift meters on DMSP indi-cated electric field penetration to low magnetic latitudes.
4 Discussion
The previous section summarized latitudinal plasma density profiles observed in the evening local-time sector orbit by DMSP satellites over a full solar cycle. Rates of EPB occur-rence were sorted into 24 longitude and 12 monthly bins and compared with predictions of Tsunoda (1985) for S/L vari-ability of severe scintillations. In its simplest form the Tsun-oda model suggests that the rate of EPB encounters should maximize at times when α, the angle between the dusk termi-nator and local magnetic flux tubes, is small. Data presented in Figs. 2 and 3 indicate that while many of the model’s predictions are verified in DMSP measurements, two unpre-dicted features are evident. The first is a phase shift in times of maximum occurrence. Approximately 50% of maximum EPB rates fell outside of the ±15-day window imposed by our sorting procedure. The second feature relates to asym-metric distributions of EPB rates observed near the times of the first and second annual periods with α≈0◦. While the fol-lowing discussion concentrates on the significance of unpre-dicted features, it should not obscure the wide and substantial
agreement found between the Tsunoda model and observa-tions.
The form of the linear growth rate for the generalized R-T instability, as encapsulated in Equation (1), is deceptively simple in appearance when applied to the detection of EPBs. It includes terms related to flux-tube integrated conductances (6PE and 6PF), electric field patterns at low latitudes (Vp), neutral wind structures (UPn), and, implicitly, the height of the bottom side of the F layer (νineff and RT). These param-eters are subject to random and systematic changes. The Tsunoda model addresses effects of systematic variations in Pedersen conductance and Sq-generated electric fields in the dusk sector. Random events, such as sporadic E layers (Whitehead, 1970; Stephan et al., 2002) and gravity waves (McClure et al., 1998; Singh et al., 1997), act to suppress and stimulate EPB formation, respectively. The magnetic storm of 6 November 2001 illustrates two related random aspects of EPB formation. Obviously, the intense polar cap potential spike near 04:00 UT and consequent electric field penetra-tion to low latitudes altered the local-time profile of verti-cal plasma drift VP from its normal rise-fall pattern. Less obvious is the fact that ionospheric plasma corotating into the evening sector (as observed by F13) had been rising in altitude due to electric field penetration to low latitudes for several hours prior to the detection of EPBs. A persistently rising F layer increases γRT through its cumulative affects on
6P, νineff, and RT.
Given the very large DMSP database, random events can-not explain systematic variations in phase and symmetry from predictions of the Tsunoda model. Providing a full ex-planation of these deviations from model predictions greatly exceeds the scope of this observational report. However, the role of interhemispheric winds in suppressing EPB activity has been discussed in the literature (Mendillo et al., 1992; Kil and Heelis, 1998) and can easily be compared with data shown in Fig. 3. Trans-equatorial winds flow from the sum-mer toward the winter hemisphere. This suggests that γRT should be systematically lower while summer conditions pre-vail in the other hemisphere. This can be illustrated by a sim-ple examsim-ple. Consider a location where the magnetic equa-tor lies north of the geographic equaequa-tor and δ=0◦. Here α=0◦ near the two equinoxes. Interhemispheric winds act to sup-press EPB formation prior to the 21 March and after the 21 September equinox. The highest rates of EPB occurrence should appear in April and August-September. Data from the longitude bins between 22.5◦and 52.5◦, where these condi-tions are met, show the predicted phase-shift direccondi-tions.
Our final comments concern the expected inverse relation-ship between EPB occurrence rates and Beq (Huang et al., 2001). The concept is simple. The R-T growth rate is directly proportional to VP. Whether imposed through the Sq (Ec-cles, 1998) or high-latitude (Nopper and Carovillano, 1978) current systems, for the same electric field faster growth rates should occur where Beq is weaker. DMSP measurements presented in Figures 4 and 5 show that the predicted trends do appear in %max and <%> distributions. Totally
W. J. Burke et al.: Seasonal-longitudinal variability of equatorial plasma bubbles 3097 are characterized by the sign of dBeq/dφ. Both branches
con-verge toward similar values at longitudes of high Beq. How-ever, occurrence rates in regions of low Beq are very differ-ent, with more EPBs at longitudes where dBeq/dφ> 0. Is this a statistical fluke? If not, what are its consequences for understanding how γRT is realized in nature?
To answer the first question we direct attention to the bot-tom panel of Figure 4. The plotted data show that between longitude bins centered at 292.5◦and 307.5◦%maxincreased
from 28% to 41%. Recent ground measurements suggest that this sharp eastward gradient is real. Valladares et al. (2004) have reported initial results from a network of Global Po-sitioning System (GPS) receivers deployed along a line of nearly constant longitude (∼290◦)extending from Bogot´a, Colombia to Antuco, Chile. The GPS receivers monitor scin-tillations of L-band signals propagating from many direc-tions. Two observational results are relevant. First, scintil-lation events observed by off-equatorial GPS receivers cor-respond to occurrences of radar plumes observed by the Ji-camarca Unattended Long-term Studies of the Ionosphere and Atmosphere (JULIA) radar located at the same longi-tude near the magnetic equator (Hysell and Burcham, 1998). Radar plumes and EPBs are two manifestations of the same entity (Tsunoda et al., 1982). Consistent with DMSP results, the GPS receivers detect scintillations at much higher rates when looking to the east than to the west (Valladares et al., 2004).
Implicit to the conjecture of Huang and coworkers is an as-sumption that eastward electric fields in the equatorial iono-sphere should be independent of longitude if ionospheric conductance gradients near the dusk terminator are simi-lar. We considered %max to be the appropriate parameter
for comparison because it was measured when α≈ 0. Un-der these circumstances ionization profiles produced by so-lar illuminations should be simiso-lar. With simiso-lar conductance gradients, polarization electric fields required for Sq current continuity should also be similar (Eccles, 1998). The sur-prising eastward gradient in %maxon the western side of the
minimum in Beqindicates that the assumption is flawed. The 6PE term in Equation (1) is the likely source of er-ror. Stephan et al. (2002) showed that enhanced 6PE due to the formation of sporadic E layers, could decrease γRT by a factor of two. We suggest that electron precipitation from the inner radiation belt also provides a systematic source of enhanced conductance at western Pacific longitudes.
Luhmann and Vampola (1977) pointed out that trapped radiation belt electrons are subject to pitch angle scattering through wave-particle interactions as they gradient-curvature drift to the east. Between −60◦and 100◦longitude the mag-netic field strength above the ionosphere increases and the atmospheric loss cone for energetic electrons narrows, push-ing mirror altitudes higher. Further to the east decreaspush-ing Beq opens the atmospheric loss cone and lowers the mirror alti-tude. The widest loss cones for electrons develop near the west coast of South America. For westward drifting protons the largest loss cone is found near the east coast of South
America. Energetic particles deposited in the upper atmo-sphere near the SAA are referred to as being in the drift loss cone. Since electrons are more efficient creators of ioniza-tion than protons the larger effects on 6PE should occur near the west coast of South America.
Electrons in the drift loss cone have two effects on the value of γRT. First, any increase in 6PE decreases γRT (Stephan et al., 2002). Second, longitudinal gradients in 6P at sunset should be less severe in the western Pacific than elsewhere and require weaker polarization electric fields to maintain current continuity across the dusk terminator (Ec-cles, 1998). Weaker electric fields compensate for the effect on γRT of decreasing Beq.
Acknowledgements. The authors thank F. J. Rich of AFRL and J. M. Campbell of Boston College for their generosity in mak-ing DMSP plasma data available. This work was supported under Air Force Office of Scientific Research task 2311SDA1, Air Force contract F19628-02-C-0012 with Boston College, and the National Polar-orbiting Operational Environmental Satellite System Internal Government Studies Program.
Topical Editor M. Lester thanks two referees for their help in evaluating this paper.
References
Aarons, J.: The longitudinal morphology of equatorial F layer ir-regularities relevant to their occurrence, Space Sci. Rev., 63, 209, 1993.
Basu, B.: Generalized Rayleigh-Taylor instability in the presence of time-dependent equilibrium, J. Geophys. Res., 102, 17 305, 1997.
Burke, W. J., Maynard, N. C., Hagan, M. P., Wolf, R. A., Wilson, G. R., Gentile, L. C., Gussenhoven, M. S., Huang, C. Y., Garner, T. W., and Rich, F. J.: Electrodynamics of the inner magnetosphere observed in the dusk sector by CRRES and DMSP during the magnetic storm of June 4–6, 1991, J. Geophys. Res., 103, 29 399, 1998.
Burke, W. J., Huang, C. Y., Valladares, C. E., Machuzak, J. S., Gentile, L. C., and Sultan, P. J.: Multipoint observations of equatorial plasma bubbles, J. Geophys. Res., 108, (A5), 1221, doi:1029/2002JA009382, 2003.
Eccles, J. V.: A simple model of low-latitude electric fields, J. Geo-phys. Res., 103, 26 699, 1998.
Fejer, B. G., de Paula, E. R., Gonzalez, S. A., and Woodman, R. F.: Average vertical and horizontal drifts at Jicamarca, J. Geophys. Res., 96, 13 901, 1991.
Harel, M., Wolf, R. A., Spiro, R. W., Reiff, P. H., Chen, C. K., Burke, W. J., Rich, F. J., and Smiddy, M.: Quantitative simula-tion of a magnetospheric substorm, 2. Comparison with observa-tions, J. Geophys. Res., 86, 2242, 1981.
Huang, C. Y., Burke, W. J., Machuzak, J. S., Gentile, L. C., and Sultan, P. J.: DMSP observations of equatorial plasma bubbles in the topside ionosphere near solar maximum, J. Geophys. Res., 106, 8131, 2001.
Huang, C. Y., Burke, W. J., Machuzak, J. S., Gentile, L. C., and Sul-tan, P. J.: Equatorial plasma bubbles observed by DMSP satel-lites during a full solar cycle: Toward a global climatology, J. Geophys. Res., 107(A12), 1434, doi:1029/2002JA009452, 2002.
Hysell, D. L. and Burcham, J. D.: JULIA radar studies of equatorial spread F, J. Geophys. Res., 103, 20 007, 1998.
Kil, H. and Heelis, R. A.: Global distribution of density irregular-ities in the equatorial ionosphere, J. Geophys. Res., 103, 407, 1998.
Luhmann, J. G. and Vampola, A. L.: Effects of localized sources on quiet time plasmasphere electron precipitation, J. Geophys. Res., 82, 2671, 1977.
McClure, J. P., Singh, S., Bamgboye, D. K., Johnson, F. S., and Kil, H.: Occurrence of equatorial F region irregularities: Evidence for tropospheric seeding, J. Geophys. Res., 103, 29 119, 1998. Mendillo, M., Baumgardner, J., Pi, X., and Sultan, P. J.: Onset
conditions for equatorial spread F, J. Geophys. Res., 97, 13 865, 1992.
Mishin, E. V., Burke, W. J., Huang, C. Y., and Rich, F. J.: Electro-magnetic wave structures within subauroral polarization streams, J. Geophys. Res., 107(A8), 1309, doi:1029/2002JA009793, 2003.
Nopper, R. W. and Carovillano, R. L.: Polar-equatorial coupling during magnetically active periods, Geophys. Res. Lett., 5, 699, 1978.
Ott, E.: Theory of Rayleigh-Taylor bubbles in the equatorial iono-sphere, J. Geophys. Res., 83, 2066, 1978.
Rich, F. J. and Hairston, M.: Large-scale convection patterns ob-served by DMSP, J. Geophys. Res., 99, 3827, 1994.
Singh, S., Johnson, F. S., and Power, R. A.: Gravity wave seeding of equatorial plasma bubbles, J. Geophys. Res., 102, 7399, 1997. Stephan, A. W., Colerico, M., Mendillo, M., Reinisch, B. W., and Anderson, D.: Suppression of equatorial spread F by sporadic E, J. Geophys. Res., 107 (A2) 10.1029/2001JA000162, 2002. Sultan, P. J.: Linear theory and modeling of the Rayleigh-Taylor
in-stability leading to the occurrence of equatorial spread F, J. Geo-phys. Res., 101, 26 875, 1996.
Tsunoda, R. T.: Control of the seasonal and longitudinal occurrence of equatorial scintillations by the longitudinal gradient in the in-tegrated E-region Pedersen conductivity, J. Geophys. Res., 90, 447, 1985.
Tsunoda, R. T., Livingston, R. C., McClure, J. P., and Hanson, W. B.: Equatorial plasma bubbles: Vertically elongated wedges from the bottomside F layer, J. Geophys. Res., 87, 9171, 1982. Valladares, C. E., Sheehan, R., and Villalobos, J.: A latitudinal
network of GPS receivers dedicated to the study of equatorial spread-F, Radio Sci., in press, 2004.
Whitehead, J. D.:, Report on the production and prediction of spo-radic E, Rev. Geophys., 8, 65, 1970.
Wilson, G. R., Burke, W. J., Maynard, N. C., Huang, C. Y., and Singer, H. J.: Global electrodynamics observed during the initial and main phases of the July 1991 magnetic storm, J. Geophys. Res., 106, 106, 24 517, 2001.
Woodman, R. F. and LaHoz, C.: Radar observations of F region equatorial irregularities, J. Geophys. Res., 81, 5447, 1976.