Guide for Reduction of Vulnerability in WASH systems
CONCEPTUAL FRAMEWORK
AND INSTRUMENTS
The original version of this document was published by the regulatory body for the water sector, the Instituto Nicaraguense de Acueductos y Alcantarillados (Nicaraguan Institute of Aqueducts and Sewerage) INAA, with the technical and financial support of the Swiss Agency for Development and Cooperation, SDC.
The document was updated and a second version published in 2013 by the Swiss Cooperation Office in Central America.
The English version was published in June, 2015.
INAA Technical Team: Ing. Julio Solís
Ing. Mario Caldera Ing. Benita Ramirez SDC Technical Team:
Ing. Miriam Downs – Humanitarian Aid Program Ing. Carmen Pong – Water and Sanitation Program Ing. José Toruño - Water and Sanitation Program Lic. Yaoska Cantón - Specialist of Communication
Consultant to the Nicaraguan Water and Sanitation Network, RASNIC:
Ing. Silvia Martínez Design and lay-out:
Lenin Lanzas, David Guardado
First edition: June 2011 Second edition: 2013
Third edition (English version): June 2015
This document may be partially or fully reproduced provided that the source and credits are cited.
C O N T E N T S
Presentation . . . 4
Foreword . . . 5
Conceptual framework for risk management. . . 8
Risk assessment methodology . . . 10
Risk management in the project cycle . . . 19
Risk assessment instruments . . . 24
Presentation
Swiss Cooperation has been working in Nicaragua for over 35 years, supporting the country to reduce poverty and promote equitable development. The Swiss Cooperation Strategy 2013-2017 focuses on economic development, governance and climate change.
For 14 years, the Disaster Risk Reduction Program has strengthened the capacities of municipal staff, decision makers, teachers, leaders and community leaders in risk management. Together with partners -universities, local governments, communities, national institutions and NGOs – the Program has accumulated experience and knowledge through the creation, promotion and application of technical tools that stimulate the application of disaster risk reduction (DRR) measures and promote climate change adaptation (CCA) in vulnerable areas.
These technical tools are used in Central America, especially in Honduras and Nicaragua, by institutional staff, local governments, teachers and students of universities and schools, as well as civil society and private entities, at both national sector and territorial levels.
In order to strengthen the exchange of experiences, knowledge management, and dissemination of good practices in DRR and CCA, the Swiss Cooperation in Central America decided to update these technical tools, and distribute them again
With this publication, the Swiss Cooperation makes available to the public interested in the national systems for disaster reduction, municipalities and academia, the knowledge generated in conjunction with partners, thus contributing to implementation of the priorities set in the Hyogo Framework, in particular priority 3 with its focus on knowledge management and dissemination, innovation and education in order to build a culture of safety and resilience at all levels.
5
Foreword
Nicaragua is highly vulnerable to disasters in comparison with other Central American countries. It ranks third1 among the ten countries in
the world that are most affected by extreme weather events that cause damages and losses in human lives, in natural resources and in the livelihoods of he population. It is also the Central American nation that will suffer the greatest decline in precipitation over the next three decades, a decline that will affect both the water sector and food security. Nicaragua’s geographic and tectonic position leaves it more exposed to geological natural phenomena, such as earthquakes, volcanic eruptions, landslides and tidal waves or tsunamis and to meteorological natural phenomena such as hurricanes, floods and droughts. Due to the country’s economic and social vulnerability, these phenoma become more dangerous and frequently turn into disasters.
These disasters have taken a high toll in human lives and material losses. According to calculations by the Economic Commission for Latin America and the Caribbean, ECLAC, during the past 20 years, Nicaragua has been affected in a recurring fashion by more than 180 events, and 75% of these were of hydro-meteorological origin (droughts, hurricanes, etc.). These events caused damage and losses of more than 4 billion USD between 1972 and 2000, the equivalent of 2% of the annual GDP. Hurricane Mitch alone caused losses estimated at 11.5 million USD in the water and sanitation sector in Nicaragua and left more than 1.5 million persons without service.
Disasters interrupt sustainable community development, frequently destroying decades of investment in infrastructure, and worsening social and economic inequality. As a result, water and sanitation systems are exposed to ever higher levels of risk, and with each new disaster more systems suffer damage and the replacement costs increase. This is primarily because the designs do not take into account the level of exposure and fragility in the face of hazards, and the risks that can be generated during implementation and operation.
In spite of this, the sector must continue growing and provide access to those populations that do not yet have water and sanitation services. However, the communities that must be provided with services are often located in the marginal zones of cities or in rural areas. These locations frequently coincide with greater exposure to natural and social hazards and, therefore, with greater vulnerability for the systems to be built. Even those systems that operate in geographic areas with a low probability of occurrence of natural phenomena such as hurricanes, earthquakes, flooding, etc., need to be strengthened with actions to prevent risks associated with accidents, breakage, etc., that can contaminate the water and affect service.
Given that it is difficult to relocate the population, the systems that are installed to provide service in these zones must incorporate appropriate criteria for confronting or mitigating the risks to which they are exposed. This will help ensure that the investment made leads to the anticipated improvement in the health conditions and quality of life for those communities that present the greatest inequities in access to basic services and health. For these communities the path to achieving the Millennium Development Goals requires greater efforts than those currently undertaken.
Risk management must be oriented not only toward the protection of water and sanitation infrastructure, but also toward minimizing potential risks to the intended beneficiary population caused by incorrect planning or system malfunction. Therefore, risk management must be part of integral project planning for water supply and sanitation systems, and include protection measures for recharge areas and the watershed, in order to ensure a sustainable service.
In 2000 the Nicaraguan Institute of Aqueducts and Sewerage (INAA), the regulatory body for the water and sanitation sector, published the “Technical Guide for Vulnerability Reduction in Drinking Water Supply and Sewer Systems". This guide provided a general conceptual framework. In 2008, with the support of the Swiss Agency for Development and Cooperation (SDC), INAA together with the Water and Sanitation Network of Nicaragua (RASNIC), and National Water and Sanitation Company (ENACAL) began the process of reviewing and updating the guidelines with an integrated, multidisciplinary and multisectoral approach. Concrete risk assessment instruments were
Foreword
7
incorporated for both existing water projects and those in the stages of formulation, design, and construction. This process culminated in June 2011 with a series of workshops for validation and feedback in Nicaragua and Honduras. The workshops were designed for professional and technical staff from the sector institutions, INAA, the Autonomous Aqueduct and Sewerage System of Honduras (SANAA), the Emergency Social Investment Fund of Nicaragua (FISE), the Social Investment Fund of Honduras (FISH); from NGOs that implement water and sanitation projects, such as CARE and Save the Children; and from municipal governments.
This document presents an extract from the “Technical Guide for Vulnerability Reduction in Drinking Water and Sewer Systems" and focuses primarily on the conceptual framework and tools for risk assessment and analysis and adaptation to climate change. The assessment tools integrated in the project cycle for water and sanitation investment projects make it possible to identify and assess the level of vulnerability of water systems to natural and anthropogenic hazards, including those related to climate change, and to propose protection and adaptation measures.
The purpose of this publication is to promote the application and incorporation of these risk assessment instruments in all the phases of the project cycle, so as to build in greater resilience and ensure sustainability.
Conceptual
framework for risk
management
9
Conceptual framework for risk
management
In recent years, the focus and conceptual framework that informs the topic of hazards, vulnerabilities, risks and disasters has been evolving from the classic focus on emergency response towards a integral focus on risk management and disaster reduction.
The integral risk management focus highlights and promotes the link between risks and development as a tool to enhance the safety and augment the sustainability of development processes.
This focus proposes that the problem lies not in the disasters in themelves, and that disasters are only the effect of the conditions of risk present in our countries. It further maintains that the risk is the result of a dynamic, continuous process that is constructed parallel to the development processes, as a consequence of not taking into consideration territorial constraints or not thinking through the territorial impact of different actions and measures, such as projects, policies, etc. Risk management is oriented to the transformation of pre-existing conditions of risk for the purpose of progressively reducing the occurrence of future disasters. The existence of conditions of risk is determined by the threat of occurrence of a hazardous phenomenon, be it of natural or human origin, and by the existence of conditions of vulnerability. Therefore, it is important to characterise and fathom the hazards and also to identify, analyse and understand the conditions of vulnerability in order to eliminate and reduce the probability of a disaster occurring. An unidentified, unknown, unmanaged or inadequately addressed risk aids or facilitates the occurrence of disasters.
Risk management is also a decision-making and planning process, based on knowledge of existing risks, that allows stakeholders to analyse their environment, make informed decisions and develop consensual proposals to prevent, mitigate or reduce existing risks. Risk management makes it possible to engage in a process of sustainable development that is ensured by enhanced safety conditions.
Risk analysis and assessment
methodology
Risk analysis begins with an analysis of hazard(s) and an analysis of vulnerability.
Risk: Hazard x Vulnerability
The recommended methodology centers risk analysis on three basic steps:
1. Hazard assessment: This assessment is carried out through
inventories and the identification of existing dangerous phenomena. The assessment is constructed through a participatory process with water sector and municipal technical staff, community leaders and local inhabitants. It entails field observations and measurement, and analysis and review of available scientific information (maps, aerial photographs, reports, etc.) in order to identify the probable location and severity of hazardous natural phenomena, as well as the probability of their occurring within a specific time and space. The analysis should take into account the issues of climate change and variability. Its output is the formulation of a hazards map. This map is an essential input in the early stages of the planning process for the assessment of current and potential risks for water systems. A detailed risk assessment should be conducted during the feasibility phase to that for specialized technical staff identify the specific hazards for each component of the water system.
2. Vulnerability assessment:This is a process to determine the level of
exposure, the physical, social, economic and envrionmental fragility, and the predisposition to damage and losses from a specific hazard. It consists of the identification and evaluation of the existing vulnerable elements (human, financial, technical, and other) and vulnerability factors for the water and sanitation system and the community. It also includes the identification and assessment of the capacities of institutions, communities and local organizations to prevent, reduce and manage the risk for their water systems.
Conceptual framework for risk management
11
3. Risk assessment:To assess the risk is to relate the hazards and the
vulnerabilities in order to determine the social, economic and environmental consequences of a given event on the water and sanitation system.
The assessment also includes the combination of actions and procedures for identifying hazards and analysis of the vulnerability of the community, in order to assess the risks (probability of damage, loss of human life and infrastructure) and, in function thereof, to recommend preventative measures (structural and non-structural) and/or mitigation measures to reduce the effects of disasters.
Hazard assessment
The main objective of a hazard assessment is to predict or forecast the behavior of potentially damaging natural phenomena, or at least to have an idea of the probability of said phenomena occurring at different magnitudes. The hazard assessment has the following four phases:
Vulnerability
■Exposure of the water and
sanitation system components to hazards
■The system’s operational capacity ■Capacity of local committee for
system administration
Risk
To the water and sanitation system components and their setting. Probability of total or partial impact on the system (quantifying and describing
probable damage)
Hazards
Threats that could affect the water system: landslides, earthquakes, floods, volcanic eruptions, droughts, etc.
Measures
Identification and implementation of risk prevention and mitigation
The methodology has the following steps:
A. Background and general information gathering
■ Use of participatory techniques (workshops) with the local populace
and other sources.
■ Inventory of disasters and other historical phenomena.
■ Secondary compilation of studies and reports, including newspapers. ■ Analysis of aerial photos and topographic maps.
■ Hazards Maps.
■ Climate scenarios, tendencies and future projections.
B. Direct on-the-ground observation
C. Information processing
■ a. Preparation of maps and supporting documents that represent all
the information analysed. The maps can be prepared using geographic information systems (GIS) or satellite images (for example, using Google Earth).
Intensity/ Magnitude
Frequency
High High High Medium Residual
Very low >200
Medium High Medium Low
Low Medium Low Low
Frequency (Return
Period)
High 1-10 Medium 10-50 Low 50-200 Matrix for hazard assessment
■ Estimation of the relative intensity of the phenomenon (for example,
the height of the water during a flood). The potential for causing damage of a phenomenon is related to its intensity.
■ Estimation of the probability or frequency of the phenomenon
occurring or possibly developing in the future. (The time period in which it is possible that a phenomenon with similar characteristics could occur.)
■ Identification of the level of the hazard (high, medium,low).
Conceptual framework for risk management
13
Vulnerability assessment
This is the process for determining the level of exposure of the components of the water and sanitation system, their physical, social, economic and environmental fragility, and their predisposition to damage and loss vis-à-vis a specific hazard. The analysis must take into account future climate scenarios and their impacts on the water system. As well the analysis should also include the capacities of the communities, local water committees and the water supply systems to face or reduce risk. The vulnerability assessment consists of the identification and assessment of the vulnerable elements and the estimation of the percentage of losses due to a hazardous phenomenon. (Source: Instrumentos de apoyo para el análisis y la gestión de riesgos naturales en el ámbito municipal de Nicaragua. Guía para el especialista. 2002. SDC). It must be taken into account that vulnerability constitutes a dynamic system that arises due to the interaction of a series of external and internal factors and characteristics that converge in a particular community or area. This interaction of factors is known as global vulnerability. This global vulnerability can be divided into different vulnerabilities or vulnerability factors that are all interrelated: physical vulnerability and economic, social and environmental vulnerability. (Wilches-Chaux, 1993)
The methodology is based on the use of existing, updated and reliable information regarding: the system (system blueprints, operational methods, location and data about system components), the project zone (disaster occurrence, types of hazards, hazard maps, climate and risk scenarios, etc) and the environment (poverty levels, organizational structures, actors and institution on watershed, etc.). Each vulnerability analysis is associated with a specific hazard; the analysis determines the structures and equipment susceptible to damage, whether direct, such as the flooding of a pumping station, or indirect, such as failures in power supply, as well as capacities for damage reduction.
The vulnerability of a drinking water or sewerage system is analyzed from five perspectives or dimensions of global vulnerability:
Physical: An estimation of possible damage to the infrastructure components due to four criteria:
a) level of exposure to the hazards due to location, b) quality of construction and of the materials used,
c) the potential damage that could be expected if affected by a disaster, and d) consideration of the three other criteria under future climate scenarios. Operational: An appraisal of the remaining capacity to provide the water supply and/or sewerage service with quality. It is important to analyse both the internal components of the business that provides support for the operational activities and maintenance (e.g., transportation, communications and the supply of materials) and the external components (e.g., electricity supply, telephones, fire fighters, etc.). At the same time, an operational analysis should to be carried out in order to determine the operational capacity to provide the service, taking into account future climate scenarios and different probabilities of hazards in the future.
Organisational: This analysis assesses the community’s institutional, entrepreneurial and administrative capacity with regard to organization, experience and resources in general. The organization of the business or institution is often the element that is most vulnerable to the impact of hazards due to the limited training and know-how in emergency response.
Cultural and socioeconomic: This refers to the community that will use the service, given that the misuse of the systems, poverty, schooling levels, and gender inequality all contribute to vulnerability of the water system, in particular those factors linked with tariffs and maintenance, among others.
Environmental: This analysis includes data on the micro watershed, water quality, catchment protection, hygiene and other environmental practices like burning and cutting of vegetative cover, grey water management, etc.
Conceptual framework for risk management
15
To assess vulnerability, at least the following steps are needed:
A. Information gathering:
1. Identification of the national and regional institutional organization as well as the current legal framework governing risks and disasters, climate change and adaptation to climte change.
2. Description of the study area: location, climate and future climate scenarios; urban, public health and sanitation structure; geological, geomorphologic and topographic data; socioeconomic development, etc.
3. Identification and description of each of the elements of each component of the system.
4. Identification and functional description of the system (volumes of flow, levels, pressures and quality of service).
5. Identification of the operational aspects of the system (capacity of components, demand, deficit or surplus).
6. Identification and description of the administrative aspects and response capacity of the company, or local committee, managing the system.
7. Determination of the minimum demand of the population in the locations considered to be of priority for supply during and following disasters, in order to ensure the quality of service.
B. Direct on-site observations
8. Determination of the parameters and assessment of hazards, in terms of their impact upon the system (physical vulnerability).
9. Identification of the system’s critical and vulnerable components that are essential to the system having the capacity to meet the minimum demand and supply the sites considered to be a priority.
C. Processing of the information and assessment of vulnerability
On the basis of the identification of the level of exposition, fragility and resilience, and determination of the possible effects of the impact of the hazard (including climate varieability) on the system components: 10. Quantification of the remaining useful capacity of each componentand subsystem to operate in the determined condition, taking into account quantity, quality and continuity (operational vulnerability). 11. Estimation of the organizational response capacity (organizational
Co nt am in at io n: l au nd ry w as hi ng p la ce s, in se ct ic id e pu m ps , a ni m al b at hs , f ec es G eo lo gi ca l f au lt Ca tc hm en t p oi nt s Sand fi lt er Su rf ac e la nd sl id e Co nv ey an ce li ne St re am c ro ss in g D ee p La nd sl id e Se lv a N eg ra Ta nk
D. Risk Estimation
It is important to be clear that steps A, B and C must be repeated for each anticipated hazard and for each component of the system. A risk analysis consists of estimating the probable losses for the different possible hazardous events. To assess the risk is to relate the hazards and the vulnerabilities in order to determine the social, economic and environmental consequences of a given event.
Conceptual framework for risk management
17
The risk analysis of the water system components will make it possible to obtain a map of the system’s risks that will identify the most vulnerable and critical components as well as the hazards to which they are exposed. The results of the analysis of hazards and vulnerability are the basis for the risk analysis. To create a risk map, the components that have been identified as most vulnerable and the hazard maps for each of the identified hazards must be superimposed upon the system’s blueprints. The analysis is presented on maps using geographic information systems. On these, the risk levels must be identified and rated according to different levels: low, medium and high. The probable losses or probable damage must be estimated in a qualitative or quantitative way, according to the reliability or availability of the database.
The following issues need to be integrated into the risk assessment:
■ Characteristics of the scenario (Magnitude and intensity, time of day
and duration of the event, probability of occurrence).
■ Characterization and estimation of losses anticipated in the system. ■ Estimation of the size and value of the damage.
■ Analysis of climate scenarios and their impacts on the water system.
E. Determination of the mitigation, preparedness, emergency
response and rehabilitation measures
(administrative, operational and physical)
To revert, control or reduce risk and the impact of the hazard upon the system’s components, a set of measures should be identified and selected. The main criteria’s to choose the best options must include:
■ Effectiveness: will the measure actually reduce the risk?
■ Cost/benefit: the measure should not cost more than the installation
it is to protect.
■ Feasibility: the measure should not be too complex; the required
materials should be available; community members should be able to build it.
■ Sustainability: the measure should require little maintenance; the
local water committee should be able to provide all necessary effort and resources
It is important to be clear that steps A, B, C and E must be repeated for each of the hazards and for each component of the system. The entire analysis should be presented in a report. Besides hazards, vulnerabilities and risk, the risk analysis report should include risk reduction measures, emergency response and rehabilitation activities for each component, with clear responsibilities and procedures.
The risk potential is incorporated in the design of this aerial crossing.
The risk potential was not taken into consideration in the design of this crossing. Hazard
RISK LEVEL
Vulnerability
High High High Medium
Medium High Medium Low
Low Medium Low Low
High Medium Low
Risk management
in the project cycle
The risk-management focus must be incorporated from the project planning stage to ensure that the project is located in zones that are low risk or without risk. If this is not possible, mitigation measures must be identified to protect the system and reduce damage to a minimum. These costs must be included in the project budget and a cost-benefit analysis must be done to ensure that the corrective measure does not cost more than the anticipated benefits from the project.
The risk management approach implies also assess that the project will not damage the surroundings or the environment, as well as that it will not generate new conditions of risk or contribute to climate change through the emission of greenhouse gases.
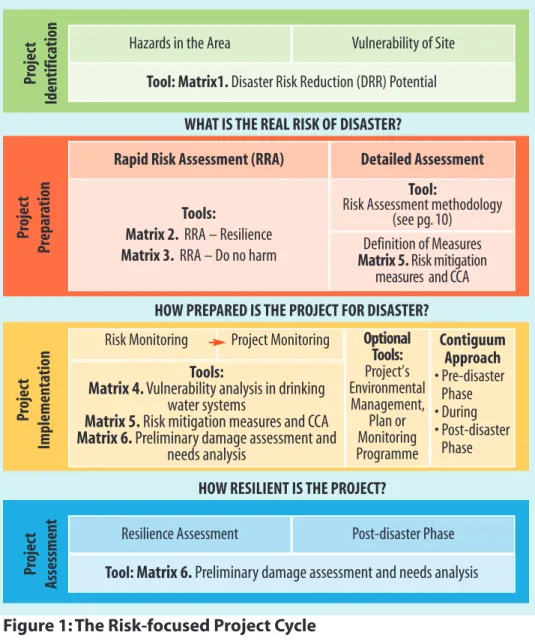
P ro je ct Id en ti fi ca ti on
WHAT IS THE POTENTIAL DISASTER REDUCTION?
Figure 1: The Risk-focused Project Cycle Hazards in the Area
Tool: Matrix1. Disaster Risk Reduction (DRR) Potential Vulnerability of Site P ro je ct A ss es sm en t
HOW RESILIENT IS THE PROJECT? Resilience Assessment
Tool:Matrix 6. Preliminary damage assessment and needs analysis
Post-disaster Phase P ro je ct Im pl em en ta ti on
HOW PREPARED IS THE PROJECT FOR DISASTER? Risk Monitoring Project Monitoring Optional
Tools: Project’s Environmental Management, Plan or Monitoring Programme Contiguum Approach • Pre-disaster Phase • During • Post-disaster Phase Tools:
Matrix 4. Vulnerability analysis in drinking
water systems
Matrix 5. Risk mitigation measures and CCA Matrix 6. Preliminary damage assessment and
needs analysis P ro je ct P re pa ra ti on
WHAT IS THE REAL RISK OF DISASTER? Rapid Risk Assessment (RRA)
Tools:
Matrix 2. RRA – Resilience Matrix 3. RRA – Do no harm
Tool:
Risk Assessment methodology (see pg. 10)
Definition of Measures Matrix 5. Risk mitigation
measures and CCA Detailed Assessment
Risk management in the project cycle
21
Phase 1. Project Identification.
Objective: To determine the disaster risk potential for the project zone. This is a two-tiered assessment:
■ What hazards are identified in the zone including possible scenarios
as the result of climate change? This is oriented to recognizing the natural characteristics of the zone and the occurrence of natural phenomena with a probability of becoming disasters.
■ What conditions make the site, the system and the population
vulnerable? Also, what is the local capacity in terms of plans, programs, and infrastructure for event response, and what are the socio economic conditions of the population and local public and private institutions?
The recommended tool for this is matrix 1, which is a check list to help evaluators obtain a general idea of the context where the water/santitation project will be developed.
Tool:
Matrix 1. Identification of Disaster Risk Reduction (DRR) Potential
Phase 2. Project Preparation.
Objective: To determine if the project is resilient to potential disasters and whether its conditions will have a negative influence on risk environment in the area.
During this phase two types of analysis should be foreseen:
■ Rapid Risk Assessment is done by the same personnel who design
the water and sanitation project. Although it requires a sound level of risk awareness, it does not require specialized knowledge of hazards and vulnerabilities.
■ Detailed Risk Assessment. When the project does not pass the
Rapid Risk Assessment, a detailed risk assessment must be
conducted. This requires specialized personnel who must contact the local authorities and population in order to agree upon protection targets for project activity. The scope of the detailed assessment should integrated into the terms of reference for preparing the project feasibility study. Its also important to identify in the ToR the specific studies to be done: for example, to evaluate the slope stability in the hill where tanks or sand filters will be located, etc. A detailed assessment must include, at least:
◗Hazards that could affect the components of water system and
hazards that can be produced by the project itself.
◗Delimitation of areas that could be affected, their magnitude
and scope, probability analysis, and future climate scenarios.
◗Detailed analysis of the area’s vulnerability and response
capacity.
◗Post-disaster recovery potential.
Any known or available instrument, including the tools used to request project environmental permits from MARENA (the Ministry of the Environment and Natural Resources) or FISE may be used in the detailed risk assessment. The use of these instruments entails the definition of risk mitigation and prevention measures for the identified hazards, taking into account the vulnerabilities and capacities detected.
The collected information and analysis should be integrated into the project document. For instance, the Context chapter must identify any hazards that have affected the area, that affect it currently, ot that may affect in in the future, as well as the way the hazard condition can change (increase in intensity or frequency) due to climate variability.
Tools:
Matrix 2. RRA – Resilience. Matrix 3. RRA Do harm.
Risk management in the project cycle
23
Phase 3. Project Implementation.
Objective: To ensure regular risk observation and implementation of risk reduction measures form an integral part of the monitoring process prepared for the project.
For projects already completed or in operation, a system vulnerability analysis should be carried out to identify adaptation options and risk reduction measures.
Tools:
Matrix 4. Vulnerability analysis in drinking water systems. Matrix 5. Risk mitigation measures and CCA.
Matrix 6. Preliminary damage assessment and needs analysis
Phase 4. Project Assessment.
Objective: To verify that the mitigation and prevention measures proposed in the project design (feasibility phase) have been implemented and to verify their effectivity in making the project resilient. This includes verification of the capacities of local committees, institutions and other actors involved in the planning, implementation and operation of the water system.
Tools:
Matrix 4. Vulnerability analysis in drinking water systems. Matrix 6. Preliminary damage assessment and needs analysis
Instruments
for the integration
of risk management
and climate change
in the project cycle
Instruments for the integration of risk management and climate change in the project cycle
25
Project Characteristics: Yes Partial No Explanation and Source of Data A) Exposure to current and future hazards. The
components of the water system and/or its environment (micro watershed) are located in:
B) Impact (If the project is located in zones exposed to hazards and climate change, what is the expected impact?)
Temporary or permanent decrease in the availability of fresh water (reduced surface flow volume, saline intrusion, reduced recharging, etc) due to the drop in precipitation
Decline in water quality (increased salinity and contaminant concentration, chemical and biological contamination, increased pathogenic agents due to increased temperature) Zone exposed to seismic activity
Zone exposed to river delta, flood plains, etc Zone exposed to volcanic eruptions
Zone exposed to landslides, mudslides or rock falls Zone exposed to storms and hurricanes
Zone exposed to tsunamis and sea swells Zone exposed to droughts, arid/semi/arid zones Zone exposed to environmental pollution Zone exposed to agrochemical contamination Zone exposed to forest fires
Zones exposed to changes in precipitation (at the location and over time), be it for average rates or extremes
Zones exposed to temperature changes (at the location and over time), be it for average rates or extremes
Zones exposed to crime and vandalism
Project: Community: Municipality
Zone exposed to landslides,
mudslides or rock falls Yes Partial No
Explanation and Source of Data Increased run-off, erosion of ditch edges
Increased water turbidity due to sediment from landslides, erosion, etc
Increased frequency and severity of disease and pest outbreaks (due to higher temperatures) Damage or partial destruction of soils, forests, recharge areas, crops, etc, that protect the micro-watersheds
Damage or total destruction of some of the water system components or means of access due to existing hazards or an increase in their severity and frequency
C. Which of the following factors influence vulnerability?
Physical vulnerability: Is there infrastructure (buildings, highways, roads) related to the water system or the system components that could suffer damage due to the quality of the construction or the materials or due to its location?
Social vulnerability: Is the beneficiary population unorganized, unversed in different topics (DRR, CC, water, gender, etc.) and lacking know-how, leadership, or management tools (plans, ordinances, etc.)?
Economic vulnerability: Are there situations of poverty, tenuous quality of life, unstable health conditions, precarious housing, and/or lack of basic services in the zone?
Institutional vulnerability: For example: Is the provision of services (water, electricity, telephone) deficient or restricted? Are preventative or protective measures, such as physical planning, compliance with building codes, etc.,? Are related sector institutions absent?
Instruments for the integration of risk management and climate change in the project cycle
27
Zone exposed to landslides,mudslides or rock falls Yes Partial No
Explanation and Source of Data Environmental vulnerability: Are there delicate
environmental problems, such as soil degradation, deforestation, uncontrolled generation of solid waste and residual discharge, chemical contamination?
Global estimation of project risks 1. Do climate change and other natural or anthropogenic hazards place the project at risk? Answer YES if at least one of the items in section A and one in section B were marked YES.
2. Do the male and female project target group have the capacity to cope with the impact of the hazards and of CC? (The lower the vulnerability, the higher the coping capacity.) Answer YES if most of the items in section C were marked NO. 3. Is the project at significant risk? Yes:_____
The project is at risk (high or intermediate) and coping capacity is low. No:_____
The project is not at risk (high or intermediate) or the coping capacity is high. Conduct a detailed risk assessment: ____
Specific locations of the project: Yes Partial No Explanation and Source of Data A) HAZARD The water system components
are located:
In a flood plain or an alluvium zone where at least one event has occurred during the past 10 years. In a stream or river crossing zone with a potential for sudden flooding or where at least one event has occurred during the past 10 years. At the foot of a slope greater than 20°.
On the edge, on the side or at the foot of an active, unstable slope where at least one event has occurred during the past 10 years.
Within range of volcanic effect (lava, ash, mud flow) (< 5 km of an active volcano).
Near or over an active or potentially active seismic fault.
Along a coastline (tsunami, sea swell) at altitudes lower than 10 m.
In a zone that is susceptible to droughts, according to the INETER (Nicaragua Institute of Territorial Studies) maps.
In a zone with environmental contamination (arsenic, etc.).
In a zone with agrochemical contamination. In a zone with scenarios for reduced precipitation or changes in temporal and spatial precipitation patterns.
Project: Community: Municipality
Instruments for the integration of risk management and climate change in the project cycle
29
Specific locations of the project: Yes Partial No Explanation and Source of Data B) VULNERABILITY AND IMPACT
C) CAPACITIES
There are alternative water systems in case of damage or destruction.
The identified hazards have a significant impact upon some of the water system components (including recharge areas).
The Catchment structures (wells, storage, etc.) are poorly constructed or built with poor quality materials and/or without mitigation measures. The conveyance and distribution lines, sand filter, etc., are faultily located in relation to hazard zones (stream crossings, etc.) and/or poorly constructed, with poor quality materials and/or without mitigation measures.
Around the project, there are means of livelihood and natural resources, e.g., crops, livestock, forests, soil, which could be affected.
Human health, personal safety, availability or work, access to education could be affected. Access infrastructure to the water systems could be damaged or destroyed, and services interrupted or suspended.
The water source belongs to the community. There is general awareness of the hazards and risks in the area.
There is a local experience in risk management. There are early warning system and evacuation procedures
Specific locations of the project: Yes Partial No Explanation and Source of Data There is a link between the community, CAPS
(drinking water and sanitation committee) and the sector-related institutions.
There is technical/administrative capacity in the community for AOM (administration, operation and maintenance).
During its design and execution, the water system was analysed vis-à-vis disaster risks, and it has mitigation measures and response plans. There are technical studies of hazards and vulnerability in the community.
Others (specify).
Global estimation of project resilience Is the project resilient:
Yes, it is resilient______
Mark “Yes” if the response was “No” in all of the items of sections A and B and there are no more than two items marked “No” in section C.
No, it is not resilient:____ Name of evaluator:
Place and date:
Instruments for the integration of risk management and climate change in the project cycle
31
A) Unintentional Influence of the projectupon the zone Yes Partial No
Explanation and Source of Data A) PROJECT LOCATION
Causes increased erosion or landslides due to lay-out and/or faulty design.
Causes increased susceptibility to drought due to over-exploitation of aquifers or surfaces sources. Affects the quality of the water source due to contamination.
Causes increased probability of downstream flooding due to upstream water channelling, blockage of river bed, etc.
Shifts flood waters, sediment currents to other susceptible zones due to levies or other structures. Others (specify)
B) Unintentional effect of the project upon community vulnerability and livelihoods B) THE PROJECT
Affects the functioning of or causes damage to existing works.
Causes health problems due to poor quality water, lack of maintenance, etc.
Causes access-to-water-related social conflict in the community
Causes an additional impact on natural or
environmental resources (deforestation, soil use, etc.) Lowers the flow rate or water availability due to over exploitation of the resource.
Others (specify)
Project: Community: Municipality
Matrix 3. Rapid Risk Assessment (RRA) Tool The project does NOT generate risks or damages
A) Unintentional Influence of the project
upon the zone Yes Partial No
Explanation and Source of Data C) Unintentional effect of the project upon
resilience capacity C) THE PROJECT
Ignores current legislation on land and water use. Overburdens community capacity for project operation and maintenance management AOM costs are higher than the community’s capacity to pay.
The project currently operating does not respect the environmental stream flow
Others (specify)
Global estimation of project resilience The project complies with “Do not harm”
if the response to all the items in sections A, B and C was “No”. ___ The project does NOT comply with “Causes no damage”. _________ Name of evaluator:
Place and date:
Co m m un it y: M un ic ip al it y: D at e: Po pu la ti on a tt en de d: Ty pe : W el l w it h p um p_ _ H an d pu m p_ _ M AG _ _ M A B E_ _ M ix _ _ P re pa re d by : Ye ar s ys te m w as b ui lt Le n gt h o f t im e sy st em h as b ee n fu n ct io n in g: Co m m un it ie s se rv ed : Po pu la ti on s er ve d: M ai n h az ar d/ s: Fact or s Ph ys ic al fa ct or S ys te m co m po ne nt Cr it er io n 1 Cr it er io n 2 Cr it er io n 3 Lo ca ti on o f c on st ru ct io n Q ua lit y of c on st ru ct io n P ro ba bl e D am ag e A B C D E F G H Co lla ps e Pa rt ia l co lla ps e M in or da m ag e N o da m ag e H ig h M ed iu m h ig h M ed iu m lo w Lo w 3 2 1 0 3 2 1 0 3 2 1 0 ≥ 3 2 1 0 1 Ca tc hm en t s tr uc tu re (w el l, sp rin g or ri ve r c at ch m en t) 2 Co nv ey an ce li ne s 3 Di st rib ut io n lin e 4 Po w er g rid 5 Ro ad g rid to a cc es s t he sy st em (k m s. ) 6 Co m m un ic at io n ne tw or k (r ad io , te le ph on e, et c. ) G lo ba l A ss es sm en t Co m m un it ie s se rv ed : Sy st em c h ar ac te ri st ic M a tr ix N o . 4 V u ln e ra b il it y a n a ly si s in d ri n k in g w a te r sy st e m s
m m un it y: M un ic ip al it y: D at e: pu la ti on a tt en de d: Ty pe : W el l w it h p um p_ _ H an d pu m p_ _ M AG _ _ M A B E_ _ M ix _ _ P re pa re d by : ar s ys te m w as b ui lt Le n gt h o f t im e sy st em h as b ee n fu n ct io n in g: Co m m un it ie s se rv ed : Po pu la ti on s er ve d: ai n h az ar d/ s: Fact or s ys ic al fa ct or S ys te m co m po ne nt Cr it er io n 1 Cr it er io n 2 Cr it er io n 3 Lo ca ti on o f c on st ru ct io n Q ua lit y of c on st ru ct io n P ro ba bl e D am ag e A B C D E F G H Co lla ps e Pa rt ia l co lla ps e M in or da m ag e N o da m ag e H ig h M ed iu m h ig h M ed iu m lo w 3 2 1 0 3 2 1 0 3 2 1 0 ≥ 3 2 1 7 Pu m p st at io n 8 Pr e-tr ea tm en t s tr uc tu re s ( e. g. , sa nd tr ap a nd p re -f ilt er s) 9 Dr in ki ng w at er p la nt s (t re at m en t) ) Ch lo rin at io n sy st em St or ag e ta nk s Su m To ta l P hy si ca l F ac to r G lo ba l A ss es sm en t Co m m un it ie s se rv ed : Sy st em c h ar ac te ri st ic
Instruments for the integration of risk management and climate change in the project cycle
35
Notes:
a: In or very near zones that are subject to a high or medium hazard (landslide, flood, erosion, earthquake, drought, volcanic eruption) 3 b: In or very near zones that are subject to some extent to a high or
medium hazard, 2.
c: In or very near zones that are slightly subject to a high or medium hazard 1.
d: In or near safe zones with a low probability of occurrence of high or medium hazards, 0.
e: Most are built with poor quality materials, poorly constructed or in poor condition. 3
f: Most are built with low-resistance materials but well-constructed and in good condition 2.
g: Most are built with resistant materials but poorly constructed or in poor condition. 1
h: Most are built with resistant materials, well-constructed and in good condition. 0
Global vulnerability (horizontal)
Average of Criterion 1 + Criterion 2 + Criterion 3 for each variable Total Physical Factor (Vertical)
Sum of global vulnerability divided by the number of variables n = 11 (in this case)
TOTAL VULNERABILITY (Average)
Vulnerability Levels Assessment
Extremely high vulnerability => 3
High vulnerability Between 2 and <3
Medium vulnerability Between 1 and <2
N am e of C om m un it y: D at e M un ic ip al it y: P re pa re d by : FA CT O R S A ss es sm en t cr it er ia G lo ba l a ss es sm en t O P ER AT IN G F AC TO R ≥ 3 H ig h 2 M ed iu m / h ig h 1 M ed iu m / lo w 0 Lo w 1 Ex ist en ce a nd im pl em en ta tio n of p la ns o f m ai nt en an ce o f w at er sy st em s 0: H as a nd a pp lie s 1: H as b ut p ar tia lly a pp lie s 2: H as b ut d oe s n ot a pp ly 3: D oe s n ot h av e 2 Nu m be r o f u se rs w ho p ay v s T ot al u se rs 0: M or e th an 9 5 % 1: 7 1 to 9 4% 2: 5 1 to 7 0% 3: Le ss th an 5 0% 3 Fe e co ve rs co st o f o pe ra tio n an d m ai nt en an ce 0: M or e th an 9 5 % 1: 71 % t o 9 4% 2: 51 to 7 0% 3 L es s t ha n 50 % 4 Se rv ice co ve ra ge (p op ul at io n se rv ed / to ta l p op ul at io n) 0: M or e th an 9 5 % 1: 7 1 to 9 4% 2: 5 1 to 7 0% 3: Le ss th an 5 0% VU LN ER A B IL IT Y A N A LY SI S (C on t. ) M a tr ix N o . 4 V u ln e ra b il it y a n a ly si s in d ri n k in g w a te r sy st e m s
Instruments for the integration of risk management and climate change in the project cycle
37
5 Sy st em ca pa ci ty (P ob . S er . / P op . D is. ) 0: M or e th an 9 5 % 1: 71 % t o 9 4% 2: 51 to 7 0% 3: Le ss th an 5 0% 6 Co nt in ui ty o f s er vi ce (H rs ) 0: > 2 0 ho ur s 1: 1 2 to 2 0 ho ur s 2: 4 y 1 2 ho ur s 3: L es s t ha n 4 hr s. 7 Ra tio na l u se o f w at er a t h om e 0: Ov er 9 5% o f h om es w ith ra tio na l u se 1: 80 an d 94 % w ith ra tio na l u se 2: 51 -7 9% w ith ra tio na l u se 3: Le ss th an 5 0% w ith ra tio na l us e 8 W at er q ua lit y (D isi nf ec tio n/ ch lo rin at io n) 0: 1 00 % o f h ou se ho ld s u se di sin fe ct io n 1: 80 y 95 % 2: 61 a 79 % 3: L es s t ha n 60 % w ith ou t di sin fe ct io n 9 M ic ro m ea su re m en t 0: M or e t ha n 95 % 1: 71 to 9 4% 2: 51 to 7 0% 3: Le ss th an 5 0%N am e of C om m un it y: D at e M un ic ip al it y: P re pa re d by : FA CT O R S A ss es sm en t cr it er ia G lo ba l a ss es sm en t O P ER AT IN G F AC TO R ≥ 3 H ig h 2 M ed iu m / h ig h 1 M ed iu m / lo w 0 Lo w 10 Ex ist en ce a nd im pl em en ta tio n of o pe ra tin g re gu la tio ns 0: H as a nd a pp lie s 1: H as b ut p ar tia lly a pp lie s 2: H as b ut d oe s n ot a pp ly 3: D oe s n ot h av e Su m at or ia To ta l F ac to r Op er at iv o Vu ln er ab ili ty L ev el s A ss es sm en t Ex tr em el y hi gh v ul ne ra bi lit y = > 3 H ig h vu ln er ab ili ty Be tw ee n 2 an d < 3 M ed iu m v ul ne ra bi lit y Be tw ee n 1 an d < 2 Lo w v ul ne ra bi lit y Be tw ee n 0 an d < 1 TO TA L VU LN ER AB IL IT Y (A ve ra ge ) VU LN ER A B IL IT Y A N A LY SI S (C on t. ) N o te In e a ch c e ll y o u m u st p u t th e v a lu e a ss ig n e d to e a ch c ri te ri o n : To ta l F a ct o r (V e rt ic a l) S u m o f g lo b a l v u ln e ra b il it y d iv id e d b y t h e n u m b e r o f v a ri a b le s n = 1 0 ( in t h is c a se ) M a tr ix N o . 4 V u ln e ra b il it y a n a ly si s in d ri n k in g w a te r sy st e m s (C o n t. )
Instruments for the integration of risk management and climate change in the project cycle
39
N am e of C om m un it y: D at e M un ic ip al it y: P re pa re d by : FA CT O R S A ss es sm en t cr it er ia G lo ba l a ss es sm en t EN VI R O N M EN TA L / H YG IE N E FA CT O R ≥ 3 H ig h 2 M ed iu m / h ig h 1 M ed iu m / lo w 0 Lo w 1 Bu rn in g pr ac tic ed in th e w at er sh ed w he re th e ca tc hm en t s ou rc e is lo ca te d 0: Le ss th an 2 0 % o f ho us eh ol ds 1: B et w ee n 21 a nd 4 0% 2: 4 1 to 5 0% 3: M or e th an 5 1% 2 Fa rm er s i n th e w at er sh ed w ho u se a gr oc he m ic al p ro du ct s t ha t c on ta m in at e w at er so ur ce s 0: Le ss th an 2 0 % 1: B et w ee n 21 a nd 4 0% 2: 4 1 to 5 0% 3: M or e th an 5 1% 3 Ho us eh ol ds th at m ak e tr as h di sp os al n ea r w at er so ur ce s 0: Le ss th an 2 0 % 1: B et w ee n 21 a nd 4 0% 2: 4 1 to 5 0% 3: M or e th an 5 1% 4 En te rp ris e th at d isp os e of so lid o r l iq ui d w as te n ea r w at er so ur ce s 0: Le ss th an 2 0 % 1: B et w ee n 21 a nd 4 0% 2: 4 1 to 5 0% 3: M or e th an 5 1% VU LN ER A B IL IT Y A N A LY SI S (C on t. ) M a tr ix N o . 4 V u ln e ra b il it y a n a ly si s in d ri n k in g w a te r sy st e m s (C o n t. )N am e of C om m un it y: D at e M un ic ip al it y: P re pa re d by : FA CT O R S A ss es sm en t cr it er ia G lo ba l a ss es sm en t EN VI R O N M EN TA L / H YG IE N E FA CT O R ≥ 3 H ig h 2 M ed iu m / h ig h 1 M ed iu m / lo w 0 Lo w 5 Po pu la tio n pr ac tic in g op en -a ir de fe ca tio n: 0: Le ss th an 2 0 % o f t he po pu la tio n 1: B et w ee n 21 a nd 4 0% 2: 4 1 to 5 0% 3: M or e th an 5 1% 6 Pr es en ce o f p ud dl es a nd st ag na nt w at er : 0: Le ss th an 2 0 % o f t he po pu la tio n 1: B et w ee n 21 a nd 4 0% 2: 4 1 to 5 0% 3: M or e th an 5 1% 7 Di st an ce b et w ee n la tr in es a nd d rin ki ng w at er w el ls or w at er so ur ce s l es s t ha n 20 m et er s: 0: L es s t ha n 20 % 1: B et w ee n 21 to 4 0% 2: 4 1 to 5 0% 3: M or e th an 5 1% VU LN ER A B IL IT Y A N A LY SI S (C on t. ) M a tr ix N o . 4 V u ln e ra b il it y a n a ly si s in d ri n k in g w a te r sy st e m s (C o n t. )
Instruments for the integration of risk management and climate change in the project cycle
41
8 Pr es en ce o f w at er -r el at ed e nd em ic d is ea se s ( m al ar ia , d en gu e, di ar rh oe a, p ar as ito si s, et c) : 0: L es s t ha n 20 % of th e po pu la tio n 1: B et w ee n 21 a nd 4 0% 2: 4 1 to 5 0% 3: M or e th an 5 1% 9 Fa m ily co nt ro l o f w at er q ua lit y by so m e m ea ns o f d is in fe ct io n: c hl or in at io n, bo ili ng , s ol ar , f ilt er s: 0: M or e th an 8 0 % 1: 6 1 to 7 9% 2: 4 1 to 6 0% 3: L es s t ha n 40 % 10 Gr ey w at er m an ag em en t: 0: M or e th an 8 0 % 1: 6 1 to 7 9% 2: 4 1 to 6 0% 3: L es s t ha n 40 % 11 Ap pr op ria te u se a nd m an ag em en t o f d rin ki ng w at er (e .g ., sa fe st or ag e, tr an sp or t, ha nd w as hi ng , h an dl in g, e tc .): 0: M or e th an 8 0 % 1: 6 1 to 7 9% 2: 4 1 to 6 0% 3: L es s t ha n 40 % 12 Ad eq ua te h an d w as hi ng in st al la tio ns in h om es o r p ub lic / pr iv at e bu ild in gs : 0: M or e th an 8 0 % 1: 6 1 to 7 9% 2: 4 1 to 6 0% 3: L es s t ha n 40 % Su m To ta l E nv ir on m en ta l F ac to rN am e of C om m un it y: D at e M un ic ip al it y: P re pa re d by : FA CT O R S A ss es sm en t cr it er ia G lo ba l a ss es sm en t SO CI O -C U LT U R A L/ O R G A N IS AT IO N A L FA CT O R ≥ 3 H ig h 2 M ed iu m / h ig h 1 M ed iu m / lo w 0 Lo w 1 % P er ce nt ag e of th e po pu la tio n th at k no w s a bo ut th e ha za rd s i n th ei r c om m un ity a nd w at er sy st em s 0: M or e th an 8 0% 1: 6 1 an d 79 % 2: 4 1 an d 60 % 3: Le ss th an 4 0% 2 Eq ui ta bl e co m m un ity p ar tic ip at io n (o f m en a nd w om en ) i n w at er b oa rd s / CA PS (w at er a nd sa ni ta tio n co m m itt ee s) 0: 5 0% M , 5 0 % W 1: B et w ee n 49 % a nd 4 0% W 2: 3 0% to 3 9% W 3: < 3 0% W 3 Fa m ili es th at p ar tic ip at e in a co m m un ity o rg an iz at io n 0: M or e th an 8 0 % 1: 6 1 to 7 9% 2: 4 1 to 6 0% 3: Le ss th an 4 0% 4 Ca pa ci ty fo r c om m un ity m an ag em en t ( nu m be r. of co m m un ity -m an ag ed p ro je ct s) 0: M or e th an 8 % 1: 6 1 to 7 9% 2: 4 1 to 6 0% 3: Le ss th an 4 0% VU LN ER A B IL IT Y A N A LY SI S (C on t. ) M a tr ix N o . 4 V u ln e ra b il it y a n a ly si s in d ri n k in g w a te r sy st e m s (C o n t. )
Instruments for the integration of risk management and climate change in the project cycle
43
5 M un ic ip al /c om m un ity w at er m an ag em en t co m pa ni es o rg an iz ed 0: O rg an ise d an d fu nc tio ni ng 1: O rg an ise d bu t i na ct iv e 2: In p ro ce ss o f o rg an isi ng 3: N on -e xi st en t 6 M un ic ip al /c om m un ity w at er m an ag em en t co m pa ni es w ith a cc ou nt in g / a dm in is tr at iv e sy st em s 0: W ith a fo rm al a cc ou nt in g/ ad m in ist ra tiv e sy st em 1: W ith b eg in ni ng o r m an ua l ac co un tin g sy st em 2: A cc ou nt in g sy st em di so rg an ise d or n on -e xi st en t 3: N on e xi st en t 7 Pe rc en ta ge o f h ou se ho ld s t ha t r eg ul ar ly pa y th ei r w at er t ar iff 0: M or e th an 8 0 % 1: 6 1 to 7 9% 2: 4 1 to 6 0% 3: Le ss th an 4 0% 8 Lo ca l w at er co m m itt ee s o rg an is ed a nd fu nc tio ni ng 0: H as a nd a pp lie s p la n 1: H as co m m itt ee a nd up da te d pl an a nd a pp lie s i t in m or e th an 7 0% 2: H as co m m itt ee , b ut n o up da te d pl an 3: D oe s n ot h av e co m m itt ee or p la n 9 Sp ec ia l a tt en tio n an d pr ov is io n fo r h an di ca ps p er so ns 0: Ye s 3: N oN am e of C om m un it y: D at e M un ic ip al it y: P re pa re d by : FA CT O R S A ss es sm en t cr it er ia G lo ba l a ss es sm en t SO CI O -C U LT U R A L/ O R G A N IS AT IO N A L FA CT O R (C on t. ) ≥ 3 H ig h 2 M ed iu m / h ig h 1 M ed iu m / lo w 0 Lo w 10 Co m m un ity e m er ge nc y pl an th at in cl ud e w at er sy st em a ct io ns d ur in g em er ge nc ie s 0: H as a nd a pp lie s 1: H as b ut p ar tia lly a pp lie s 2: H as b ut d oe s n ot a pp ly 3: D oe s n ot h av e 11 Lo ca l P re pa re dn es s C om m itt ee s f un ct io ni ng 0: H as a nd a pp lie s 1: H as b ut p ar tia lly a pp lie s 2: H as b ut d oe s n ot a pp ly 3: D oe s n ot h av e 12 Lo ca l w at er sh ed co m m itt ee s f un ct io ni ng 0: H as a nd a pp lie s 1: H as b ut p ar tia lly a pp lie s 2: H as b ut d oe s n ot a pp ly 3: D oe s n ot h av e Su m To ta l s oc io -c ul tu ra l f ac to r VU LN ER A B IL IT Y A N A LY SI S (C on t. ) M a tr ix N o . 4 V u ln e ra b il it y a n a ly si s in d ri n k in g w a te r sy st e m s (C o n t. ) M i N 4 V l b il i l i i d i k i ( C )