S1 Supplementary Material to
Evaluation of the Potential of Cobalamin Derivatives Bearing Ru(II)
Polypyridyl Complexes as Photosensitisers for Photodynamic Therapy
Marta Jakubaszek,1,2,# Jeremie Rossier,3,# Johannes Karges,1,# Joachim Delasoie,3,# BrunoGoud,2 Gilles Gasser1,* and Fabio Zobi3,*
1 Chimie ParisTech, PSL University, CNRS, Institute of Chemistry for Life and Health
Sciences, Laboratory for Inorganic Chemical Biology, F-75005 Paris.
2 Institut Curie, PSL University, CNRS UMR 144, Paris, France. 3 Chemistry Department, University of Fribourg, CH-1700 Fribourg.
*Correspondence: [email protected]; www.gassergroup.com; [email protected]; www.fabiozobi.wixsite.com/zobigroup # these authors have contributed equally to the work.
S2
Table of Content:
Supplementary Figures
Figure S1. 500 MHz 1H-NMR of compound B
12-2 S2
Figure S2. Normalized UV-Vis of compounds 2, B12-2 and of cyanocobalamin S2
Figure S3. HPLC chromatogram of compound B12-2 S3
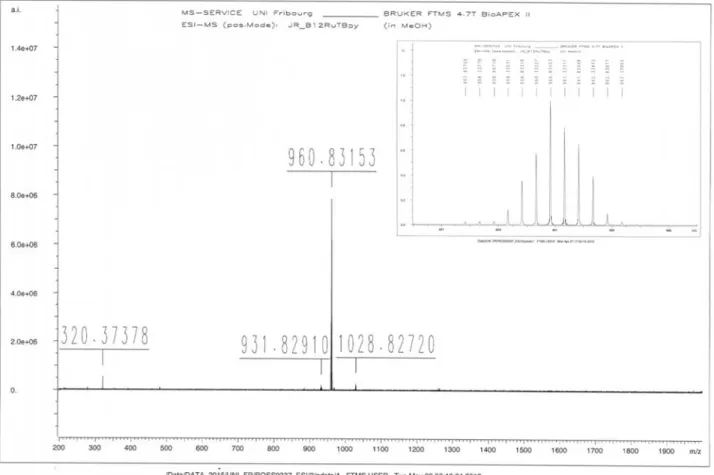
Figure S4. HR-ESI-MS of compound B12-2 S4
Figure S5. Cytotoxicity of compound 2 in HeLa cell line S5
Figure S6. Cytotoxicity of complex 2 in RPE-1 cell line S6
Figure S7. Cytotoxicity of complex B12-2in HeLa cell line S7
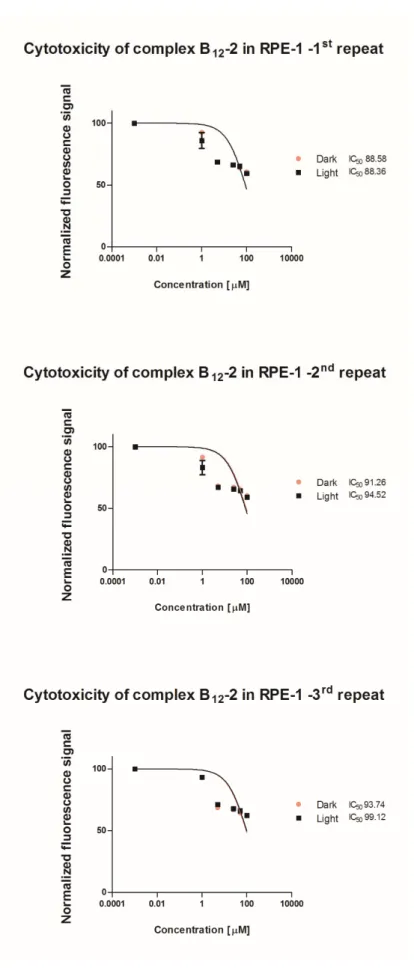
Figure S8. Cytotoxicity of complex B12-2 in RPE-1 cell line. S8
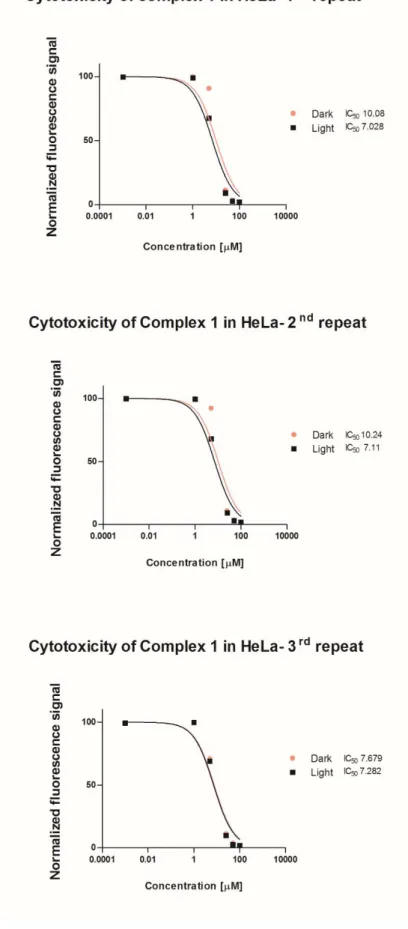
Figure S9. Cytotoxicity of compound 1 in HeLa cell line S9
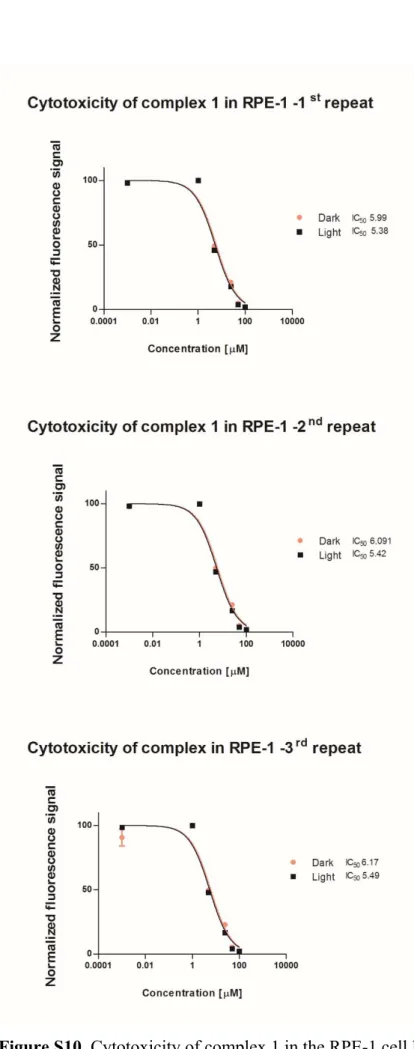
Figure S10. Cytotoxicity of complex 1 in RPE-1 cell line S10
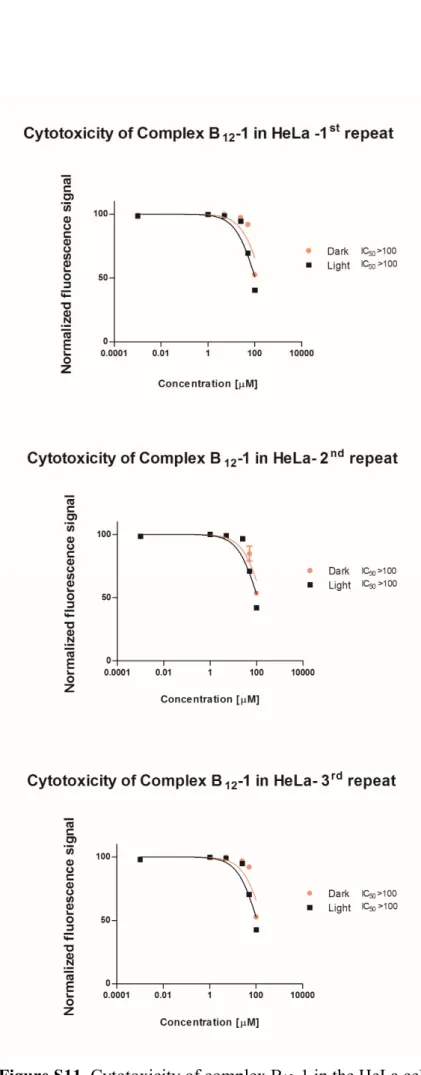
Figure S11. Cytotoxicity of complex B12-1in HeLa cell line S11
Figure S12. Cytotoxicity of complex B12-1 in RPE-1 cell line. S12
S3
Figure S1. 500 MHz 1H-NMR of compound B12-2 (in D2O, ✱= solvent residual peak).
1H NMR (500 MHz, MeOD-[d4]) peak assignment (see scheme on page S4): δ = 8.53
(t, J = 9.5 Hz, 4H, HC-13/22/31/40L), 8.25 (t, J = 9.37 Hz, 1H, HC-9L), 8.09-7.99 (m, 5H, HC-12L, HC-16/19/34/37L), 7.85-7.69 (m, 6H, HC-7L, HC-10L, HC-15/20/33/38L), 7.54 (dd, J = 6.0, 2.37 Hz, 1H, HC-5L), 7.40-7.32 (m, 5H, HC-11L, HC-14/21/32/39L), 7.29 (s, 1H, 7N), 7.14 (s, 1H, 2N), 6.82-6.76 (m, 1H, 4L), 6.50 (s, 1H, HC-4N), 6.37 (d, J = 3.2 Hz, 1H, HC-1R), 6.05 (d, J = 3.8 Hz, 1H, HC-10), 4.38-4.23 (m, 2H, 3R, 3), 4.13-4.07 (m, 1H, 19), 3.95 (dd, J = 13.0, 2.45 Hz, 1H, HC-176), 3.78 (dd, J = 13.0, 4.0 Hz, 2H, HC-2R, HC-4R), 3.62 (d, J = 14.3 Hz, 1H, Hb C-5R), 3.43-3.35 (m, 2H, HaC-5R, HbC-175), 3.32-3.25 (m, 2H, HC-8, HC-13), 2.99 (dd, J = 9.0, 5.3 Hz, 2H, HbC-171, HbC-172), 2.79-2.32 (m, 16H, HaC-175, HC-18, H3C-51, H3C-151, HaC-181, HC-21, HaC-132, HbC-71, HbC-132, HbC-71, HaC-82), 2.27 (s, 6H, H3C-10N, H3C-11N), 2.14 (t, J = 12.0, 1H, HaC-171), 2.09-1.93 (m, 7H, HaC-181, Hb C-131, HaC-71, HbC-81, HbC-31, HaC-31, HaC-131), 1.89-1.77 (m, 5H, H3C-7A, HaC-172, HbC-82), 1.45 (d, J = 4.2 Hz, 3H, H3C-12A), 1.40 (d, J = 3.4 Hz, 3H, H3C-2A), 1.34 (s, 3H, H3C-17B), 1.27 (d, J = 6.3 Hz, 3H, H3C-177), 1.18 (t, 1H, HaC-81), 1.15 (s, 3H, H3C-12B), 1.13-1.02 (m, 2H, H2C-32), 0.52 (s, 3H, H3C-1A) ppm
S5
Figure S2. Normalized UV-Vis of compounds 2, B12-2 and of cyanocobalamin (CN-Cbl) in methanol.
S6
S7
S8
S9
S10
S11
S12
S13
S14
S15
Figure S13. Cellular localisation of the complexes in HeLa cell line. Cells were treated with
the compounds (IC50 concentration in the dark) for 2 h and co-stained with NucBlue and
Mitotracker Green FM. Compounds were then removed, cells were fixed and visualised by confocal microscopy.