Publisher’s version / Version de l'éditeur:
Vous avez des questions? Nous pouvons vous aider. Pour communiquer directement avec un auteur, consultez la première page de la revue dans laquelle son article a été publié afin de trouver ses coordonnées. Si vous n’arrivez pas à les repérer, communiquez avec nous à PublicationsArchive-ArchivesPublications@nrc-cnrc.gc.ca.
Questions? Contact the NRC Publications Archive team at
PublicationsArchive-ArchivesPublications@nrc-cnrc.gc.ca. If you wish to email the authors directly, please see the first page of the publication for their contact information.
https://publications-cnrc.canada.ca/fra/droits
L’accès à ce site Web et l’utilisation de son contenu sont assujettis aux conditions présentées dans le site LISEZ CES CONDITIONS ATTENTIVEMENT AVANT D’UTILISER CE SITE WEB.
ASTM Special Technical Publication, 767, pp. 267-285, 1982
READ THESE TERMS AND CONDITIONS CAREFULLY BEFORE USING THIS WEBSITE. https://nrc-publications.canada.ca/eng/copyright
NRC Publications Archive Record / Notice des Archives des publications du CNRC : https://nrc-publications.canada.ca/eng/view/object/?id=6480f2c7-65cf-4cfb-bc2e-6049d1d85d4a https://publications-cnrc.canada.ca/fra/voir/objet/?id=6480f2c7-65cf-4cfb-bc2e-6049d1d85d4a
NRC Publications Archive
Archives des publications du CNRC
This publication could be one of several versions: author’s original, accepted manuscript or the publisher’s version. / La version de cette publication peut être l’une des suivantes : la version prépublication de l’auteur, la version acceptée du manuscrit ou la version de l’éditeur.
Access and use of this website and the material on it are subject to the Terms and Conditions set forth at
Measurement of the time-of-wetness by moisture sensors and their
calibration
1~-
SerTH1
N21d
National Research Conseil national
1
BLD'I
#
Council M a d a de recherck Canadai
MEASUREMENT OF THE TIME-OF-WETNESSI
BY MOISTURE SENSORS AND THEIR CALIBRATIONby P.J. Sereda, S.G. Croll, and H.F. Slade
Reprinted from
Atmospheric Corrosion of Materials American Society for Testing and Materials Special Technical Publication 767, 1982
p. 267
-
285 -- . -----
I 1
DBR Paper No. 1060 I
Division of Building Research I
n . - . ',
1'.
-
""
1
- - " --
- .
ip
SOMMAI RE
Un programme d'une a n n k i m p l i q u a n t p l u s i e u r s l a b o r a t o i r e s s i t u C s dans d i f f g r e n t e s zones c l i m a t i q u e s nous a o f f e r t 1 1 0 p p o r t u n i t 6 d l C v a l u e r l a r6ponse de c a p t e u r s s o l a i r e s m i n i a t u r e s (mis a u p o i n t a u CNRC) 1 l l h u m i d i t & s u p e r f i c i e l l e d e panneaux exposes b l ' a i r . I1 a C t C d h o n t r 6 que d e s c a p t e u r s d ' h d d i t 6 p l a c k 1 l a s u r f a c e d e panneaux e n d t a l ou e n p l a s t i q u e r h g i s s e n t 1 11humidit6 s u p e r f i c i e l l e , ou p l u s p r 6 c i s h e n t 1 celLe d e l e u r s u r f a c e , e t que c e t t e h u m i d i t 6 r C s u l t e a u t a n t d e l ' i n t e r a c t i o n du m i l i e u avec l e matEriau que d e s c o n d i t i o n s ambiantes du 1'HR.
Authorized Reprint from Special Technical Publication 767
Copyright
American Society for Testing and Materials 1916 Race Street, Philadelphia, Pa. 19103
1982
I?
J.
Sereda,' S.
G.
Croll,' and H.
I;:
Slade'
/Measurement of the Time-of-Wetness
by Moisture Sensors and Their
Cali bration
REFERENCE: Sereda, P. J., Croll, S. G., and Slade. H. F., "Measurement of the Time- 01-Wetness by Moisture Sensors and Tbeir Calibration," Atmospheric Corrosion of Met- ols. ASTM STP 767. S. W . Dean, Jr., and E. C. Rhea, Eds., American Society for Tesl- ing and Materials, 1982, pp. 267-285.
ABSTRACT: A I-year program involving several laboratories located in different cli- matic zones has afforded an opportunity to evaluate the response of miniature mois- ture sensors (developed at the National Research Council of Canada) to surface mois- ture on panels exposed to the atmosphere. It has shown that when these moisture sensors are placed on the surface of metal or plastic panels they respond to moisture conditions at the surface or more precisely, at the sensor surface, and that such mois- ture conditions result from interaction of the total environment with the material as well as with the ambient relative humidity conditions.
KEY WORDS: corrosion, metals, atmosphere, measurement. time-of-wetness, mois-
ture sensors, calibration, sensor potential, ambient relative humidity, temperature
Time-of-wetness was first measured by Sereda with a sensor consisting of a platinum foil strip on a zinc panel [I-31.' The period during which the po- tential generated by this galvanic cell exceeds 0.2 V was defined as the time- of-wetness, which served as the time base for the expression of the rate of
I corrosion in terms of
MDD,
(milligrams/square decimetre/day of wetness).Subsequent work has demonstrated the significance of this factor and its correlation with rate of corrosion [4-71. In the early work [I-31 it was ob- served that the potential measured by the cell varied in the range 0 to 1 V, apparently due to changing conditions of exposure. Whether the level of po- tential correlated, however, with certain ambient conditions such as relative humidity was not resolved.
Some success has been achieved by other workers in measuring integrated current using a sensor involving a galvanic or electrolytic cell and correlating 'National Research Council of Canada, Division of Building Research, Ottawa. Ont., Canada.
268 ATMOSPHERIC CORROSION OF METALS
this with the rate of corrosion [8-141. Although the monitoring of current levels above a certain value can be used as a measure of the time-of-wetness of such sensors, they are not appropriate, because of their large size, for monitoring surface moisture on exposed specimens of various materials or elements of buildings.
A new miniature moisture sensor has been developed. It monitors the presence of surface moisture in conjunction with atmospheric corrosion test- ing. Because of its possible usefulness, Subcommittee G01.04 on Weather of ASTM Committee G-01 on Corrosion of Metals organized a round-robin test series to evaluate its performance and to attempt its calibration in the range of 75 to 100 percent ambient relative humidity. This paper reports the results of the round-robin and the additional work carried out at the Na- tional Research Council of Canada (NRCC) Laboratories.
Experimental
The new moisture sensor was developed by NRCC in conjunction with Bell Northern Research Laboratories. It consists of a cell of alternate elec- trodes of zinc and gold or copper and gold on a glass-reinforced polyester (GRP) base 1.5 mrn thick ( ~ i g . la); the overall size is 20 by 25 mm. It was mounted on both galvanized metal and plastic bases 100 by 150 mm (Fig. lb). Temperature of the metal and plastic bases and that of the sensor was measured with 30-gage copper-constantan thermocouples embedded in the surface (Fig. 2). The mounted sensors were placed on a corrosion rack (Fig. 3).
At the Ottawa site, potential levels from the zinc/gold (Zn/Au) or copper/ gold (Cu/Au) sensors and temperatures, including the ambient and dew- point temperatures (dew cells located in a Stevenson screen; see Fig. 3), were recorded every 10 min on magnetic tape.
One set of sensors having Zn/Au electrodes was distributed to a number of participating laboratories to extend the evaluation program to different climates. As various unforeseen difficulties arose, however, only two of the original six laboratories have been able to supply completed data. These are included in the present paper, along with extensive data collected at the NRCC laboratory.
Analyses of the data included determination of the frequency distributions of ambient relative humidity and the potential levels from Zn/Au and Cu/Au sensors mounted on metal and plastic panels. The distribution of surface temperature, the difference between surface temperature and am- bient temperature, and surface temperature (metal or plastic) and sensor temperature were obtained for the periods when the potential from the Zn/Au cell exceeded 0.1 V and that from the Cu/Au cell exceeded 0.01 V. For the purpose of this paper these limits define the time-of-wetness. Data were collected at the Ottawa site for 1 1/2 years, and as they were reasonably
SEREDA ET AL ON TIME-OF-WETNESS 269
FIG. la-Moisture sensor.
270 ATMOSPHERIC CORROSION OF METALS
F I G . 2-Thermocouples mounred on specimens and on sensors: (a) on plastic specimen; (b) on metal specimen.
SEREDA ET AL ON TIME-OF-WETNESS 271 reproducible for comparable months of each year, only typical results are presented in this paper. Representative results reported by other participat- ing laboratories are given to indicate the influence of different climatic conditions.
Results and Discussion
Characteristic Results for Periods of Rain, Snow, Dew, and Hoarfrost
Figure 4 presents typical data collected for a period of rainfall that oc- curred on 14 Sept. 1979. The ambient and sensor surface temperatures were very similar, the relative humidity was 100 percent during most of the period, and the potential recorded by the Zn/Au cell was steady at about 0.8 V and that by the Cu/Au cell was initially about 0.05 V and tended to decrease with the time-of-wetness, a characteristic of this type of cell. The increase in volt- age is more rapid than the decay at the termination of rain because of the persistence of surface moisture.
Figure 5, showing a typical record of snowfall, has some similarity to Fig.
22 r A M B I E N T o S U R F A C E O F S E N S O R O N METAL ; 9 0 A M B I E N T PI 0 S U R F A C E OF S E N S O R O N M E T A L 80
.-./-.--.---*
0, 0.6 Z n l A u O N M E T A L D C u l A u O N M E T A L 0 . 2~ x o 06:m m:m 1o:m 1z:m i4:m 1 6 : ~ 18:m zo,m S E P T E M B E R 14. 1979
272 ATMOSPHERIC CORROSION OF METALS 6
-
U 4-
z
2 - E-
- 2 i- a.5
-a + AMBIENT.-
- b-
o SURFACE OF SENSOR ON METAL I I I I I I I I I 100 AMB I f NT*
OSURFACE OF i 907
SENSOR ON METAl cd 80Q=
I I I dl01 I I t a irOh ZnlAu ON METAL 0 CulAu ON METAL.-
I x 1 0 VOLTS) 0 . 2 P04:W 06:W oam lorn n:ao 14:m i6:m ie:m a m
OCTOBER 9 . 1979
FIG. 5-Record for interval of wet snowfa// (20.4 mm of rain equivalent). Ottawa.
4 for rainfall in having essentially equal ambient and surface temperatures. The ambient relative humidity was about 90 percent, but the surface relative humidity was assumed to be 100 percent because snow lay on its surface, probably creating a local condition of saturation under the snow cover. When the temperature rose, the snow melted and surface relative humidity was definitely 100 percent. The potentials on both Zn/Au and Cu/Au cells reached initially high values and remained fairly steady, in agreement with the assumed condition of saturation, although there was again a tendency for potential from Cu/Au cells to decrease.
Figure 6 is a typical record for a period of dew formation when the am- bient temperature was falling slowly and the surface temperature continu- ously about 2 deg lower, in contrast with conditions during rainfall or snow- fall. Consequently, the surface relative humidity was 100 percent, while the ambient relative humidity varied between 90 and 97.5 percent. Under these conditions the surface temperature is below the dew-point temperature and water vapor condenses on the surface. This represents a nonequilibrium
SEREDA E l AL ON TIME-OF-WETNESS 273 A M B I E N T 0 S U R F A C E OF S E N S O R O N M E T A L 100 -0-0-0- ?-a-O-D--o--O * A M B I E N T O S U R F A C E O F S E N S O R O N M E T A L J U L Y 15 J U L Y 16. 1979
FIG. &Record for interval of dew. Ottawa.
state. Under these conditions the potential generated by the Zn/Au cell was fairly steady at about 0.8 V. The Cu/Au cell reached a high value of 0.085 V at the beginning but decreased with time to 0.04 V. In the period of dew for- mation a potential was recorded during most of the interval.
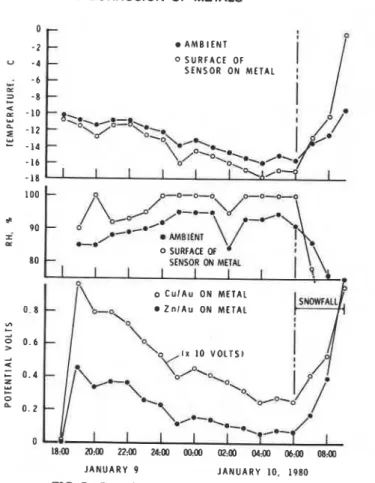
The results obtained for a period of hoarfrost formation are similar to those for dew formation, as shown in Fig. 7. The surface temperature was generally 2 deg C lower than the ambient temperature, but the ambient temperature decreased from -10 to -18OC. Under these conditions the rela- tive humidity at the surface reaches 100 percent and water condenses (as hoarfrost), although the ambient relative humidity is in the range of 85 to 95 percent. During this interval, the potential recorded by the Zn/Au cell rose rapidly to a value of 0.45 V, decreasing to a value of 0.1 V in 14 h, and the Cu/Au cell recorded initially 0.095 V, decreasing to 0.025 in the same period. Under these conditions the Cu/Au cell started at nearly its highest possible potential (roughly one tenth of that produced by the Zn/Au cell). This is in contrast with what appears to happen at temperatures above freezing when
274 ATMOSPHERIC CORROSION OF METALS
AMBIENT
0 SURFACE OF
SENSOR ON METAL
JANUARY 9 JANUARY 10. 1980
FIG. 7-Record for interval of hoarfrost, Ottawo.
dew is forming and the Zn/Au cell is relatively more sensitive (Fig. 6). This, however, has no significant effect on the measured time-of-wetness, as will be shown.
The results in Fig. 7 and those shown in Table 1 confirm that both Zn/Au and Cu/Au cells will develop a potential whether their temperature is above or below freezing, that is, O°C. In Table 1 it is evident that for the winter months in Ottawa over 80 percent of the time-of-wetness occurred at temperatures below 0°C. For the month of February 1979 about 5 percent of the recorded time-of-wetness occurred at or below a temperature of -30°C.
These observations confirm earlier findings [15] that films of water or solu- tion on the surface d o not freeze as bulk water does, but continue to serve as an electrolyte for the galvanic cell.
In general, the surface temperature is lower than the ambient temperature for an average of 83 percent of the time, but for plastic panels this value is 95
percent (Table 1). The temperature of the surface of metal panels was 2 to 4 deg C lower than the ambient temperature for an average of 13.2 percent of
TABLE I-Record of tempcrarures during rime-of-wemess a: 0::awa.
Year Lowest Temperature. % T-0-W for Lowest A: OC % T-0-W for
and Panel OC. for <5% Interval (Panel-Air) Interval in % T-0-W for Month Sensor* 96 T-0-W* T-0-W Below 0°C During T-0-W Previous Column A: < 0°C' 1978 Sept. P-Cu/Au 36.1 -2 2.5 -2 to -4 35.4 93.8 Sept. M-Cu/Au 28.3 0 1.7 -2 to -4 15.3 86.8 Sept. M-Zn/Au 30.5 0 1.6 -2 to -4 14.6 85.3 Nov. P-Cu/Au 22.4 -8 38.3 -4 to -6 2.3 93.3 Nov. M-Cu/Au 14.7 -4 19.5 -2 to -4 15.7 88.8 Nov. M-Zn/Au 13.2 -4 15.0 -2 to -4 14.1 91.0 1979 Jan. P-Cu/Au 25.0 -16 88.0 -2 to -4 5.8 76.8 Jan. M-Cu/Au 21.9 -14 84.6 -2 to -4 2.9 73.1 Jan. M-Zn/Au 24.8 -10 87.5 -2 to -4 2.4 70.7 March P-Cu/Au 38.2 -12 51.4 -4 to -6 4.3 89.2
March M-Cu/Au 25.9 -I2 45.6 -2 to -4 17.8 83.5
March M-Zn/Au 20.4 -10 36.6 -2 to -4 16.6 82.2 May P-Cu/Au 28.6 0 3.8 -4 to -6 0.8 96.6 May M-Cu/Au 22.5 2 1.0 -2 to -4 8.9 89.6 May M-Zn/Au 23.8 2 0.6 -2 to -4 8.3 88.2 July P-Cu/Au 26.2 8 0 -4 to -6 4.6 97.3 July M-Cu/Au 21.8 10 0 -2 to -4 22.6 91.2 July M-Zn/Au 18.6 10 0 -2 to -4 23.1 90.6 Sept. P-Cu/Au 31.1 -2 15.3 -4 to -6 11.2 96.9 Sept. M-Cu/Au 16.5 -2 13.4 -2 to -4 36.9 88.0 Sept. M-Zn/Au 23.7 -2 12.2 -2 to -4 37.4 89.0 Nov. P-Cu/Au 38.2 -6 37.9 -4 to -6 0.9 92.6 Nov. M-Cu/Au 33.9 -4 29.9 -2 to -4 2.2 79.3 Nov. M-Zn/Au 29.6 -4 33.6 -2 to -4 3.8 85.7 1980 Jan. P-Cu/Au 31.2 -20 87.3 -4 to -6 2.6 78.0 Jan. M-Cu/Au 25.5 -18 86.6 -2 to -4 4.7 84.1 Jan. M-Zn/Au 16.8 -16 81.8 -2 to -4 3.6 70.8 - P = clear p l ~ t i c ; M
----
metal. 'T-0-w = time-or-wetness.276 ATMOSPHERIC CORROSION OF METALS
TABLE 2-Frequency distribution of levels of potential for individual sensors. July 1979.
I Ottawa. Ont.
Zn/Au Sensors Cu/Au Sensors
Designation 0.1 V 0.2 V Designation 0.01 V 0.02 V B4- I 18.64" 17.76 CA- I 21.86 20.66 B4-4 21.03 19.99 CA-2 21.40 20.47 B4- l l 20.10 18.98 CN-2 22.25 20.42 B4-24 19.76 19.14
. . .
.
.
. ..
.
Avg 19.88 18.97 Avg 21.84 20.52"Percent time when a given potential in volts is exceeded.
the time. The temperature of the surface of the plastic panels was 4 t o 6 deg C lower than ambient temperature for a n average of 5.0 percent of the time. Although there were variations in the time-of-wetness for any one month, a s recorded by a single Cu/Au o r Zn/Au cell on metal, the annual time-of- wetness for the period August 1978 t o August 1979 was 21.92 percent for the Cu/Au sensor a n d 21.89 percent for the Zn/Au sensor. For the same period, the Cu/Au sensor o n plastic gave a value of 28.93 percent. To illustrate the
TABLE 3-Monthly frequency distribution of levels of potential. using average values from 3 or 4 sensors (percent time when a given potential is exceeded).
Zn/Au Sensors Cu/Au Sensors
Month 0.1 V 0.2 V 0.01 V 0.02 V 1978 Aug. 19.07 18.12 19.50 18.25 Sept. 29.82 29.13 27.63 26.12 Oct. 20.81 19.84 20.43 18.41 Nov. 13.82 13.15 15.96 13.70 Dec. 35.60 23.06 19.77 13.96 1979 Jan. 25.12 18.27 2 1.05 14.36 Feb. 15.77 13.77 21.95 17.52 March 20.85 19.27 29.20 25.64 April 20.92 20.1 1 22.47 20.57 May 25.39 24.79 23.70 22.75 June 22.38 21.75 23.28 2 1.99 July 19.88 18.97 21.84 20.52 Aug. 28.91 27.91 30.16 28.97 Sept. 25.56 24.86 26.32 25.16 Oct . 38.27 35.06 35.80 32.58 Nov. 33.60 31.00 34.16 26.17 Dec. 28.33 25.73 25.94 19.56 Avg 24.94 22.63 24.65 21.54 P
SEREDA ET AL ON TIME-OF-WETNESS 277
reproducibility of individual sensors, data are presented from four sensors using Zn/Au cells and three sensors using Cu/Au cells (Table 2). The varia- tion between sensors was not large, and good agreement was obtained be- tween the two sets even on a monthly basis.
Table 3 lists the average monthly values (as percent time a given potential level is exceeded) from three or four sensors. These results show that poten- tial levels of 0. I or 0.2 V for Zn/Au cells and 0.01 or 0.02 V for Cu/Au cells can be used to indicate the time-of-wetness with an agreement of better than 10 percent. The variation between the two types of cells at 0.1 and 0.01 V or 0.2 and 0.02 V is between 1 and 5 percent for a period of 17 months. Distribution of Ambient Relative Humidity, Potentials Measured by Moisture Sensors, and Resulting Correlarion
The current program was designed to determine whether a simple relation exists between the potential generated by the sensors and ambient relative humidity. This assumes that the surface temperature is not too different from the ambient temperature, and that a certain pseudo-equilibrium exists between ambient and surface conditions. These assumptions are based on previous work in which it was observed that the percent time during which the potential from a platinum foil on zinc plate sensor exceeded 0.2 V cor- responded to percent time during which the ambient relative humidity was above a critical value depending on site (in the range of 80 to 89 percent) [3-161.
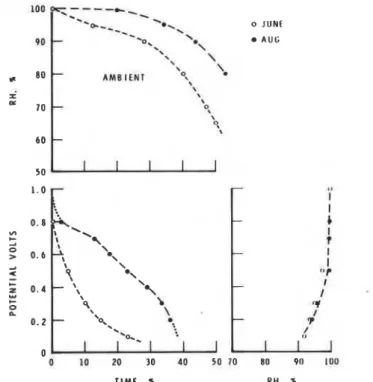
Some results obtained from exposure sites in Ottawa, Ont., Thousand Oaks, Calif., and Cleveland, Ohio, as part of the round-robin test, are pre- sented in Figs. 8 to 12. Each figure comprises three graphs coordinated to show the distribution of ambient relative humidity, distribution of measured potential, and the resulting correlation of potential with relative humidity. Figures 8 and 9 include data for both Zn/Au and Cu/Au cells. The charac- teristic distribution curves for potential are somewhat different for condi- tions above freezing (Fig. 8 for July) and conditions below freezing (Fig. 9 for January). These curves are also different for sensors mounted on plastic panels and metal panels.
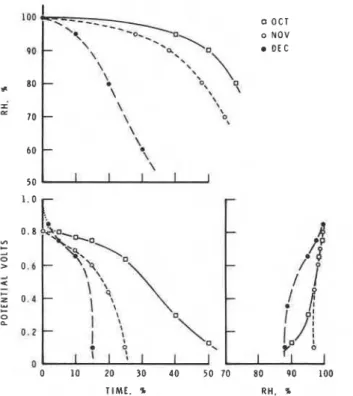
The correlation curves for potential versus relative humidity are different for each month and for each type of panel. Attempts to obtain a single rela- tion were not successful. The records from Thousand Oaks, Calif., for June and August (Fig. 10) and for October, November, and December (Fig. 11) and those from Cleveland, Ohio, for January, April, and June (Fig. 12) dem- onstrate how the monthly changes in ambient relative humidity conditions influence the distribution of potential generated by the Zn/Au sensor mounted on metal panels. These are major changes that greatly influence the apparent correlation of potential versus relative humidity. In Cleveland the sensor indicated a potential for the month of June at an ambient relative
278 ATMOSPHERE CORROSION OF METALS 0 Z n l A u ON METAL CulAu ON METAL 0 CulAu ON PLASTIC i P: 80
-
0 - 10 20 30 70 80 90 100 TIME. X R H . %FIG. 8-Record for July 1979. Ottawa.
o Z n l A u ON METAL CulAu ON METAL
0 CulAu ON PLASTIC
I I M E . % RH. %
SEREOA ET AL ON TIME-OF-WETNESS 279
0 JUNE A U G
TIME. 5 RH. +
FIG. LO-Record for June and August. Rockwell International Science Center, Thousand Oaks. Calif.
humidity below 70 percent, whereas in January it indicated a potential only when the ambient relative humidity was over 95 percent (Fig. 12). A similar result was obtained for November in Thousand Oaks, Calif. (Fig. 11).
T h e explanation of these results can be found in the distribution of relative humidity for each month. In January in Cleveland the relative humidity was above 97 percent for 40 percent of the time, and in November in Thousand Oaks it was above 95 percent for 30 percent of the time. Under such condi- tions the surface temperature would be nearly the same a s the ambient, as shown in Figs. 4 and 5. Atmospheric conditions for the month of June in Cleveland dictated that the ambient relative humidity was above 80 percent only 5 percent of the time, a s may be seen in Fig. 12. Under such dry condi- tions it is expected that most of the potential recorded represented periods of dew formation (Fig. 6), when the surface temperature is lower than ambient by as much as 2 deg (this is often below the dew-point), representing non- equilibrium conditions resulting in condensation. Thus a potential was re- corded although the ambient relative humidity was below 70 percent. The two correlations of potential versus relative humidity for the months of Jan- uary a n d June in Cleveland represent the two extreme atmospheric condi- tions encountered in this program. Otherwise, the conditions were inter- mediate, with a mixture of periods of high ambient humidity (for example,
280 ATMOSPHERE CORROSION OF METALS QO
lky=z-y
--_
0 OCT PO * 8 0 - I LL 70 6 0 5 0 O1. o NOV-
\ \--
OEC \'*
*\.\
\", 7
\ \-
\ \ 9 \-
'.
\ \ I I I 1.0 VI-
2 0 s 0 . 6 A 4-
-
u o , 8 b F , l1
2 0 . 4 b- 0 0.!
Q
1 0 . 2 1i
I7
=i
4 0t P b
0 10 20 3 0 4 0 5 0 70 8 0 9 0 100 T I M E , % R H . %FIG. I 1-Record for October (1-18). November, and December 1978, Rockwell International Science Center, Thousand Oaks, Cali/:
during rainfall) and conditions of surface condensation during lower levels of ambient relative humidity owing to surface temperatures lower than am- bient temperatures.
Surface Temperature of Base Panel and That of Sensor
It is clear that surface temperature relative to ambient is a very important parameter in determining time-of-wetness. Temperature differences between sensor and base are given in Table 4. The temperature of the sensor was, on the average, higher by 0 to 0.5 deg C for 13 percent of the time on a metal base and lower by 0 to 0.5 deg C about 84 percent of the time. For this rea- son, condensation usually occurs first on the sensor. The temperatures plot- ted in Figs. 4 to 7 are those for the sensor since they are more directly related to the recorded time-of-wetness. This could not be done for all the data given in Table 1 because the thermocouples were installed on the sensors only dur- ing the latter part of the program.
When a sensor was mounted on a plastic base, the sensor temperature was lower by 0 to 0.5 deg C with respect to the temperature of the base for 57 percent of the time and higher for 43 percent of the time. This was so because the thermal characteristics of the sensor are similar to those of the plastic base on which it was mounted, and the net gain or loss of heat for the system
SEREDA ET AL ON TIME-OF-WETNESS 281
0 JAN
0 A P R JUNE
TIME. % R H . %
FIG. 12-Record for January. April, curd June, 1979, Republic Steel Research Center, Cleveland. Ohio.
was nearly equal. This is in contrast with the case where the sensor is mounted on a metal plate, as discussed earlier. It is desirable that the sensor not disturb the thermal regime of the surface, an objective that can be ap- proached when the sensor is very thin. New sensors are now made only 0.1 mm thick and should respond quickly to surface temperature changes, de- creasing to a minimum any temperature difference between sensor and base.
Conclusions
1. New miniature sensors provide a reasonable indication of surface wet- ness; sensors using Zn/Au and those using Cu/Au cells are equally effective. 2. Temperature of an exposed surface may be different from that of air; if it is lower, condensation can occur when the relative humidity of the air is not at saturation. The temperature difference depends on the character of the surface and the weather conditions.
3. The time-of-wetness of a surface will vary not only from one locality to another and from one month or year to another, but also with type, size and orientation of specimen exposed to a given atmosphere.
4. When sensors are used to indicate surface conditions, they must be small and thin to minimize temperature difference.
5. There is no unique relation between the potential developed by these sensors and ambient relative humidity.
0
V)
w
TABLE 4--Percent time when value of lemperature dvference between sensor and base is in range denoted.
m
1
Zn/Au Sensor on Metal Base Cu/Au Sensor on Metal Base Cu/Au Sensor on Plastic Base m 0 1979 0 to +O.S°C 0 to -O.S°C 0 to +OS°C 0 to -0.5OC 0 to +0.5"C 0 to -O.S0C
%
n June 13.7 86.0 14.4 85.1 37.9" 45.0 July 12.7 86.7 11.0 88.8 35.4 50.2 Aug. 10.4 88.5 10.5 88.2 27.2 60.2 Sept
.
21.8 70.9 23.1 71.5 33.9 49.4P
o c t . 9.6 89.3 10.0 88.7 21.4 70.68
Nov. 15.3 82.1 18.7 77.7 23.3 66.5 Dec. 14.7 84.0 15.8 83.3 23.2 62.15
19809
Jan. 12.8 82.8 7.1 89.7 29.5 58.0G;
Feb. 9.0 89.7 8.4 87.6 40.8 48.4 Avg 13.3 84.4 13.2 84.5 30.3 56.7SEREDA ET AL ON TIME-OF-WETNESS 283
Acknowledgment
The authors wish to acknowledge, with thanks, the contribution of F. C Livermore and B. K. MacLaurin of Bell Northern Research Laboratories in the development and fabrication of the sensors. Credit is due to Rockwell In- ternational Science Center, Thousand Oaks, Calif., especially F. Mansfeld, and to Republic Steel Research Center, Cleveland, ~ h i o , especially Edward C. Rhea (now with Reynolds Metals), for participating in the ASTM round- robin and for collecting and analyzing the data included.
This paper is a contribution from the Division of Building Research, Na- tional Research Council of Canada, and is published with the approval of the director of the Division.
References
[ I ] Sereda, P. J . , American Society for Testing and Materials Bulletin No. 228, Feb. 1958, pp. 53-55.
[ 2 ] Sereda, P. J . , American Society for Testing and Materials Bulletin No. 238, May 1959, pp.
61-63.
[ 3 ] Sereda, P. J . , American Society for Testing and Materials Bulletin No. 246, May 1960, pp.
47-48.
[ 4 ] Sereda, P. J . , IndustrialandEngineering Chemistry. Vol. 52, No. 2, Feb. 1960, pp. 157-160. [ 5 ] Guttman, H. and Sereda, P. J. in Metal Corrosion in the Atmosphere, ASTM STP 435.
American Society for Testing and Materials, 1968, pp. 326359.
[ 6 ] Guttman, H. in Metal Corrosion in the Atmosphere. ASTM STP 435. American Society for
Testing and Materials. 1968. pp. 223-239.
171 Haynie, F. H. in Durability of Building Marerials and Components, ASTM STP 691. Ameri- can Society for Testing and Materials, 1980, pp. 157-179.
[ 8 ] Tomashov, H . D., Berukshtis, G. K., and Lokotilov, A. A., ZavodskaiaLaboratoriia. Vol.
22, 1956, pp. 345-349.
[ 9 ] Kucera, V. and Mattsson, E. in Corrosion in Natural Environments, ASTM STP558, Amer- ican Society for Testing and Materials, 1974, pp. 239-260.
[ l o ] Kucera, V. and Mattsson, E. in Proceedings. Seventh Scandinavian Corrosion Congress (7
NKM), Trondheim, Norway, May 1975, pp. 202-217.
[ I l l Kucera, V. and Collin, M. in Proceedings, European Congress on Metallic ~ o i r o s i o n ,
London, Sept. 1977. pp. 189-196.
1121 Mansfeld, F. and Kenkel, J. V., Corrosion Science, Vol. 16, 1976, pp. 111-122.
[I31 Mansfeld, F. and Kenkel, J. V. in Proceedings. Corrosion/77, The International Corrosion
Forum, San Francisco, Calif., March 1977, Paper No. 134.
[ 1 4 ] Hagenrud, S. in Extended Abstracts of the 154th Elecrrochemical Society Meeting, The Elec-
trochemical Society Inc., Princeton, N. J., Vol. 78-2, 1978, pp. 327-328.
[ I S ] Strekalov, P. V., Mikhailovoskii, Yu N., and Donilova, M. W., Protection of Metals, Vol.
14, No. 3, May-June 1978, pp. 195-199.
[I61 Sereda, P. J . in Corrosion in Natural Environments. ASTM STP 558. American Society for
284 ATMOSPHERE CORROSION OF METALS
DISCUSSION
S. C. ~ ~ r n e ' (written discussion)-The time-of-wetness gage should be drastically affected by hydroscopic or other properties of corrosion products which, in turn, should be affected by atmospheric composition. Has any work been planned to further define the role of atmospheric composition in determining time-of-wetness?
I
P. J. Sereda (authors' closure)-The time-of-wetness, as defined by a min-I imum level of potential (representing the current generated by the galvanic
cell) is affected by surface contaminants resulting from deposition of atmos- pheric pollutants on the sensor. However, the surfaces where corrosion is being monitored are also exposed to the same contaminants, which, in turn, affect the deposition of films of moisture to foster the process of corrosion. Work is needed to measure the microenvironment at corroding surfaces.
F. ~ a n s f e l d ~ (written discussion)-1. The difference in the response of your sensor and our ACMs could be related to the different sensitivity of the de- vice. You measure the voltage drop across a very large resistor which is due to galvanic current flow. However, this voltage drop separates the two elec- trodes and you cannot measure the maximum galvanic current which one would measure with a zero resistance ammeter.
2. Another reason for different sensitivity is that the gold electrode in your sensor does not form corrosion products which would condense moisture and lead to current flow. The zinc electrode could be wet, while the noble electrode (Pt/Au) is still dry.
3. Despite the fact that different designs of time-of-wetness tw sensors measure different tw-values at a given test site, do you think that one could use a sensor of constant design to compare different test sites?
P. J. Sereda (authors' closure)-1. The statement is true, but what is signif- icant is to have adequate sensitivity to detect films of moisture which corre- spond to or foster practical rates of corrosion.
2. This paper presents results showing that sensors detect condensing films of water because the surface temperature is often below the ambient and at or below the dew point. Under these conditions, corrosion products are not required to condense water on any surface. Furthermore, it is not the corrosion products only, but more likely the deposited contaminants from the atmosphere (ions of CI-, SO;, etc.) deposited on all surfaces which would depress the vapor pressure of water and form solutions below 100 percent relative humidity that contribute to galvanic current, and are detected as the time-of-wetness.
'
Alcoa Laboratories, Alcoa Center, Pa.DISCUSSION ON TIME-OF-WETNESS 285 3. Conclusions 3 and 5 of the text are an answer to this question. Whatever sensor is used, provided it is small enough to respond to ambient temperature changes in the same way as a given specimen surface, it will give different
1
values for the time-of-wetness for different type, size, and orientation of specimens exposed to a given atmosphere. In other words, there is not a unique i value of the time-of-wetness for a given site; thus comparison of the time- of-wetness of different sites is valid only for identical specimens exposed in the same way at the different sites. Recent work by our institute has shown that two identical plastic specimens exposed side by side, one oriented verti- cally and the other horizontally, recorded the time-of-wetness (using our min-'
This publication i s being distributed by the Division of Building R e s e a r c h of the National R e s e a r c h Council of Canada. I t should not be reproduced in whole o r in p a r t without p e r m i s s i o n of the original publisher. The Di- vision would b e glad to b e of a s s i s t a n c e in obtaining s u c h p e r m i s s i o n .
Publications of the Division m a y be obtained by m a i l - ing the a p p r o p r i a t e r e m i t t a n c e (a Bank, Express. o r P o s t Office Money O r d e r , o r a cheque, m a d e payable t o the R e c e i v e r G e n e r a l of Canada, c r e d i t NRC) t o the
National R e s e a r c h Council of Canada, Ottawa. K1A OR6.
Stamps a r e not acceptable.
A l i s t of a l l publications of the Division is available and
m a y be obtained f r o m the Publications Section, Division of Building R e s e a r c h , National R e s e a r c h Council of