Publisher’s version / Version de l'éditeur:
Canadian Journal of Civil Engineering, 13, 2, pp. 140-49, 1986-04
READ THESE TERMS AND CONDITIONS CAREFULLY BEFORE USING THIS WEBSITE. https://nrc-publications.canada.ca/eng/copyright
Vous avez des questions? Nous pouvons vous aider. Pour communiquer directement avec un auteur, consultez la première page de la revue dans laquelle son article a été publié afin de trouver ses coordonnées. Si vous n’arrivez pas à les repérer, communiquez avec nous à PublicationsArchive-ArchivesPublications@nrc-cnrc.gc.ca.
Questions? Contact the NRC Publications Archive team at
PublicationsArchive-ArchivesPublications@nrc-cnrc.gc.ca. If you wish to email the authors directly, please see the first page of the publication for their contact information.
NRC Publications Archive
Archives des publications du CNRC
This publication could be one of several versions: author’s original, accepted manuscript or the publisher’s version. / La version de cette publication peut être l’une des suivantes : la version prépublication de l’auteur, la version acceptée du manuscrit ou la version de l’éditeur.
Access and use of this website and the material on it are subject to the Terms and Conditions set forth at
Ice pressures and behaviour at Adams Island, winter 1983/1984
Frederking, R. M. W.; Wessels, E.; Maxwell, J. B.; Prinsenberg, S.; Sayed,
M.
https://publications-cnrc.canada.ca/fra/droits
L’accès à ce site Web et l’utilisation de son contenu sont assujettis aux conditions présentées dans le site
LISEZ CES CONDITIONS ATTENTIVEMENT AVANT D’UTILISER CE SITE WEB.
NRC Publications Record / Notice d'Archives des publications de CNRC:
https://nrc-publications.canada.ca/eng/view/object/?id=bca510ee-5f3a-48cf-bae1-9668fd8a5d33 https://publications-cnrc.canada.ca/fra/voir/objet/?id=bca510ee-5f3a-48cf-bae1-9668fd8a5d33Ser
vu1 I I L L
N21d
FJCI
National Research
Conseil national
Council Canada
no. 1379
de recherches Canada
c. 2
BrnG
Institute for
lnstitut de
- --
Research in
recherche en
Construction
construction
Ice Pressures and Behaviour at Adams
Island, Winter 1983/1984
by R. Frederking, E. Wessels, J.B. Maxwell et al
ANALYZED
Reprinted from
Canadian Journal of Civil Engineering
Vol. 13, No. 2, 1986
p. 140-149
(IRC Paper No. 1379)
Price $2.00
NRCC 25950
N R C-
CISTI1
BLDG.
RES.L I B R A R Y
I
06-
07-
3
B I B L t O T W E P U E
?-
-:* qdfim.=
J R C-
lCl%r I CT h i s p a p e r i s being d i s t r i b u t e d i n r e p r i n t form by t h e I n s t i t u t e f o r R e s e a r c h i n C o n s t r u c t i o n . A l i s t of b u i l d i n g p r a c t i c e and r e s e a r c h p u b l i c a t i o n s a v a i l a b l e from t h e I n s t i t u t e may be o b t a i n e d by w r i t i n g t o t h e P u b l i c a t i o n s S e c t i o n , I n s t i t u t e f o r R e s e a r c h i n C o n s t r u c t i o n , N a t i o n a l Research C o u n c i l o f C a n a d a , O t t a w a , O n t a r i o ,
K1A
0R6.C e document est d i s t r i b u 6 s o u s forme de t i r 6 - 3 - p a r t p a r 1' I n s t i t u t de r e c h e r c h e e n c o n s t r u c t i o n . On p e u t o b t e n i r une l i s t e d e s p u b l i c a t i o n s de 1 ' 1 n s t i t u t p o r t a n t s u r les t e c h n i q u e s ou l e s r e c h e r c h e s e n
matisre
d e b d t i m e n t e n B c r i v a n t 3 l a S e c t i o n d e s p u b l i c a t i o n _ s , _ . T n c t i tnt rle rprher&p en-
c o n s t r u c r r e c h e r c h e ,KIA OR6.
Ice pressures and behaviour at Adams Island, winter 198311984'
R. FREDERKING
Division of Building Research, National Research Council of Canada, Ottawa, Ont., Canada KIA OR6
E. WESSELS
Hamburgische SchifJbau-Versuchsanstalt GmbH, Postfach 600 929, 02000 Hamburg 60, West Germany
J. B. MAXWELL
Atmospheric Environment Service, Environment Canada, 4905 Dufferin Street, Downsview, Ont., Canada M3H 5T4
S
.
PRINSENBERGAtlantic Oceanographic Laboratory, Fisheries and Oceans Canada, Bedford Institute of Oceanography, Dartmouth, N.S., Canada B2Y 4A2
AND M. SAYED
Division of Building Research, National Research Council of Canada, Ottawa, Ont., Canada KIA OR6
Received July 16, 1985
Revised manuscript accepted November 1, 1985
As a continuation of an ongoing project, measurements of environmental conditions and ice cover responses were made around Adams Island over the winter of 1983/1984. These included current, tide, speed and direction of wind, air temperature, and thickness, temperature, and salinity of the ice. Wind profiles were measured over the ice surface; from these, drag coefficients of 0.001 -0.005 were calculated. Horizontal movement rates of the ice cover varied from 20 to 300 mm/day. No direct correlation was found between ice cover movement and the wind and current measurements. In situ ice pressures measured around the island averaged 250 kPa.
Key words: ice pressures, environmental forces, ice behaviour, field instrumentation.
Dans le cadre d'un projet dCja en cours, les conditions environnementales et le comportement du manteau glacial autour de I'ile Adams ont CtC mesurCs au cours de I'hiver 1983- 1984. Les ClCments suivants ont fait I'objet de mesures : courants, makes, vitesse et direction des vents, tempCrature de I'air et Cpaisseur, tempkrature et salinitC de la glace. Des profils de vent ont CtC mesurks 2 la surface de la glace; les coefficients de trainee calculCs a partir de ces donnCes variaient entre 0,001 et 0,005. Les vitesses de dCplacement horizontal du manteau glacial variaient entre 20 et 300 mm/jour. Aucune corrClation directe n'a pu &tre ttablie entre le deplacement du manteau glacial et les mesures des vents et des courants. Les pressions glacialles mesurkes autour de I'ile se situaient en moyenne 2 250 kPa.
Mots cle's: poussCe glacialle, forces environnementales, comportement de la glace, instrumentation sur le site.
Can. 3. Civ. Eng. 13, 140-149 (1986)
Introduction
The design of marine structures in the Arctic requires knowl- edge of ice behaviour, from which design ice loads can be established. This problem has two aspects: ice behaviour in relation to the environment and ice loads in response to the resulting ice behaviour. Only by an understanding of both aspects of the problem can experience gained at one location or under a given set of circumstances be successfully transferred to another one.
The information available on ice behaviour and loads on off- shore structures is limited. Extensive ice-monitoring programs - - -
have been canied out for petroleum exploration structures in the nearshore part of the Beaufort Sea, but only a small part of these results have been fully published (Metge 1976; Semeniuk 1977; Strilchuk 1977). The remainder are proprietary, with the methods of measurement published but no results (Pilkington et al. 1983; Hawkins et al. 1983).
Although most of the offshore exploration activity in the Arctic is in the Beaufort Sea area, it is desirable to obtain NOTE: Written discussion of this paper is welcomed and will be received by the Editor until July 31, 1986 (address inside front cover). 'Presented at the 7th Canadian Hydrotechnical Conference, Saska- toon, Saskatchewan, May 30-31, 1985.
information from areas of the Arctic where conditions are dif- ferent. For such studies, small islands may simulate the effects of man-made structures on ice covers. This approach has been used in investigations of large multiyear floe impacts on Hans Island (Danielewicz et al. 1983) and first-year sea ice rubble
formation at Fairway Rock (Kovacs and Sodhi 1981). A similar study in progress at Adams Island in the Lancaster Sound area (Frederking et al. 1983) is the subject of this paper.
The project involves a number of participants and has extended over three winter seasons. The National Research Council Canada coordinates the project and is involved in mea- surement of movements and large-scale deformations of the ice
-
cover, as well as in characterization of ice behaviour. The Atmospheric Environment Service is involved with the mea- surement of air temperature, wind, and drag, and the Depart--
ment of Fisheries and Oceans, with measurement of current and tide. C-CORE is involved with strain measurement in the ice cover. The Hamburg Ship Model Basin is carrying out in situ stress measurements in the ice cover.The primary objective is to determine the response of the ice cover to climatological and oceanographic driving forces, and the consequent ice interaction with the island. Results for the winters of 198 11 1982 and 19821 1983 have been reported (Frederking et al. 1983, 1984). The work of the 198311984
,
U S I I A L D I I E C T I O N O f ICE b A o v f h 4 E H T ~ _ _ _ _ d - - - _ _ _ _ _ _ _ _ _ _ _ USUAL LP.NU:aSl I C t E D G E---
BkFrlM l 5 L A N D)'
,
n O A R u l N ~ ~ l , ~ ( ~ $ ~ ~ i D 1 0 R D E N P I I I I N I U L A + I + ,. + 7 3 ' 3 5 ' M \ I M E T , S l h l l O H ~ \ I \+
+
+ 7 3 " 3 0 ' N 82"OO'W 8 l S 3 0 ' W 8 l 0 0 O ' W 8 O 0 3 O ' WFIG. 1. Location map of study area.
winter was conducted during three 2-week long site visits, made in November (immediately following freeze-up), March (mid-winter), and May (immediately preceding breakup), when intensive observations and measurements were made. Also, unattended data loggers were used to record measure- ments between site visits. This paper reports measurements of environmental factors, i.e., wind, current, tide, and tempera- ture, and movements, deformations, strains, and stresses in the ice cover adjacent to the island for the winter 1983/1984. A preliminary interpretation of some of the results is presented.
Site description
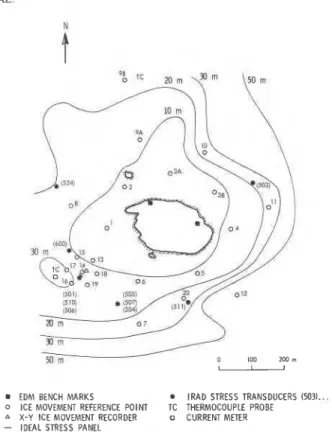
The area of investigation is at the intersection of Lancaster Sound and Navy Board Inlet (7304S1N, 81°30'W, Fig. 1). Lancaster Sound, the eastern entrance to the Northwest Pas- sage, extends from Baffin Bay into the islands of the Canadian Arctic. There is a general movement of ice through Lancaster Sound from west to east under the action of wind and current. Navy Board Inlet is a fiord-like feature, which also connects to Baffin Bay through Eclipse Sound and Pond Inlet. Lancaster Sound and Navy Board Inlet have water depths reaching 800 and 400 m, respectively. A sill at their intersection does not exceed 200 m depth and, for the most part, is less than 100 m deep. The maximum water depth between Adams Island and the Borden Peninsula is 30 m. The tidal range is about 1.5 m. Adams Island is situated about 3 km offshore from a base camp (Borden Station) on the Borden Peninsula (Fig. 1). Borden Station, established by the Department of Fisheries and Oceans, comprises accommodation buildings, a generator house and shop, and a 300 m long air strip and provides a base for operations in the area. A detailed map of the island and local bathymetry is shown in Fig. 2. The island is rocky with steep
-
cliffs on the north side. The maximum elevation of the island (20 m) is on the northern side with gradual slopes to the east,*
south, and west. The south shore is also near vertical with an
- escarpment about 4 m high. The beaches are rocky and rela-
tively steep. As can be seen in Fig. 2 the slope of the very rocky sea bottom is gradual to the north and west. The steepest submarine slope is to the southeast.
First-year ice normally forms in the middle part of Navy Board Inlet in October, becomes landfast, and progresses north- ward up the Inlet, reaching Lancaster Sound in November. The island is generally at the boundary between level and ridged ice. Shear and pressure ridges make up a zone of ridged ice,
.KING ET AL. 141
i
PO0 ' ' n r n l B r n \ 5 0 m
EDM BENCH MARKS I R A D STRESS TRANSDUCERS (503) ...
0 ICE MOVEMENT REFERENCE POINT TC THERMOCOUPLE PROBE
A X-Y ICE MOVEMENT RECORDER o CURRENT METER
-
IDEAL STRESS PANELRG. 2. Adams Island showing instrumentation, ice movement array, and bathymetry, 1983-1984.
which becomes landfast ice in mid-winter to a distance of about 5 km north of the island. During the open-water season, multi- year ice from the Arctic Archipelago moves through Lancaster Sound to be discharged into Baffin Bay. Similarly, icebergs from the glaciers of Greenland and Ellesmere Island circulate in the Sound. Some of these bergs pass into Navy Board Inlet and are frozen into the ice cover while others ground on the sill at the entrance to the Inlet. Typically there can be 5 to 10 large icebergs within 10 km of Adams Island. Multiyear ice is also frozen into the ice cover and may reach coverages of 1-5%. The ice pack in Lancaster Sound is generally dynamic through- out the entire winter, although there have been occasions when it has frozen over completely (Dey 1981), as was the case for the winter 1982/1983.
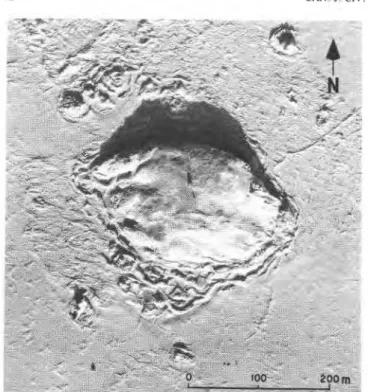
During a site visit November 14-29, 1983, the ice in the study area was already landfast, with a thickness of 70 cm at the end of the period. The edge of the landfast ice was about 5 km to the north of the island. The March site visit showed no substantial change in ice conditions immediately around the island. Level first-year ice thickness had increased to 1.4 m, and by early May it was 1.8 m. On March 12 an aerial photog- raphy survey was carried out in the area. A photograph of the ice around the island appears in Fig. 3. Buckling features can be seen in the ice cover around the southern perimeter of the island. The ice is mostly first year, with occasional small multi- year floes and bergy bits.
Environmental driving forces
Climate
A mesoscale climate network was designed for the Adams Island area in order to provide adequate climate information for the evaluation of wind stress imposed on the surrounding sea ice. This network (Fig. 1) was composed of two profile stations (wind and air temperature recorded at three different
142 CAN. I, CIV. EN( j. VOL. 13. 1986
FIG. 3. Aerial view of ice conditions around Adams Island, March
13, 1984.
I
-
A D A M S I S L A N DI
- 1 5 W E S T P R O F I L E U " -20 W w 3 + -25 a E Y a5
-30 + -35-
40 5 10 15 20 2 5 30 M A R C HFIG. 4. Air temperature comparison between Adams Island and
West Station, 1984.
levels-2.5. 5, and 10 m) located on the ice (West Profile
Station and South ProfiIe Station) and three stations recording
at the 10 m level only, one station on the ice (East Station), and
the other two on land (Borden Station and Adams Island). For
the winter of 1983,' 1984, data were collected beginning in late
February and continuing until late April to early May, during
which time collection ceased owing to polar bear damage at
most sites.
Only
Borden Station continued in operation until thesites were inspected (and the on-ice stations were dismantled)
in mid-May.
During the March-April period, air temperature values and
changes were uniformly reflected across the network (Fig. 4).
The coldest temperatures were in the -35 to -40°C range
during the week of March 3-10, with extremes just below
-40°C on March 10. Later cold periods with temperatures near
-35°C accurred just after the middle of March and again in
early April. These two cold events bracketed the warmest par-
0 % 20% 40 % 60% 80% 100%
W l N D S P E E D , 10 k m l h I N C R E M E N T 7 4 4 D A T A P O I N T S
FIG. 5 . Borden Station wind rose for March 1-31, 1984.
W l N D D I R E C T I O N , d e g
3 4 8 D A T A P O I N T S
RG. 6. Drag coefficients for South Profile Station versus wind
direction, February 27 to May 17, 1984.
tion of March, when temperatures reached near - 15°C. There-
after, there was a general warming trend to near freezing by the second week of May.
Winds during March were predominantly from the west at all five stations, most noticeably so at Borden Station (Fig. 5) and West Profile Station, where frequencies in the 40-50% range occurred. The latter two stations apparently reflect the westerly channelling influence of Lancaster Sound at this time of year. At Adams Island, South Profile Station, and East Station, all
progressively further into Navy Board Inlet, the westerly wind
-
frequencies are reduced in favour in increases in northwesterly and southerly winds (which are more closely aligned with the north-south orientation of the Inlet). At all locations, south- easterly winds were an important component of the wind re- gime, occurring some 20% of the time. Highest wind speeds were in the 50-60 km/h range and occurred at Adams Island and Borden Station. In April, westerly winds were again dom- inant, except at West Profile Station, where southwesterly
FREDERKING ET AL. y ( N O R T H ) y ( N O R T H )
A
.. 0-
10 rn - ---- NOVEMBER - F E B R U A R Y 0 10 rn MARCH - MAY-
( a ) MOVEMENTS
__
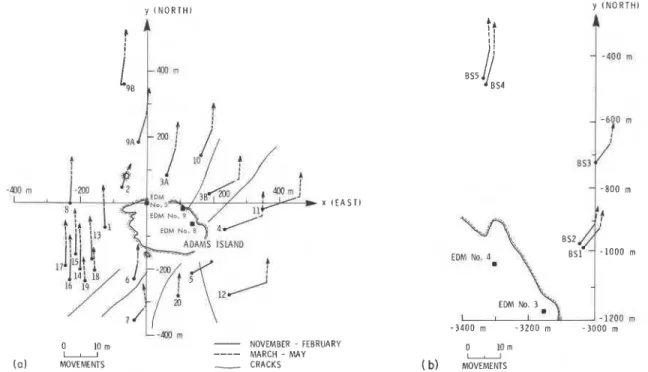
CRACKS ( b) MOVEMENTSFIG. 7. Ice movements at (a) Adams Island, November 1983 to May 1984 and (b) Borden Station, November 1983 to May 1984. winds prevailed 45% of the time. Adams Island had a similar
pattern with 25% southwesterly wind but less frequent west- erly winds (32%). Borden Station recorded the highest wind speeds, with values in the 90- 100 km/h range.
From the wind and temperature data, drag coefficients were calculated, generally following the procedures of Langleben (1972). The occurrences of near-neutral stability conditions were identified for each of West Profile Station and South Profile Station. The criteria used for such conditions included (i) logarithmic profiles fitted to the wind speedlheight data where the correlation between calculated and observed values was 20.99, (ii) those profiles where the absolute value of the Richardson number was 50.04, and (iii) persistence of both criteria (i) and (ii) together for at least two consecutive hours.
The drag coefficients ( C lo) were then calculated as (U,
/
Uwhere U* is the friction velocity as determined from the log
profile and U l o is the 10 m level wind speed. For South Profile
Station, only 348 of the possible 1868 observations conformed
to near-neutral conditions. Figure 6 shows the values of drag
coefficient for those 348 data points as a function of wind direction. There are two clear clusterings of the data. For winds from the south to east-southeast, values of C l o are mainly in the range of 0.001 -0.0016. Ice conditions to the south of the station are quite smooth. For winds from the west-southwest
180" rotation changes, was stuck on "yes" during most of the recording period. However, by carefully inspecting the data and compensating for this problem the following general pic- ture of the current regime can be surmised.
The currents are made up of a mean and tidal component, whose vector sum is directed predominantly into two direc- tions: towards the north during the flooding tide (rising sea surface) and towards the southeast during the ebbing tide. The mean current was between 9 and 12.5 cm/s in a northeast- erly to easterly direction. Tidal currents are made up of diurnal
( K ,
+
0 and semidiurnal tide (M2+
S2). Their amplitudes varied with the lunar cycle and reached 18 cm/s for the diurnal tide and 9 cm/s for the semidiurnal tide. Their directions were in a NW-SE oscillation pattern, which sometimes changed into a more N-S pattern. At times of highest tides (1.9 m), the mean northeasterly flow combined with the strong northwest- erly ebbing tidal current to produce maximum current speeds of 35 cm/s towards the north. These observations du~licated closely' the currents recorded during the previous field year at a location 2 krn northwest of Adams Island and reported in the 1982/1983 results (Frederking et al. 1984) and correspond well with known tidal heights and currents of the LancasterSound - Navy Board Inlet area (Fissel 1982).
to west-northwest, C l o was generally in the 0.002-0.005 Ice movements and deformations
range, reflecting the rougher ice conditions plus the effect of
the higher land of Borden Peninsula some 2-3 km away. An electronic distance measuring (EDM) instrument (Wild
.
These values of C l o bracket values in the literature (Banke et al. DI-20) coupled to a theodolite (Wild T-2) was used to measure1976). For West Profile Station, the drag coefficient results movements of reference points on the ice cover. Prism reflec-
were much less clearly defined and further evaluation will be tors attached to wooden stakes indicated the reference points.
needed. The EDM has an accuracy of 2 5 mm for distances up to
100 m, when corrections are applied for atmospheric density
Oceanography (barometric pressure and temperature). Horizontal and verti-
Currents were measured continuously from November 23, cal angle measurements had an accuracy of k5" of arc. The
1983 to May 18, 1984 by an Aanderaa RCM-4 current meter accuracy of the surveys when checked by closure was about
located 3 m below the surface about 250 m WSW of the island k 2 0 mm. Positions of reference points on the ice were estab-
in a water depth of about 15 m. Readings were taken at 10 min lished by measuring their distance and bearing from fixed
0
-
4-
2 0 2 4E A S T , m
CAN. J . CIV. ENG. VOL. 13. 1986
6
1
-
2 - 1 0 1 2E A S T . m
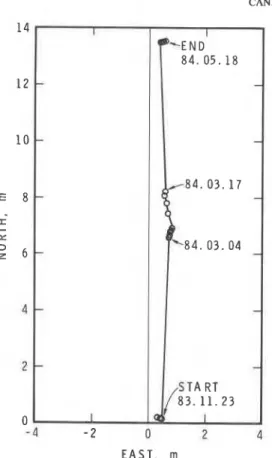
FIG. 8. Horizontal movements of ice cover at reference point 14 as FIG. 9. Horizontal movements of ice cover adjacent to reference determined by successive surveys. point 14 as determined from continuous measurement with wire line
Station and Adams Island base lines were tied to each other. Two arrays of reference points were established on the ice cover in November, one around Adams Island (Fig. 7 a ) and the other adjacent to Borden Station (Fig. 7 b ) . A coordi-
nate system centred on Adams Island, with east the positive
x-direction and north the positive y-direction, was set up to specify the location (in metres) of the reference points and other insmumentation on the ice. In the Borden Station m y , points 852 and 035 were on intermittently grounded multiyear ice features. Points
BS1
md BS4 were on level ice adjacent to thegrounded features. Positions were measured three times in November at 2 day intervals. Another sequence of readings were taken from March 4 to 17 and a final sequence between May 8 and 18. By drawing straight lines between successively measured positions of a reference point, movement vectors can be established. These are plotted in Fig. 7 . The solid lines refer to the movement in the November to February interval and the broken lines to the movement in the March to May interval.
In the first interval (November to February) different move- ment directions were observed in different areas. To the imme- diate west of the island (Fig. 7 a ) the ice moved northwards at an average rate of 65 mm/day. Three kilometres to the west, just off the Borden Station shore (Fig. 7 b ) , movements were remarkably similar, about 75-85 mm/day to the NNE. To the east of the island, movement rates were higher, at 110 mm/day to the ENE. To the north of the island, rates were about 90 mm/day to the NNE, similar to Borden Station move- ments. In the second interval (March to May) the movements of all the reference points were essentially northward. Average rates were 80- 110 mm/day, with the higher rates north of the island.
To illustrate ice movements in more detail the successive locations of reference point 14 are shown in Fig. 8. Movements
system.
in November were towards the east at 100-200 mm/day. Subsequently they were to the north at 65- 100 mm/day. A question is raised about the actual ice movements during the long intervals between site visits. To answer this, some type of continuous recording device is needed.
A wire line device supplied by Arctec Canada Ltd. was used to measure the horizontal movement of the ice cover con- tinuously between site occupations. It comprised two wires anchored to the seabed. Each wire was attached to a spool whose rotation could be measured. The rotation, and hence the ice movements, was measured every 15 min and logged on a battery-powered data logger. A continuous record was obtained from March 5 until May 8. Because of the large tidal range, cyclic variations were superimposed on the long-term varia- tions of the amount of wire played out. Determination of actual horizontal movements is complicated by these tidal variations, wire sag under its own weight and current drag, and occasional sticking of the wire line where it passes through the ice cover. Tidal effects were eliminated by taking 48-h averages. Wire sag was neglected and the wires were assumed to be stretched into a straight line. The results are plotted in Fig. 9. The device was located close to reference point 14. It can be seen from
-
Figs. 8 and 9 that there was no radical departure of the actual movement from average movements determined from succes--
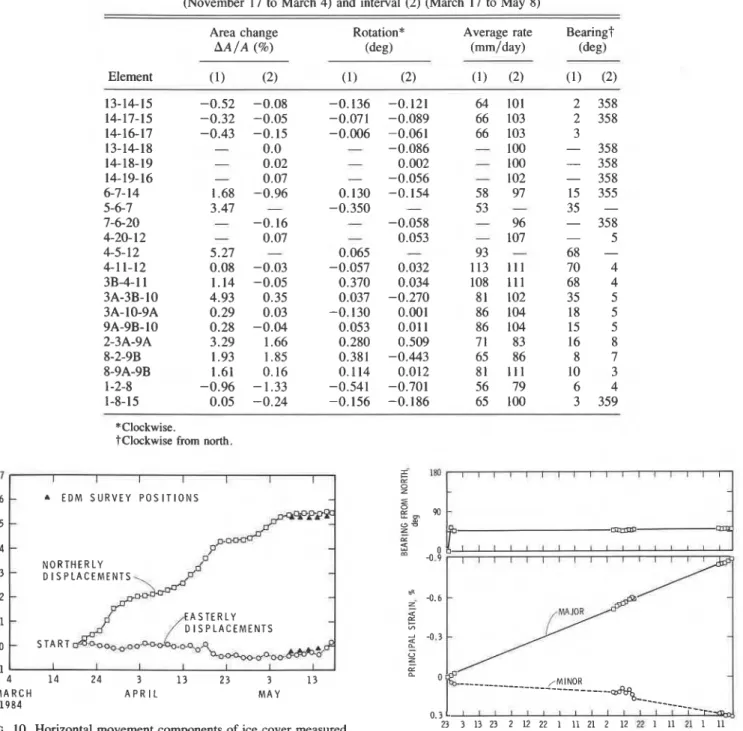
sive surveys.Because continuous results were available, movements were plotted on a time basis in Fig. 10. Also shown in this figure are movements determined by surveys. The two measure- ments agree reasonably well. The long-term movement direc- tion of ice cover was relatively steady. Movement rates, on the other hand, varied considerably, from 20 mm/day to about 300 mm/day
.
FREDERKING ET AL.
TABLE I . Area change, rotation, and average velocity of triangular elements for interval (1) (November 17 to March 4) and interval (2) (March 17 to May 8)
Area change Rotation* Average rate Bearing?
AA/A (%) (deg) (mm/day) (deg)
Element (1) (2) (1) (2) (1) (2) (1) (2) 13-14-15 -0.52 -0.08 -0.136 -0.121 64 101 2 358 14-17-15 -0.32 -0.05 -0.071 -0.089 66 103 2 358 14-16-17 -0.43 -0.15 -0.006 -0.061 66 103 3 13-14-18
-
0.0-
-0.086 - 100 - 358 14-18-19 - 0.02 - 0.002-
100 - 358 14-19-16-
0.07-
-0.056-
102 - 358 6-7- 14 1.68 -0.96 0.130 -0.154 58 97 15 355 5-6-7 3.47 - -0.350-
53-
35 - 7-6-20-
-0.16-
-0.058-
96 - 358 4-20- 12-
0.07-
0.053 - 107 - 5 4-5- 12 5.27 - 0.065-
93-
68 - 4-1 1-12 0.08 -0.03 -0.057 0.032 113 111 70 4 3B-4- l l 1.14 -0.05 0.370 0.034 108 111 68 4 3A-3B-I0 4.93 0.35 0.037 -0.270 81 102 35 5 3A- 10-9A 0.29 0.03 -0.130 0.001 86 104 18 5 9A-9B- I0 0.28 -0.04 0.053 0.011 86 104 15 5 2-3A-9A 3.29 1.66 0.280 0.509 71 83 16 8 8-2-9B 1.93 1.85 0.381 -0.443 65 86 8 7 8-9A-9B 1.61 0.16 0.114 0.012 81 111 10 3 1-2-8 -0.96 -1.33 -0.541 -0.701 56 79 6 4 1-8-15 0.05 -0.24 -0.156 -0.186 65 100 3 359 *Clockwise.tclockwise from north.
-
1 4 1 4 M A R C H 1 9 8 4 2 4 3 1 3 2 3 3 1 3 A P R I L M A Y D I S P L A C E M E N T S S P L A C E M E N T S . .FTG. 10. Horizontal movement components of ice cover measured 23 3 13 23 2 12 22 1 11 21 2 12 72 1 11 21 1 11
with x-y movement recorder and EDM at reference point 14 adjacent 1983 DEC JAN 1984 FEB MAR APR MAY
to Adams Island, March to May 1984.
RG. 1 1. Princioal strains and orientations for element 14-16-17.
Detailed examinations were made of relative movements of the reference points in the Adams Island array. The area
-
change, rotation, average movement rate, and direction of a.
number of triangular elements defined by three neighbouringreference points were calculated and are summarized in Table
+ 1. The proportional change of area of an element (AA /A) is the
change in area of an element (AA) divided by the initial area of that element (A). Rotation is the average rotation of the three sides of the element. Average rate and bearing are the average rate of movement and direction of the three reference points defining the element.
Elements to the west of the island showed area loss or com- pression (AA/A negative), while the other elements showed area gain. The area gains in elements to the south, east, and
Adams Island, November 1983 to May 1984 (positive strain is tension).
north are largely due to the formation of cracks in these areas (Fig. 7a). Elements to the east of the island have a counter- clockwise rotation and those to the west, a clockwise rota- tion. The general movement of the ice during the first period
(November 27 - March 4) was towards the north, with the ice
cover cracking and moving around the island. This is demon- strated in the large area gains in elements 5-6-7 and 4-5-12 and the northeasterly movement vectors for the element to the east
of the island. During the second interval (March 17
-
May 8),a period in which the ice cover was warming, there was a pronounced area loss on the south (upstream) side of the island
CAN. J. CIV. ENG. VOL. 13. 1986
4(iQllIl
s , , , , I I I I I ~ I I . I ~ I ~ ~ ( I , I . , I I " I SECTORSI-
It".
SECTORS ( a 1 -a
0-0.5 m@
1.0-1.5rn
300-
- tu@
0.5-1.0m
@
1.5-2.0rn
a Y . , , , , , . , , . 1 A " " f .;:,:,. :,,:, - : , - . , , , , , I : , l : , i ! t : , , , , ,,; ' I! b + ,/, ,0
1 , : : ; : : ;v;
200- : , . . . , . I.. , , , , : , , , .,:. , , , ,:: j-::, v, , Y . , , {:,.*; : &;.- ",., . . ] . < 1 ' -3. < \ : , - W , ,, . ,, -,: , ' .;: : ' @i?:L,,
: , : * , , :* , , r , , I : . . . . .-
I- ... v, 1 . 100 -ii:
* .: ,!,, 2. ' -.--
2030
1
10
20
301 4 M A R C H 1984 A P R I L M A Y 10I
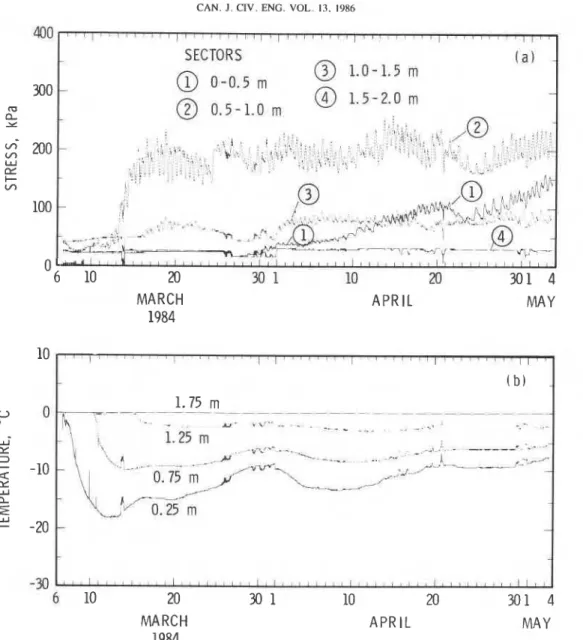
I / I I " ' i I " ' ( I ' " ' I I 6 10 20 30 1 10 20 301 4 M A R C H A P R I L M A Y 1984FIG. 12. (a) Stresses measured in each sector by 1 m wide X 2 rn deep IDEAL stress panel, Adams Island, March to May 1984. (b) Tempera- tures in the stress panel at selected depths from ice surface.
Data on the change in distance between any two reference points could be used to determine strains in the plane of the ice cover. These strains were determined over gauge lengths from 30 to 200 m, scales over which the ice is not necessarily a homogeneous body. Therefore, the resulting strains are aver- age or bulk values applicable to the distance over which they were measured. (Local strains measured over gauge lengths of 1 m could be substantially different.) Given the uncertainty in the location of the reference points, the strains determined were accurate to about
Principal strains and their orientations were determined for a number of triangular elements around Adams Island. A record for a typical element in a level ice area southwest of the island is presented in Fig. 11. The principal strains varied uniformly over the measurement period and the orientation was constant. For this particular element, the principal compressive strain was oriented towards the island. The total strain change over the 170 day duration of the measurements was in the order of lo-', which yields an average strain rate of about s-I. Strain rates were generally in the order of 10-lo s-I, but for some short time intervals (2 days), strain rates as high as 5 x
S - I were calculated. Strains and strain rates measured over
a smaller gauge length (0.3 m) were similar, i.e. 5 X 10-'Os-' (Stander 1985).
Successive level surveys of the elevation of the ice surface were camed out along six lines extending out from the south side of the island between May 12 and 15. These confirmed the existence and development of ripple-like buckle features in the ice cover. These had three-dimensional geometries with some scatter in size. The buckles had wavelength between 40 and 50 m, amplitude between 0.2 and 0.4 m, and width between 10 and 50 m. The smallest radii of curvature occurred near the tidal crack and were close to 200 m. The corresponding flexural strains and strain rates were of the order of lo-' and s-' ,
respectively.
Stress measurement
Stress panel
A 1 m -wide X 2 m deep panel-type stress transducer ("IDEAL" supplied by Terrascience Systems Ltd.) was used to measure normal stresses in the ice cover. Strain-gauged ele- ments in the panel sense the ice pressure. The panel was sec- tioned into four equal horizontal strips so that a distribution of stresses through the ice cover could be obtained. A thermistor
ING ET AL. 147 FREDER , ~ ~ [ ~ 1 1 1 1 1 1 1 1 STRESS
s
O - O - ~ - ~ - 7 8 9 10 11 12 13 14 15 16 17 18 19 20 21 EASTERN STANDARD T I M E (GMT-51, hFIG. 13. Measured tide and stress, sector 2 of stress panel, March 18, 1984.
was also located at the centre of each of the horizontal strips. The outputs of the strain gauge and thermistors were logged every 15 min on a battery-powered data logger ("ARCDATS" supplied by Arctec Canada Ltd.). The geometry of the panel and its high stiffness give it an inclusion factor of one (Metge
et al. 1975). The panel was located about 15 m south of refer-
ence point 14 (Fig. 2). Ice thickness was 1.4 m. The panel responds only to stress components normal to its face, in this case those acting in a southwest-northeast direction. A con- tinuous record was obtained from March 6, when the panel was installed, until May 3.
Installation was accomplished by drilling holes through the ice cover to create a slot about 150 mm wide through which the panel was placed. The record of stresses versus time for each of the sectors is presented in Fig. 12a, together with the tem- peratures (Fig. 126). The temperatures indicate that some time was taken for the panel to freeze back into the ice cover. The stress is not uniform but varies through the thickness of the ice cover. The maximum stress was at a depth of 0.5 - 1.0 m and fluctuated between 150 and 250 kPa over the measurement period. The stress in the top sector (0-0.5 m) was small but progressively increased to about 150 kPa at the end of the measurement period. This behaviour may be due to the instal- lation procedure for the panel. Possibly contraction of the new ice as it cooled prevented actual contact of the top part of the ice cover with the panel. Only after a sufficiently long time was contact reestablished. Hence a high reliance cannot be placed on the top (0-0.5 m) sector results. There is no obvious rela- tion between the ice stress and ice temperature.
The stress values in the top three sectors show a definite periodicity. When the results were transfomied into the fre- quency domain, peaks were apparent at periods of 12.65 and 6.32 h. These times correspond to the semidiurnal tidal and half tidal period. Although it was not apparent in the frequency analysis, there is a slight indication of a 14 day period in the stress results of sector 2. For a shorter period, tide and stress have been plotted on an expanded time base to illustrate the relation between them (Fig. 13). The stress peaks occur at low tide and the minimums at high tide. There is also a secondary peak halfway between high and low tide, a time at which the current velocity would be at a maximum.
Biaxial stress transducers
A number of small 50 mm diameter cylindrical transducers supplied by IRAD Gage (type VBS-3) were also used to mea- sure in situ stresses in the ice. These transducers are capable of determining magnitude and direction of the principal stresses in
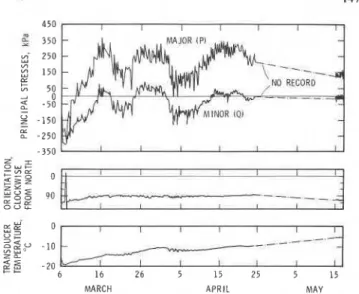
MARCH A P R I L M A Y
FIG. 14. Principal stresses, orientation and, temperature of IRAD
biaxial stress transducer 510, 0.66 m depth in ice, Adams Island, March to May 1984.
the plane of the ice cover. Controlled laboratory tests by Cox and Johnson (1983), with the transducer in ice, demonstrated that the sensor has a low temperature sensitivity (5 Wa/"C), a resolution of 20 kPa, and an accuracy of better than 10% under a variety of loading conditions.
Ten of these biaxial ice stress sensors were deployed in the first-year level ice around Adams Island. The locations are shown in Fig. 2; a three-digit number in parentheses identifies each gauge. Normal installation depth was about 200 mm, but at two locations transducers were also installed at depths of about 700 and 1000 mm. In this manner distribution of stresses around the island, as well as through the depth of the ice cover, could be determined. The transducers were all connected to a data logger on which a record from March 6 to April 26 and May 15 to 17 was obtained. Reading frequency was once every 4 h. At the end of the measurement period the transducers were sawed free of the ice cover to obtain a check on the zero reading. Indications were that the zero had shifted so that 50-80 kPa would have to be added to the later results.
The results from transducer 510, near reference point 14 in Fig. 2, at a depth of 660 mm are presented in Fig. 14. The major principal compressive stress was about 350 kPa and was oriented about 90" clockwise from north. The minor principal stress was much smaller and was tensile for a part of the time. Both stresses show a close coupling to the semidiurnal tides. The results from a transducer at the same location but a depth of 200 mm showed a similar pattern of stress variations, but slightly larger magnitudes. A transducer at a depth of 1050 mm showed much lower stresses, less than 100 Wa. The orientation of the major principal stress at this location averaged about 65" clockwise from north.
The stress distribution in the ice cover around Adams Island is summarized in Table 2. These represent the maximum stresses during the measurement periods noted. On March 31 the temperature at a depth of 20 cm dropped by 5"C, and at a depth of 66 cm, by 2°C (Fig. 14). There was a corresponding rapid drop in the major and minor principal stresses. Thus the measured stresses may have been thermally related. Stresses on all three sides of the island were compressive and relatively similar in value. The orientation of the maximum compressive stresses was generally towards the islasd, as typified by the orientations on April 14 (Table 2).
148 CAN. 1. CIV. ENG. VOL. 13, 1986
TABLE 2. Maximum principal compressive stress and orientation determined from IRAD transducers at a depth of 200 mm in ice covers
Stress (kPa)
Bearing from Gauge March 10 to March 19 to April 2 to north,
NO. March 19 April 2 April 22 April 14 (deg) 503 320 340 220 36 51 1 380 285 380 168 505 400 360 460 4 50 1 320 370 340 43 600 500 380 370 77 Discussion
The movements of the ice cover were examined in terms of wind, current, tide, and ice temperature. Horizontal move- ments shown in Fig. 10 indicate a certain pattern with the periods of high movement rates apparently coupled to periods of high daily tidal range. Close comparison of this record with tide, however, shows that the relation between these two fac- tors is not consistent. This may be a result of the smoothing done in the analysis. On the other hand, periods of rapid ice movement apparently correspond to times when the ice cover was warming more rapidly (see temperatures for 0.25 m depth in Fig. 12b).
It has been argued that horizontal movements of landfast ice are due to thermal expansion of the ice cover. This does not appear to be the case in the Adams Island area. The ice cover movement rates were similar during the early part of the winter (November to February while the ice cover was cooling) and the latter part of the winter (March to May while the ice cover was warming). The only noticeable difference between these two periods was that the movement rates were on average 30% higher in the warming period (on Table 1). Thermal effects superimposed on some other larger factor could account for this difference in rates.
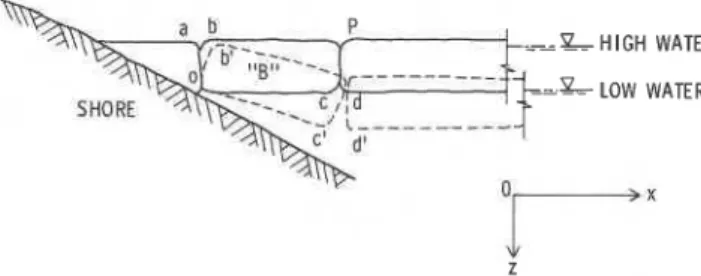
Another process that could explain the observed ice move- ments is tidal jacking. This has been used to explain ice move- ments measured at the Nanisivik Wharf site (Frederking and Nakawo 1984). The process of tidal jacking on a natural shore is idealized in Fig. 15. As the tide falls, ice piece "B" rotates around point 0 , moving point P downwards (positive z-direc- tion) and away from shore (positive x-direction). This would be consistent with the higher ice pressures observed at low tide (Fig. 13). It is also reasonable to assume that during a tidal cycle a small layer of ice would form in the gaps, aOb, and cPd, so that at high tide point P would not come back to its original position in the x-coordinate direction, but undergo some net movement in the positive x-direction. Even in mid- May, when ice temperatures are in the range -2 to -5"C, up to 10 mm of slush will form on the inside of a hole drilled through the ice cover.
To explain the northward movement of the ice cover at Adams Island a die-extrusion process is hypothesizes. Navy Board Inlet is about 15 km wide and is intempted by a sharp dog-leg about 60 km south of Borden Station. Compressive strains in the east-west direction are generated by the tidal jacking process along the eastern and western shores of the inlet. This results in a transverse extensional strain in the north-south direction. Lancaster Sound at the north end of Navy Board Inlet is a free boundary and the dog-leg at the south end, a fixed boundary. The extensional strain under the bound- ary conditions described would be translated into a northward
i
FIG. 15. Schematic of tidal jacking process.
movement at the north end of the system. At present this hypothesis is conjecture but measurements and analysis are being undertaken to verify it.
Similarly the ice movement record was compared with ice pressure records from the panel and biaxial transducers. There was no obvious relation between the panel stress and the ice movements, but in the case of the biaxial transducer the high movement rates (300 mm/day) of March 25-29 and April 13- 19 (Fig. 8) correspond to large major principal stresses (about 250 kPa in Fig. 12), while the low movement rate (20 mm/day) period (April 2- 10) corresponds to a smaller major principal stress (about 100 kPa in Fig. 12). There is about an order of magnitude variation between the low and high movement rates. Using the reference stress method (Ponter
et al. 1983) or the plastic limit method (Michel 1978; Ralston 1978), this range of movement rates should be reflected by a factor of about 3 variation in stress. The observed variation in stress here was about 2.5. (Any attempt at this time to make direct predictions of ice pressure from ice movement rate infor-
mation is subject to a number of difficulties (Sanderson 1984).
1
The results are very much a function of the assumptions used Iin defining the strain rate and the indentation coefficient, either of which can vary by a factor of 2. Added to this is the limited base of mechanical properties data on sea ice. Therefore a critical comparison of the above methods with the results of this field project is beyond the scope of this paper.)
The short-term variations in panel stress were very closely related to tide (Fig. 11). At this time it is not possible to postulate an explanation for the relation; similar behaviour has been noted in the ice adjacent to the dock at Nanisivik (K. R. Croasdale, personal communication), i.e., higher stress at low tide.
The results from the two types of ice pressure measuring transducers are similar. The panel was oriented about 50" clockwise from north and the orientation of the major principal stress from the biaxial transducer was about 65" clockwise from north. Therefore the biaxial transducer should yield higher stresses. The general pattern of the stresses is similar, i.e., maximums for March 15-18, March 25-28, and April 14- 17, and minimums for March 23-24, April 4-9, and April 25-26. The absolute maximum stress recorded with the panel was 250 kPa and the maximum average stress through the top 1.5 m of the ice cover was 150 kPa. With the biaxial transducer the maximum stress was 350 kPa and the maxi- muin average stress through the ice cover was estimated to be 250 kPa. These average stresses are higher than the 120 kPa determined at the same site in the spring of 1983 (Frederking
et al. 1984).
Meteorological, oceanographic, ice movement, and ice pressure data are currently all in different computer data sets. This makes systematic searching of all the results for cor-
FREDERKING ET AL. 149
relations impossible. Much further work will be required in analysis of all these data. The purpose of this paper has been primarily to catalogue the data collected and to provide a pre- liminary interpretation.
Conclusions
Horizontal movements of the landfast ice cover adjacent to
-
+ Adams Island show regular patterns on both a spacial and tem-i poral basis. Rates varied from 20 mm/day up to 300 mm/day
with an average of about 100 mm/day. Movement direction was between north and northeast from November 1983 until May 1984.
Wind, air temperature, current, and tide all have an influence on ice movements but an adequate explanation for the coupling of these factors to ice movement is not evident at this time. The tidal jacking process hypothesized offers a reasonable explana- tion for horizontal movements of the ice cover.
The maximum stress levels appear to be concentrated in the top half of the ice cover and related to temperature change in, and movements of, the ice cover. The maximum average stress measured on approximately 1.5 m thick, slowly moving land- fast ice cover adjacent to Adams Island in the March to May period was about 250 kPa.
The results of this investigation indicate that in areas with ice conditions similar to those of the study area, i.e., landfast first-year sea ice moving at rates of 0.3 m/day or less, the maximum winter ice pressure on a wide structure (200 m) is 250 kPa (equivalent load of 90 MN for 1.8 m thick ice). Engineers should not use the above results directly as design ice loads but rather as reference values against which design loads can be compared.
Acknowledgements
The financial support of the Panel of Energy Research and Development is gratefully acknowledged. The logistic support provided by the Polar Continental Shelf is greatly appreciated, as is the use of the facilities at Borden Station, owned by the Canadian Department of Fisheries and Oceans. Technical sup- port in the field was provided by the Arctic Research Estab- lishment, Pond Inlet. British Petroleum supported this work through the loan of instruments. Assistance in preparations and in the field provided by P. Jochmann of Hamburgische Schiffbau-Versuchsanstalt; J . D. Neil, Technical Officer, National Research Council of Canada; A. H. Headley and D. M. Nichol, Atmospheric Environment Service; C. Labine, Campbell Scientific; and J. Cushon, graduate student, Uni- versity of Waterloo, is gratefully acknowledged. Financial support of the German Ministry of Research and Technology
1 made possible the participation of Hamburgische Shiffbau-
Versuchsanstalt in the project. This paper is a contribution from the Division of Building Research, National Research Council of Canada.
BANKE, E. G., SMITH, S. D., and ANDERSON, E. J. 1976. Recent measurements of wind stress on Arctic sea ice. Journal of the Fisheries Research Board of Canada, 33, pp. 2307-2317. COX, G. F. N., and JOHNSON, J. B. 1983. Stress measurements in ice.
U.S. Army CRREL Report 83-23. Cold Regions Research and Engineering Laboratory, Hanover, NH.
DANIELEWICZ, B. W., METGE, M., and DUNWOODY, A. B. 1983. On estimating large scale ice forces from deceleration of ice floes. VTT Symposium 38, 7th lnternational Conference on Port and Ocean Engineering under Arctic Conditions, Helsinki, Finland, Vol. 4, pp. 537-546.
DEY, B. B. 198 1. Shipping routes, ice cover and year-round naviga- tion in the Canadian Arctic. Polar Record, 20(129), pp. 549-559.
FISSEL, D. B. 1982. Tidal currents and inertial oscillations in north- western Baffin Bay. Arctic, 35(1), pp. 201 -210.
FREDERKING, R., and NAKAWO, M. 1984. Ice action on Nanisivik wharf, winter 1979- 1980. Canadian Journal of Civil Engineering, 11(4), pp. 996-1003.
FREDERKING, R., SANDERSON, T., WESSELS, E., and INOUE, M.
1983. Ice behaviour around a small Arctic island. VTT Symposium 28, 7th International Conference on Port and Ocean Engineering under Arctic Conditions, Helsinki, Finland, Vol. 2, pp. 875-887.
FREDERKING, R. M. W., SAYED, M., WESSELS, E., CHILD, A. J., and
BRADFORD, D. 1984. Ice interaction with Adams Island, winter 1982- 1983. Proceedings, lnternational Association for Hydraulic Research Ice Symposium, Hamburg, West Germany, Vol. 3, pp.
187-201.
HAWKINS, J. R., JAMES, D. A,, and DER, C. Y. 1983. Design, construction and installation of a system to measure environmental forces on a caisson retained island. VTT Symposium 38, 7th Inter- national Conference on Port and Ocean Engineering under Arctic Conditions, Helsinki, Finland, Vol. 4, pp. 770-779.
Kov~cs, A,, and SODHI, D. 198 1. Sea ice piling at Fairway Rock, Bering Strait, Alaska: Observations and theoretical analysis. 6th lnternational Conference on Port and Ocean Engineering under Arctic Conditions, Quebec, P.Q., Vol. 2, pp. 985- 1000.
LANGLEBEN, M. P. 1972. A study of the roughness parameters of sea ice from wind profiles. Journal of Geophysical Research, 77, pp. 5935 -5944.
METGE, M. 1976. Ice conditions and ice defence at Netserk B-44 and Adgo P-25 during the winter of 1974-75. APOA Report No. 10 1 - 1 . Arctic Petroleum Operators' Association, Calgary, Alta.
METGE, M . , STRILCHUK, A,, and TROFIMENKOFF, P. 1975. On recording stresses in ice. Proceedings, Third lnternational Associa- tion for Hydraulic Research Symposium on Ice Problems, Hanover, NH, pp. 459-469.
MICHEL, B. 1978. Ice mechanics. Les Presses de I'UniversitC Laval, Quebec, P.Q., 499 p.
PILKINGTON, R., BLANCHET, D., and METGE, M. 1983. Full-scale measurements of ice forces on an artificial island. VTT Symposium 38, 7th lnternational Conference on Port and Ocean Engineering under Arctic Conditions, Helsinki, Finland, Vol. 4, pp. 818-834.
PONTER, A. R. S., PALMER, A. C., GOODMAN, D. J., ASHBY, M. F., EVANS, A. G., and HUTCHINSON, J. W. 1983. The force exerted by a moving ice sheet on an offshore structure. Cold Regions Science and Technology, 8, pp. 109-118.
RALSTON, T. D. 1978. An analysis of ice sheet indentation. Pro- ceedings, 5th International Association for Hydraulic Research Symposium on Ice Problems, Lulei, Sweden, Part I, pp. 13-31.
SANDERSON, T. J. 0 . 1984. Theoretical and measured ice forces on wide structures. Proceedings, lnternational Association for Hydrau- lic Research Ice Symposium, Hamburg, West Germany, Vol. 4, pp. 151-207.
SEMENIUK, A. 1977. Ice pressure measurements at Arnak L-30 and Kannerk G-42. APOA Report No. 122- 1 . Arctic Petroleum Oper- ators' Association, Calgary, Alta.
STANDER, E. 1985. The measurement of horizontal and vertical strain at Adams Island, N. W.T.; 1 1 12711983-05/07/ 1984. C-CORE Contract Report, 15 p.
STRILCHUK, A. R. 1977. Ice pressure measurements, Netserk F-40, 1975-76. APOA Project No. 105-1. Arctic Petroleum Operators' Association, Calgary, Alta.