Publisher’s version / Version de l'éditeur:
Journal of the American Ceramic Society, 58, 5-6, pp. 221-227, 1975-06
READ THESE TERMS AND CONDITIONS CAREFULLY BEFORE USING THIS WEBSITE. https://nrc-publications.canada.ca/eng/copyright
Vous avez des questions? Nous pouvons vous aider. Pour communiquer directement avec un auteur, consultez la
première page de la revue dans laquelle son article a été publié afin de trouver ses coordonnées. Si vous n’arrivez pas à les repérer, communiquez avec nous à PublicationsArchive-ArchivesPublications@nrc-cnrc.gc.ca.
Questions? Contact the NRC Publications Archive team at
PublicationsArchive-ArchivesPublications@nrc-cnrc.gc.ca. If you wish to email the authors directly, please see the first page of the publication for their contact information.
NRC Publications Archive
Archives des publications du CNRC
This publication could be one of several versions: author’s original, accepted manuscript or the publisher’s version. / La version de cette publication peut être l’une des suivantes : la version prépublication de l’auteur, la version acceptée du manuscrit ou la version de l’éditeur.
Access and use of this website and the material on it are subject to the Terms and Conditions set forth at
Hydration of 3CAOA12O3 and 3CAOA12O3 + gypsum with and without
CAC12
Traetteberg, A.; Grattan-Bellew, P. E.
https://publications-cnrc.canada.ca/fra/droits
L’accès à ce site Web et l’utilisation de son contenu sont assujettis aux conditions présentées dans le site LISEZ CES CONDITIONS ATTENTIVEMENT AVANT D’UTILISER CE SITE WEB.
NRC Publications Record / Notice d'Archives des publications de CNRC:
https://nrc-publications.canada.ca/eng/view/object/?id=6c872d90-f601-4f46-b619-3bc0b1ebc62c
https://publications-cnrc.canada.ca/fra/voir/objet/?id=6c872d90-f601-4f46-b619-3bc0b1ebc62c
Reprinted from t h e J o u r n a l of T h e American Ceramic Society, Vol. 58, No. 5-6 May-June, 1975 Copyright 1975 by T h e American Ceramic Society
Hydration of 3 C a 0 A1203 and 3 C a 0 A1203
+
Gypsum With and
Without CaCl,
AUD TRAETTEBERG* and P. E. GRATTAN-BELLEW
Materials Section, Division of Building Research, Ottawa, Ontario, Canada Paste samples of tricalcium aluminate alone, with CaCI,, with
gypsum, and with gypsum and CaCI, were hydrated for up to 6 months and the hydration products characterized by SEM, XRD, and DTA. Tricalcium aluminate hydrated initially to a hexagonal hydroaluminate phase which then changed to the cubic form; the transformation rate depended on the size and shape of the sample and on temperature. The addition of CaCI, t o t r i c a l c i u m a l u m i n a t e resulted in t h e f o r m a t i o n of 3 C a 0 . AI,O:,. CaCI, lOH,O a n d 4 C a 0 AI,O,. 13H,O, o r a solid solution of the two. The chloride retarded the formation of the cubic phase 3 C a 0 AI,O,. 6H,O; the addition of gypsum resulted in the formation of monosulfoaluminate with a minor amount of ettringite. When chloride was added to tricalcium aluminate and gypsum, more ettringite was formed, although 3 C a 0 . AI,O,. CaSO., 12H,O and 3 C a 0 AI,O,. CaCI, lOH,O
were the main hydration products. I. Introduction
T
H E hydration of C,,AT with and without CaCI, and CaSO,. 2H,O (gypsum) has been extensively studied."Qecause the addition of a s h a l l percentage of CaCIZ t o portland cement acceler- ates its rate of hardening, it is of interest toexamine the influence o f this admixture on the hydration of C,A and C:,A+gypsum.Previous work has defined the general sequence of fonnation o f products in the hydration of C,A, C,A+CaCI,, C,A+gypsum, and C,A+gypsum +CaCI,, but the various combinations of reac- tants have been studied by different workers using different experi-
mental techniques and different proportions of the phases under study.
The work now reported was designed to carry out a uniform series of hydrations using the same conditions for each, so that variations resulting from differences in experimental technique would be eliminated and theeffects ofadditives on the hydration of C,A more firmly established.
11. Experimental Procedure
( I ) Materials
Materials used were C,,AZ (6 1.6 CaO, 37.8 A1,0:,, 0.5 MgO, 0.5 insolubles, and 0 . 1 8 NaPO; surface area was 0.58 mVg measured with a surface area pore volurne analyzer,+ with N, as adsorbate); gypsum, CaS0,.2H,O'; calcium chloride, CaCI,.6H,OC; and deionized decarbonated water.
( 2 ) Preparatiorz of Pastes
Pastes were prepared by mixing 1.5 g of solid with 1.5 ml H,O or CaCI, solution. A w l s ratio of 1.0 was selected, although this is
Received June 16, 1973; revisedcopy received December 19, 1971. This paperis a contribution from the Division of Building Research, National Research Council of Canada, and is published with the approval of the Director of the Division.
Supported in part by the Royal Nonvegian Council for Scientific and lndus~rial Research.
*Now with the institute of Silicate Science, The Technical University of Norway. Trondheim, Norway.
tC=CaO, A=AI,O,, H=H,O, and wls= waterlsolid ratio by weight. ?Tetratech International. San Dieeo. CA.
gNumlnco Om, Model MIC No 703. Numec, Apollo, PA qCert~fied reagent, F~sher Sclentlfic Co
.
P~tlsburgh. PA222
Journal of T h e American Ceramic Society-Traetteberg
and Grattan-Bellew
Vol. 58,
No.
5-6
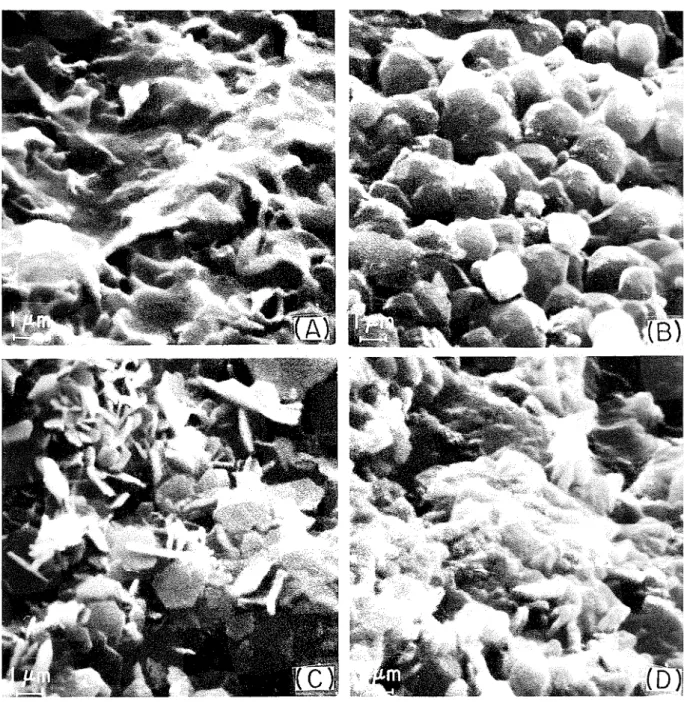
Fig. 1. Scanning electron micrographs of (A) C,A paste hydrated 1 m i n , (B) C,A paste h y d r a t e d 15 min, ( C ) paste of C 3 A + 8 % CaCl, hydrated 15 min, a n d ( D ) paste of C 3 A + 16% CaCl, h y d r a t e d 4 h.
higher than would normally be used in portland cement; 40% H,O is sufficient to convert C,A to C,AH,, but for studying the hydration sequence during the first few minutes of hydration more water is required to ensure rapid wetting of the entire sample. Even with a
\ V / S ratio of 1, some error in early hydration time is likely, owing to
difficulty in mixing the sample. T o prevent carbonation, mixing was rapid and the sample was placed in a sealed container and rotated to prevent segregation of the hydration products.'"
The percentages of CaCI, were based on the weight of the anhydrous salt; e.g., a sample containing 8 % CaCI,, was made by adding a solution containing 0.08 g CaC1, to I g C3A. The amounts of CaCI, added were designed to approximate the proportions of CaCI, to aluminate phases found in portland cement.
Portland cement usually contains 30 to 4 0 % gypsum in relation to its C,A content, but, to allow for some possible reaction of gypsum with other components, 25% gypsum was selected; 0.25 g of gypsum was accordingly added per gram of C,A.
Samples were hydrated for l , 5 , 15, and 30 min; 1 , 4 , and 8 h; 1, 3, 7, and 28 days; and 3 and 6 months. Hydration was stopped by immersing each sample in cold acetone for several hours and then drying it in a desiccator under vacuum.
(3) Methods of investigation
Scanning electron microscopy (SEM) samples were attached to Al stubs with plastic cement, coated with a conductive layer of C and Au, and examined in a lnicroscope.* Many samples had not set when hydration was stopped, and these, when dry, were sprinkled on an adhesive on the surface o f the specimen stubs.
X-ray diffractograms were made using a Debye-Scherrer camera o r a powder diffractometer to determine which phases were present. Microdensitometer traces were made from the X-ray diffraction (XRD) photographs.
DTA was performed' on all samples, with a heating rate of 20°C/min. The results were used alone or with XRD and S E M observations to determine which phases were present.
111. Results
(1) C 3 A + H 2 0
Pastes ofC,Aset in 3 t o 4 days. SEMexamination ofthe products formed in the first 5 min of hydration showed poorly crystalline
'Stereoscan Mark 2, Kent-Cambridge Scientific Co., Morton Grove. 1L. tUsing a Model 900 rhermal analyzer, E. I. du Ponr de Nemours. Inc., Wilmington, DE .
May-June 1975
H y d r a t i o ~ zof
3Ca0,A120,
and
3 C a 0 . A 1 2 0 , + G , y p s z ~ m W i t hand
WitlzozrtCaC1,
223
I M I N 1 5 M I N 0 200 400 600 T E M P . 'C 5 M I N 15 M I N 30 M I N 28 DAYS 0 200 400 600 T E M P , 'C 5 M I N 15 M I N 3 DAYS 28 DAYS 0 200 400 600 T E M P , *CFig. 2. Thermograms of hydrated pastes of ( A ) C,A, (B) C:,A
+
8% CaCI,, a n d ( C ) C:,A+ 1 6 % CaCI,.flakes or foils covering the C,A grains (Fig. l ( A ) ) ; XRD and DTA revealed the presence of hexagonal hydroaluminates. The DTA peaks at 160" and 250°C (Fig. 2) are presumed to be due to dehydration of C,AH, and C,AH,,, respectively. (For a discussion of the assignment of DTA peaks see Ref. 2.) XRD showed mainly reflectionsdue to C3A (Fig. 3), indicating that crystalline hydration products had not yet formed and that little C,A had hydrated.
A few weak reflections were observed on the diffractograms at lower angles. A broad, weak rellection
between
7.67 and 7.78A
probably represents C,AH,:,, and one at 10.9 A possibly C,AH,. A weak reflection at 12.1 A was not identified. Owing to the breadth and weaknzss of the reflections, the accuracy of the measurements was very poor. An endothermic peak at = 80°C on the thermogram(Fig. 2 ( A ) ) may be due to water adsorbed on the hydrated C,A phases.
After hydration for 5 to 6 min there was a r n a i ~ e d rise in tempera- ture, evidently associated with the formation of C,,AH,,, which is the dominant phase after 15 ~ n i n of hydration. Rhombic dodec- ahedra, which are characteristic of C:,AHI;, are shown in Fig. I(B).
In contrast with these results, Ciach and Swenson'!' found that C:%AH6 was not the dominant phase until after 7 days of hydration. This difference in the rate oftransformation to the cubic phase rnay reflect differences in the reactivity of the C,,A starting materials, which were of different origins.
Thermograms of samples hydrated for 15 min show only one strong peak at = 320°C; this peak is the result of the dehydration of C,AH,. XRD of a sample hydrated for 1 day shows C3A and C3AH,, as the main phases, but a few weak lines at low angles suggest minor amounts of the hexagonal hydroaluminate phases. Their presence was confirmed by observation of a few hexagonal plates in the SEM. An X-ray diffractogram of a sample hydrated for 28 days showed no change from the 15-min sample; a diffraction pattern of a sample hydrated for 6 months showed that C:,A was still a dominant phase. The rhombic dodecahedra evidently pack tightly enough around the C,A grains to severely retard continuing hydration.
Following hydration of C,A for 6 min, the sudden rise in temper- ature was investigated in separate experiments in which the temper- ature o f the sample was recorded by a n embedded thermocouple. After 5 to6 min the temperature rose rapidly to 80°C; both XRDand DTA showed that this rise was associated with the formation of C:,AH6. Young"' had concluded that early forration of C,AH, is due to the elevation of the temperature of thc sample. X R D and DTA suggest that more of the cubic phase has formed than was originally present in the hexagonal form. A quantitative XRD study would be necessary to confirm this suggestion.
It was observed that the paste, which had begun to thicken after hydration for 4 to 5 min owing to formation of interlocking hex-
I l l l l l l l l l l l l 1 I 1 l I l l 1 I 1 l l I I l l l l l l l l I I I l l l l l l I 1 I I I I l l 1 1 1 1 1 1 1 1 1 1 1 1 1 1 1 I1
1 9 2 4 3 5 4 5 1 5 1 9 2 4 3 5 4 5 15 19 2 4 3 5 4 5 15
2
3
4 5
1020
2
3
4 5
1020
2
3
4 5
1020
d
(i)
d
(i)
d
(i)
Fig. 3. X-ray diffractograms of pastes at different stages of hydration. ( A ) C,,A, (B) C:,A+8% C a C I L , ( C ) C 3 A + 1 6 % CaCI,, ( D )
224
Journal of T h e An~erican Ceramic Society-Traetteberg
a n d Grattarz-BeLLew
Vol. 58,
No.
5-6
agonal plates, became a slurry again when the rhombic dodecahedra were formed. The latter are almost spherical and when they crystal- lize separately in a moist paste they cannot interlock to stiffen it, although they seem to pack tightly enough to rerard hydration. After 30 days of hydration the paste was still weak, but after 3 months it had hardened owing to the formation of bonds between adjacent crystals. In contrast, Feldman and Rarnachandran' (using a very low ~ ~ ' 1 s ratio) did not find significant strength loss when the hex- agonal phase converted to the cubic.
When C:,A was hydrated in an ice bath, no thermal effect was observed and only a small amount ofC,AHa was found. After 5 rnin the principal products were C?AH, and C,AH,,. Stein,' who per- formed hydrations under isothermal conditions in a calorimeter, also found that the hexagonal phases were dominant during the first hour o f hydration. After 50 min in an ice bath, the sample was allowed to continue to hydrate for an additional 5 0 rnin at 22°C. The amount of C:,AH, increased, but it was still less than that in the sample hydrated entirely at 22OC;. no rise in temperature was re- corded. A hexagonal phase that has persisted for some time may develop a better crystalline structure, and this might make it more stable and thus slow its rate of solution and conversion to C,AH,,.
Sample size and shape also affect the formation ofC,AH,. A flat disk-shaped sample containing the same weight of C:,A as the normal cylindrical sanlples showed no thermal effect, and C,AH,, was observed only after 1 h o f hydration. Evidently in adisk-shaped sample the heat generated by hydration of early-formed hexagonal phases is dissipated by its larger surface area.
(2) C,A +CaCl, +H,O
T o examlne the effect of changes in chloride content on the hydration products and rate o f hydration, 8 and 1 6 % chloride were added to C,A. The addition of chloride reduced setting time to = 3 0 min. With both 8 and 16% CaCI, the products formed initially (observed in the SEM) appeared to be roughly similar to those formed in C:,A alone. In C:,A with 8 % chloride a well-formed hexagonal phase developed after 15 rnin o f hydration (Fig. l(C)). Both C,AH,, and C,A.CaCIy 10H form well-developed crystal- line phases." With 16% chloride the crystals appeared to be smaller and less well developed even after 4 h of hydration (Fig. l(D)). T h e chloride prevented the formation of C,AH, and the rise in tempera- ture observed with Ct3A alone. Despite the apparently poorly crystalline phase observed in the SEM examination of samples
Fig. 4. Scanning electron micrographs of ( A ) paste of C,A +gypsum hydrated 5 min (note rods growing on large gypsum crystal),
( B ) paste of C,A+ gypsum hydrated 1 day, (C) paste of C,A +gypsum +- 8% CaCI, hydrated 1 day, and ( D ) paste of C,A+ gypsum
+
16% CaCI, hydrated 1 day.May-June
1975
H y d r a t i o nof
3Ca0.AZ203
and
3 C a 0 . A 1 2 0 : 3 + G y p s u n z W i t h a n d W i t h o ~ ~ tCaCl,
225
hydrated with 16% CaCI,, XRD produced a very strong reflection
M I N
I I I I I I I I I I l l 1 1
at = 8 A; this was the basal reflection of the hexagonal phases I M I N
C.,AH,:, and C:,A-CaCI, IOH. The 8 - a peak was much stronger in 5 M I N
?
the C,A hydrated with 16% than in that with 870 CaCI2 (Fig. 3(B),(C)), suggesting that more crystalline phases had formed in the f o r
1:
:::
,
mer case after 1 rnin of hydration. The disparity between theapparently poorly crystalline phase observed in the SEM and the strong reflection found in the diffractogram might be explained if one were to assume that C,A.CaCI,. l0H forms a solid solution series with C.,AH,,, as suggested by Stukalova and Andreeva." The morphology might vary with composition, the more-chloride-
28 DAYS
rich members having less well formed crystal shapes. 7 D A Y S 28 D A Y S
The therrnograms for the early stages in the hydration of C,A
with 8 and 1 6 8 chloride are very similar (Fig. 2 ( B ) , ( C ) ) . The main
,,,,
features are peaks at = 160c and 3 1O0C, corresponding to thoseassigned to C,A.CaCI,. IOH by Stukalova and Andreeva." There is a slight difference between the temperatures at which peaksoccur in
the 8 and 16% samples. If the peak at 350°C is assumed to be due to ( C )
a solid solution between the chloride and the hydrated C,A phase, I I I I I
then Fig. 2 ( C ) seems to indicate that more was formed with 16% 0 200 400 600 0 200 400 600 0 200 400 600
T E M P , 'C T E M P . ' C T E M P , ' C
than with 8 % chloride. With 8% chloride, C,AHfi was observed in a
thermogram of a sample hydrated for 30 min. It is indicated by a Fig. 5. T h e r m o g r a m s of h y d r a t e d pastes o f ( A ) C,,A+25% peak at 310°C. Reflections due to C,,AH,, were not found by XRD g y p s u m , ( B ) C : ~ A + g Y P s u m + g % CaCl,, a n d ( C ) C : d +
until after I day of hydration, but rhombic dodecahedra characteris- gypsum
+
16% CaCl?.tic of this phase were observed by SEM after 4 h of hydration.
increasing
the chloride contenttb
1670 further reducedthe forma- tion of C,,AH,,. The thennogram of a sample hydrated for l h gave an indication of a weak peak at 3 IO°C, but even after 6 days only a relatively small number of rhombic dodecahedra were observed by SEM. When chloride content is increased, C3A combines with it to form C,3A.CaCIfl 10H; if a solid solution occurs, more C,A is tied up, resulting in much less available for conversion to the cubic phase and causing an apparent reduction in the rate of formation.Therniograms of C,,A+ 8 % CaCI? hydrated for between 4 hand 6 days showed an increase in the height o f the peak due to C,AH,, at 3 10°C. Strong peaks at = 180' and 340°C are thought to be due to the hexagonal hydrochloroaluminate phase. A small peak at ==26O0C is probably due to C,AH,,. Thermograms of samples hydrated for up to 28 days show no significant change.
XRD of a sample ofCCLA
+
8 % CaCl. hydrated for 7 days showed that the reflection at 2.7 A due to C:,A had an intensity ofonly= ' I ,
that of the I-min sample, suggesting that much of the C,A had hydrated.
As might be expected, samples hydrated with 1 6 9 chloride contained more ofthe hexagonal hydrochloroaluminate phase than occurred in samples containing 8% chloride. This phase resulted in strong peaks on the thermograms at = 180" and 330°C. Thermo- grams of samples hydrated for 28 days (Fig. 2 ( B ) , ( C ) ) suggest that more C,,AH, had formed in the sample with 1 6 9 chloride.
(3) C : 3 A + 2 5 % G y p s u m + H , 0
The positive identification of products formed during the early stages of hydration was difficult. X-ray diffractograms showed only weak, diffuse reflections between 7 and 10 A, the range in which the characteristic basal reflections of the hydration products occurred. A further difficulty arose withettringite in that only above 8 % did it give a detectable diffraction pattern. Neither could DTA differen- tiate between hydration products because ofoverlap o f the peaks on the thermograms.
(A) Hj~drntiott Seqtrettce: Samples hydrated for 2, 5 , 10, and 15 rnin were examined by SEM. After 2 rnin a well-developed crystalline hexagonal phase covered the C:,A grains as illustrated by the I-day sample (Fig. 4 ( B ) ) . The larger gypsum crystals, which were up to 10 times bigger than C:,A grains (the two phases were ground separately and mixed before hydration), showed no sign o f reaction. The fine hexagonal crystals covering the C,A grains were evidently too thin to produce a measurable diffraction pattern. DTA results indicate that nionosulfoaluminate was the main phase formed.
A small peak on the thermogram o f a sample hydrated for 15 min at = 150°C was possibly due to ettringite. Ramachandran et rtl.L:' show peaks for C , j A C a S O c 12H and C 3 A . 3 C a S 0 , 3 2 H at = 180" and 112"C, respectively. In Fig. 5, the peak for C:jA.CaSOx 12H
occurs at = 200"C, i.e. 20°C higher than that shown by Ramachan- dran et 01. The differences in the temperatures o f dehydration may be due to differences in the rate of heating. If the peak for C,A.CaSO., 12H is 20°C higher than that found by Ramachandran
et 01.. it is reasonable to expect that the peak for ettringite would
also be higher; it is on this basis that the peak at =15O0C is attributed to ettringite.
If ettringite was present before 15 min, it could not have been detacted by DTA because the thermal effect was overlapped by that of gypsum. The early formation of monosulfate in this study is in marked contrast with the results of other workers-" who found that ettringite was the dominant phase after the first few minutes of hydration. The formation of monosulfoalun~inate rather than et- tringite may be due to the large size o f the gypsum crystals used in the present study and could result in SO.,' ionsgetting into solution more slowly than with finercrystals. The reduced SO.,'- concentra- tion would favor the formation of the monosulfate phase.
( B ) 5 to 15 Min Hjrlrntioti: Samples examined by SEM showed rodlike crystals on the surface of the gypsum crystals (Fig. 4(A)), which are assumed on the basis of their morphology to be ettringite, C , , A 3CaSOc32H. The amount ofettringite formed was too small to be detectable by XRD. In samples hydrated for 18 to 36 min in a special cell on the X-ray powder diffractometer, which permitted continuous scanning ofthe range 20 while the sample was hydrating, ettringite was d e t ~ c t e d by its characteristic reflections, e.g. at 9.73.5.61, and 3.88 A. A thermograrn made after 15 rnin of hydration (Fig. 5) had two rnain peaks at =200° and 290°C; these are characteristic of C,ACaSO, 12H." The hexagonal plates ob- served on samples hydrated for 15 rnin are assumed to be monosuI- foaluminate, C:,A.CaSO., 12H. A small peak on the thermograms at 150°C may represent ettringite.
(C) 30 Mitt Hjdrrrtion: X R D and DTAresults showed that all the gypsum had been used. In samples containing 2 5 % gypsunijust under half the C,A would have been taken up to produce the monosulfate, C3A.CaS0,. 12H; from this time on it would be expected thit the remaining C,,A would hydrate to C,AH1, or an intercrystalline mixture of the two. Turriziani" pointed out that C.,AH,,, and C 3 A . C a S 0 4 . 12H do not form a solid solution but rather an intimate intergrowth having alternating layers of each phase. Thermograms made from samples hydrated for 1 h and longer indicate that monosulfoaluminate is the dominant phase. The therrnograms also show a small peak at 180°C that is ~~sualla, assigned to C,AH,, but XRD patterns do not show the 10.7 A reflection characteristic of this phase. Another small peak on the thennogram at = 280°C probably represents C,AH1:I.
Durino the first 5 h of hydration, the decrease in the intensity of the 2.7
1
peak on the X-ray diffractogram suggested that ='/-I o f226
Jozrrnal of T h e A~n,erican
Ceramic Society- -Traetteberg and Grattan-Bellew
Vol. 58, No. 5-6
the C,A had been hydrated. XRD of a sampJe hydrated for 28 days showed reflections at 5.1, 2.3, and 2.04 A; these reflections are characteristic of C,AH,.
A peak occurred on the themlogram (Fig. 5(A)) at ==305'C, probably due to C,AH, in the sample, although it was not observed in the SEM. After 28 days of hydration the small peak at 150°C, thought to be due to ettringite, was still present.
(D) 3 Morlrlzs Hjdration: XRD results showed that all C,,A had been hydrated to form C:,A.CaSO., 12H and C.,AH,,,.
The difficulty encountered in identifying the hexagonal phases formed during hydration of C,A+gypsum was further complicated by the presence of the chloride phase. Both the monochloride and monosulfate phases wete readily distinguished by their XRD reflec- tions at 7.89 and 8.9 A, respectively, but, as already discussed, C.,AH,, and the rnonochloride had essentially identical basal spac- ings.
It cannot be determined from the results of this study whether a solid solution exists between the monochloride and monosulfate phases or the two phases occur separately. On the thermograms, the peaks from the different phases overlap, making distinction dif- ficult. The thermogran~ for a sample with 870 chloride hydrated for 28 days (Fig. 5(B)) showed a sharp peak at =205"C, whereas that for a sample containing 16%- chloride (Fig. 5(C)) showed a broad one. The broad peak centered at =20O0C almost certainly consists of two overlapping peaks, one for C:,A.CaCI,. 10H at 195'C and one for C , A C a S O , 12H at 180°C. From this it may be concluded that both phases were present separately. This conclusion is in agreement with the findings of Tenoutasse%ho used C,A
+
20% CaSO, . 2H,O+
12.5% CaCI,.Although i t suggested that a solid solution had formed between the two phases, the sharp peak on the thermogra~n of the 8 % chloride sample at 205°C was not, by itself, sufficient confirmation. The diffractogram (Fig. 3(C)) has only a broad peak between 8 and 9
A
and is of no help in resolving the problem.(A) Hydratiorz Sequence: With both 8 and 16% CaCI, a hex- agonal phase formed on the C,A grains after 1 min of hydration; it was similar to that observed in the hydration of C,,A with gypsum. Rodlike crystals of ettringite formed on the gypsum crystals after 1 min with both 8 and 16% chloride, in contrast with samples h i - drated without chloride in which ettringite was not observed until after 5 min. The addition of chloride accelerated the formation and increased the quantity of ettringite; as with gypsum alone, occa- sional foil-like crystals, which could be monosulfoaluminate, were observed on the surface of the gypsum. After 5 min of hydration (accelerated by the addition of chloride) most of the gypsum had dissolved. The main reaction products of samples containing 8 and 16% chloride after 5 min of hydration were C,A.3CaSO,. 32H and C , A C a S O , 12H, the tri- and monosulfoaluminates. More ettring- ite was formed in the samples containing 16% chloride than in those containing 8%.
Ettringite transformed to monosulfoaluminate after 5 to 30 min in the sample containing 8 % chloride, but with 16% chloride ettringite persisted for between 4 h and 1 day. An X-ray diffractogram of a sample hydrated for 1 day shows C,A an! monochloroalun~inate as the main phases, with a weak peak at 9 A suggesting the beginning of the formation ;f the monosulfate phase. The ettringite basal reflection at 9.7 A is absent. The presence of only a weak basal reflection at 8.9
A
due to monosulfoal~~minate is difficult to explain; the reflection was strong in a sample hydrated for 4 h and was also strong in a sample hydrated for 28 days.Thermograms (Fig. 5(B)) of samples containing 8 % chloride showed little change with time after the first 30 min. XRD data showed that monosulfo- and monochloroaluminates, or a solid solution of the two, are the stable phases for hydration times of up to 3 months. Some C,AH,,, is probably also present. In samples containing 16% chloride, DTA and XRD showed that little change had occurred after 4 h of hydration. A thern~ogram of a sample hydrated for 28 days (Fig. 5(C)) had a small peak at 280°C due to C,AHl,.
The addition ofchloride resulted in a marked reduction in the size
ofthe hexagonal plates observed in the SEM after 1 day ofhydration (compare Figs. 4(B),(C),(D)). In samples containing 8% chloride small hexagonal plates were still readily visible, but in the sample with 16% they were scarcely discernible.
IV. Summary and Conclusions
In general, the results of this study differ from those of previous workers in only two instances. It is suggested that the differences are due to variations in the experimental techniques or in the properties of the starting materials.
( I ) C 3 A + H 2 0
During the first 5 min of hydration a hexagonal hydroaluminate is formed. The course of hydration afterward depends on physical environment and size and shape of the sample.
It is known that the formation of C,AH, is temperature dependent.ls2 If the temperature rises to =80°C, C,A hydrates directly to C,AH,. It has not previously been reported, however, that the shape and size of the sample also affect the transformation. In a cylindrical sample 3 cm long by 1 cm in diameter, the heat of hydration of C,A caused the temperature to rise-to =80°C, result- ing in rapid transformation to C,AH,. When a disk-shaped sample 3 cm in diameter and ~ 0 . 3 cm thick was used, the larger areaallowed the heat to dissipate and there was no appreciable rise in tempera- ture. In this case, the tirst-formed product wasC,AH,,, which only slowly changed to C,AH,,.
The addition of chloride to C:,A and H 2 0 altered the course of hydration, and the rise in temperature that occurred with C,A alone did not materialize. The first-formed products were C,AH,, and C,A.CaC12. IOH or possibly a solid solution between the two. C,AH,, formed slowly, probably because C:,A was complexed by the chloride so that less of i t was available for transformation to the cubic phase. After hydration for 28 days, both the hexagonal and cubic phases were still present.
The main product during the first few minutes of hydration is monosulfoaluminate, in marked contrast with the results of Stein" and Gupta er a!. ,
'
who found that ettringite was the main product. Ciach and Swenson" also found that ettringite was the main product after 1 day hydration. In the present study, a small amount of ettringite was observed on the surface ofthe gypsum crystals; it may also have fomled on some of the C,A grains that were close to the large gypsum crystals, but if so it was obscured by the dominant monosulfate phase. In this study, never more than a smallamount of ettringite was present. The gypsum crystals were much larger than the C,A grains and it is thought that the large size and consequent small surface may have reduced the amount of SO," ions in solution during the early stages of hydration. This reduction would tend to favor the formation of monosulfate rather than trisulfate. XRD showed C,AH,, and C,A.CaSO, 12H to be the main prod- ucts during the later stages of hydration.As expected, the addition of chloride increased the reactivity of gypsum, most of which had disappeared within 5 min. Part of the C,A would react to form C:,A.CaCI2. IOH. This reaction and the more rapid solution of gypsum in the early stage would mean a higher SO.,' concentration in relation to C:,A than occurred with C,A+gypsum alone and would favor the formation of ettringite; evidence of its fomiation was found. After 5 min of hydration the main products were monosulfoaluminate and ettringite. Increasing the chloride content from 8 to 16% increased the amount of ettring- ite. XRD of samples from the later stages of hydration showed that most of the ettringite had transformed to monosulfoaluminate.
Acknowledgment: The writers are grateful to V . S . Ramachandran. P. 1. Sereda, and E. G. Swenson for useful discussion and acknowledge with thanks the invaluable contribution of E. G. Quinn and the assistance of P. J. Lefebvre in the experimental work. Aud Traetteberg thanks the Royal Norwegian Council for Scien- tific and Industrial Research for financial suppon and the National Research Council o f Canada for the opportunity to work in the Division of Building Research.
May-June 1975
References
'
H. N. Stein, "Mechanismof the Hydration of 3 C a 0 A 1 2 0 3 , " J . Appl. Clrern.. 1 3 [5], 228-32 (1963).R. F. Feldman and V . S . Ramachandran. "Character o f Hydration o f 3 C a 0 , Al20,," J. Aarer. Cerarrr. Soc.. 49 [5] 268-73 (1966).
Z. Adonyi, G. Gyarmathy, J. Kilian, andT. Szekely; pp. 15-21 in Proceedingsof the Ninth Conference on the Silicate Industry. Bubpest, 1967. Edited by F. Tamas. Publishing House of The Hungarian Academy of Sciences, Budapest, 1968.
" P. Gupta, S. Chatterji, and J . W. Jeffery. "Studies of the Effect of Various Additives on the Hvdration Reaction of Tricalcium Aluminate: I." Ce~rr. . ~ Technol.. 1 [2] 59-66 (1970).
T. D. Ciach and E. G. Swenson, "Morphology and Microstructure of Hydrating Portland Cement and Its Constituents: I." Cerr~. C O I I C ~ . Res.. 1121 143-58 (1971).
H. N. Stein, "Characteristics of t h e ~ ~ d r a t i o n of 3 ~ a 0 ~ 1 ~ 0 , i n the Prisence'of CaS0,.2H0O." Rec. Trav. Cllirn.. 81. 881-89 (1962).
H. N . ~ stein, "Reaction o f 3 ~ ~ 0 ~ ~ 1 ~ 0 ~ ' w i t h Water in the Presence of CaS0,,2H20," J . Appl. CAenr., 15, 314-25 (1965).
'
N. Tenoutasse: DD. 372-78. Pacer No. 11-118 in Proceedines of the Fihh Interna- tional S y m p s ~ u m oil'the ~ h e m i s t r y ' o f ~ e m e n t , Tokyo, 1968. ~ c e Cement Association of Ja an, 1969.* 8 t t o Henning and Waldemar Danowski, "Studies of the Hydration of Calcium (3:l) Aluminate in the Presence of Gypsum: 11," Silikarrechr~ik, 17 [ l o ] 325-29 (1966).
' O Otto Henning and Waldemar Danowski, "Studies o f the Hydration of Calcium
(3:l) Aluminate in the Presence of Gypsum: 1," ibid.. 16 [9] 284-86 (1965). " T . K . Brutskus andE. E. Segalova, "Influence of AdditionsofCalcium Sulfateon Processes of Hydration and Structure Formation ofTricalcium Aluminate," Kolloid. 211.. 26 [ I ] 11-16 (1964).
" R. F. Feldman and V. S . Ramachandran. "Influence of CaSO,.2H2O Upon the
Hydration Character of 3 C a 0 A 1 2 0 3 , " Mag. Concr. Res.. 18 1571 185-96 (1966). P. Seligmann and N. R. Greening. "Studies of Earl) Hydration Reactions of Portland Cement by X-Ray Diffraction," Highw. Res. Rec.. 62, 80-105 (1964).
"'
W. A. Corstanje, H. N . Stein, and 1. M. Stevels, "Hydration Reactions in Pastes C,S +C,A+ CaS0.,.2H10+
H,O at 25°C: I," Cern. Cor~cr. Res., 3 [6] 791-806 (1973) ,.- .-,.''
H. Mori and K . Minegishi; Supplementary Paper 11-73, pp. 349-61 in Ref. 8. 'W. I. Luk'yanova and Z. A. Abueva. "Formation of X-Ray-Amorphous Phases and Dispersed Structures from These Phases in Aqueous Tricalcium Aluminate Sus- pensions," Kolloid. 211.. 33 [3] 107-14 (1971).J. F. Young; Supplementary Paper 11-26, pp. 256-67 in Ref. 8.
V. P. Varlamov and 0 . I. Luk'yanova, "Phase Composition o f Tricalcium Aluminate Hydration Products," 211. Prikl. Klrirr~., 43 [lo] 2135-43 (1970).
I". D. Ciach and E. G. Swenson, "Morphology and Microstructure o f Hydrating
Portland Cement and Its Constituents: 11," Cerrl. C o t ~ c r . Res., 1 [2] 159-76 (1971).
'O J. F. Young, "Effect oforganic Compounds on the Interconversions of Calcium
Aluminale Hydrates: Hydration ofTricalciun1 Aluminate,"J. Arner. Cerarrl.Soc., 53 [2] 65-69 (1970).
" M . Regourd. H. Hornain, and B. Mortureux. "Influence of the Method
q t
Crysrallization of Tricalcium Aluminate on the Resistance of Cements to Sea Water, Rev. Marer. Corrsrr. Tra~p. Prtb., NO. 687 (Mar.-Apr. 1974).
'? N. P. Stukalova and E. P. Andreeva, "Effect of Calcium Chloride on Chemical
Interaction in Aqueous Suspensions of Tricalcium Aluminate," Kolloid. ZIr., 30 [5] 761-66 (1968).
'3 V. S . Ramachandran, R. F. Feldman, andP. J. Sereda. "Application ofDifferen-
tial Thermal Analysis in Cement Research,'' Higlrw. Res. Rec., No. 62, 40-61 (1964).
Renato Ttjrriziani, "The Process o f Hydration of Portland Cement," Irld. ltal. C e m . . 29, pp. 189, 219, 244, 276, and 282 (1949); Slavic Language Transl. No.