HAL Id: hal-01962126
https://hal-amu.archives-ouvertes.fr/hal-01962126
Submitted on 20 Dec 2018
HAL is a multi-disciplinary open access
archive for the deposit and dissemination of
sci-entific research documents, whether they are
pub-lished or not. The documents may come from
teaching and research institutions in France or
abroad, or from public or private research centers.
L’archive ouverte pluridisciplinaire HAL, est
destinée au dépôt et à la diffusion de documents
scientifiques de niveau recherche, publiés ou non,
émanant des établissements d’enseignement et de
recherche français ou étrangers, des laboratoires
publics ou privés.
Distributed under a Creative Commons Attribution| 4.0 International License
Neurons Driving Network Dynamics in the Developing
Entorhinal Cortex
Vitor Sousa, Laura Mòdol, Vitor Hugo Sousa, Arnaud Malvache, Thomas
Tressard, Agnès Baude, Rosa Cossart
To cite this version:
Vitor Sousa, Laura Mòdol, Vitor Hugo Sousa, Arnaud Malvache, Thomas Tressard, et al.. Spatial
Embryonic Origin Delineates GABAergic Hub Neurons Driving Network Dynamics in the Developing
Entorhinal Cortex. Cerebral Cortex, Oxford University Press (OUP), 2017, 27 (9), pp.4649-4661.
�10.1093/cercor/bhx198�. �hal-01962126�
doi: 10.1093/cercor/bhx198
Advance Access Publication Date: 31 July 2017 Original Article
O R I G I N A L A R T I C L E
Spatial Embryonic Origin Delineates GABAergic Hub
Neurons Driving Network Dynamics in the Developing
Entorhinal Cortex
Laura Mòdol, Vitor Hugo Sousa, Arnaud Malvache, Thomas Tressard,
Agnes Baude and Rosa Cossart
INMED, Aix-Marseille University, INSERM, Marseille 13273, France
Address correspondence to Rosa Cossart, INMED, AMU, Parc Scientifique de Luminy, 63 Avenue de Luminy BP13, 13273 Marseille Cedex 09, France. Email: [email protected]
Laura Modol and Vitor Hugo Sousa are co-first authors Agnès Baude and Rosa Cossart share senior authorship
Abstract
Coordinated neuronal activity is essential for the development of cortical circuits. GABAergic hub neurons that function in orchestrating early neuronal activity through a widespread net of postsynaptic partners are therefore critical players in the establishment of functional networks. Evidence for hub neurons was previously found in the hippocampus, but their presence in other cortical regions remains unknown. We examined this issue in the entorhinal cortex, an initiation site for coordinated activity in the neocortex and for the activity-dependent maturation of the entire entorhinal–hippocampal network. Using an unbiased approach that identifies “driver hub neurons” displaying a high number of functional links in living slices, we show that while almost half of the GABAergic cells single-handedly influence network dynamics, only a subpopulation of cells born in the MGE and composed of somatostatin-expressing neurons located in infragranular layers, spontaneously operate as“driver” hubs. This indicates that despite differences in the origin of interneuron diversity, the hippocampus and entorhinal cortex share similar developmental mechanisms for the establishment of functional circuits. Key words: developing network dynamics, entorhinal cortex, fate-mapping, GABA hub neuron
Introduction
The hippocampus and the 6-layered cortex share many com-mon principles of circuit organization, are composed of related cellular archetypes, and display similar network dynamics. Accordingly, both structures are shaped by similar genetic and activity-dependent developmental programs. They share com-mon pools of neuronal progenitors as well as a similar sequence for the emergence of correlated neuronal activities (Allene et al. 2008;Hébert and Fishell 2008;Egorov and Draguhn
2013). Both in the murine hippocampus and neocortex, GABAergic interneurons are known to participate in the emer-gence of a precise temporal sequence of distinct correlated neuronal activity patterns during early postnatal development (Crépel et al. 2007;Allene et al. 2008). Indeed, early coordinated neuronal activity in the form of giant depolarizating potentials (GDPs) is a hallmark of both hippocampal and neocortical developing networks (Ben-Ari et al. 1989;Ben-Ari 2002;Crépel et al. 2007;Allene et al. 2008). However, neocortical GDPs are
© The Author 2017. Published by Oxford University Press.
This is an Open Access article distributed under the terms of the Creative Commons Attribution Non-Commercial License (http://creativecommons.org/ licenses/by-nc/4.0/), which permits non-commercial re-use, distribution, and reproduction in any medium, provided the original work is properly cited. For commercial re-use, please contact [email protected]
preceded and shortly coexist with glutamate-driven early net-work oscillations (ENOs) (Allene et al. 2008), indicating that the developmental schedules of the neocortex and the hippocam-pus also present region-specific characteristics, and suggesting a possibly stronger contribution of the glutamatergic cell population (Donato et al. 2017). In the CA3 region of the hippo-campus, the coordination of GDPs has been demonstrated to be partly carried out by a major functional subset of early-born somatostatin-positive (Sst) GABAergic neurons called “hub” neurons (Bonifazi et al. 2009;Picardo et al. 2011;Villette et al. 2016). Hippocampal hub cells were identified as “functional hubs” because they were spontaneously and recurrently active at the onset of population bursts, giving them a high functional connectivity degree. However, these cells were also shown to be“driver hubs” since they were able to alter network synchro-nization when single-handedly activated (Cossart 2014; Wester and McBain 2016). Given that neuronal morphology, excitability, and connectivity are shaped by activity within both the hippo-campus and neocortex (Lauri et al. 2003;Blankenship and Feller 2009;De Marco García et al. 2011), driver hub cells are potentially major participants in the assembly of cortical networks at early stages in both structures: not only can they affect network dynamics when stimulated (i.e., the driver attribute), but they also spontaneously coordinate neuronal synchronization in the absence of any external intervention (i.e., the hub attribute). Such distinction between“what a cell can do and what it actually does” is particularly relevant in the context of optogenetics and other means of cell-specific activity manipulations.
In the present study, we therefore asked whether driver hub neurons could also be identified in the developing entorhinal cortex. We chose to examine this issue in the entorhinal cortex for several reasons. First, the entorhinal cortex is the main interface between the hippocampus and neocortex and a criti-cal component of the temporal lobe navigation and memory systems. Second, it displays a connectivity pattern that serves as a prototype for the transition between the 3-layered allocor-tex and the 6-layered neocorallocor-tex, with layers I and IV being rela-tively free of neurons (Kerr et al. 2007;Canto and Witter 2012; Canto et al. 2008). Finally, the entorhinal cortex is an important initiation site for traveling calcium waves that spread through the entire cortex at early postnatal stages (Namiki et al. 2013). While it was recently shown that the entorhinal cortex pro-vides an instructive signal for the activity-dependent matura-tion of the entire entorhinal–hippocampal network (Donato et al. 2017), the specific contribution of GABAergic circuits remains largely unexplored.
To investigate the role of GABAergic circuitry in the entorhi-nal–hippocampal network, we combined large scale 2-photon calcium imaging of multineuron dynamics in cortical slices with online functional connectivity analysis to identify func-tional hub cells without any a priori assumptions. These cells were then probed using patch-clamp recordings to identify driver hub cells capable of influencing network dynamics, as previously reported (Bonifazi et al. 2009;Picardo et al. 2011). We show that the developing entorhinal cortex includes functional hub neurons, and that these neurons can be either GABAergic or glutamatergic cells. Taking advantage of the 5-HT3aR-BAC-EGFP and Lhx6Cre::RCE transgenic mice that label nonoverlap-ping GABAergic neuron subpopulations exclusively originating from the caudal and medial ganglionic eminences, respectively (Fogarty et al. 2007;Batista-Brito and Fishell 2009), we further show that, independent of their spatial embryonic origin, almost half of the GABAergic neurons, but none of the glutama-tergic cells, could single-handedly influence network dynamics
when stimulated. However, driver hub cells were exclusively MGE-derived and composed of a subpopulation of Sst-expressing neurons with longer axons and located in the deeper cell layers. Altogether, this study paves our understanding of the power of sparse but specific GABAergic circuits to the maturation of the entorhinal–hippocampal system.
Materials and Methods
Animals
All animal use protocols were performed under the guidelines of the French National Ethic Committee for Sciences and Health report on “Ethical Principles for Animal Experimentation” in agreement with the European Community Directive 86/609/EEC. Double-heterozygous Lhx6iCre::RCE:LoxP, heterozygous
GAD67-GFP-KI, heterozygous and 5-HT3aR-BACEGFP male mice were crossed with 7- to 8-week-old wild-type Swiss females (C.E. Janvier, France) for offspring production. All efforts were made to minimize both the suffering and the number of animals used.
Slice Preparation and Calcium Imaging
Horizontal cortical slices (400μm thick) were prepared from 8 postnatal days old (P8) mouse pups with a Leica VT1200 S Vibratome using the Vibrocheck module in ice-cold oxygenated modified artificial cerebrospinal fluid (0.5 mM CaCl2and 7 mM
MgSO4; NaCl replaced by an equimolar concentration of
cho-line). Slices were then transferred for rest (1 h) in oxygenated normal ACSF containing (in mM): 126 NaCl, 3.5 KCl, 1.2 NaH2PO4, 26 NaHCO3, 1.3 MgCl2, 2.0 CaCl2, and 10 D-glucose,
pH 7.4. For AM-loading, slices were incubated in a small vial containing 2.5 ml of oxygenated ACSF with 25 ml of a 1 mM Fura2-AM solution (in 100% DMSO) for 20–30 min. Slices were incubated in the dark, and the incubation solution was main-tained at 35–37°C. Slices were perfused with continuously aer-ated (3 ml/min; O2/CO2—95/5%) normal ACSF at 35–37°C.
Imaging was performed with a multibeam multiphoton pulsed laser scanning system (LaVision Biotech) coupled to a micro-scope as previously described (Crépel et al. 2007;Allene et al. 2008; Bonifazi et al. 2009; Picardo et al. 2011) Images were acquired through a CCD camera, which typically resulted in a time resolution of 50–150 ms per frame. Slices were imaged using a 20×, NA 0.95 objective (Olympus). Imaging depth was on average 80μm below the surface (range: 50–100 μm).
Electrophysiology
A total of 64 neurons were electrophysiologically stimulated and recorded following the criteria: (1) stable electrophysiologi-cal recordings at resting membrane potential (i.e., the holding current did not change by more than 15 pA); (2) stable network dynamics measured with calcium imaging (i.e., the coefficient of variation of the inter-GDPs interval did not exceed 1); and (3) good quality calcium imaging while recording. Neurons were held in current-clamp using a patch-clamp amplifier (HEKA, EPC10) in the whole-cell configuration. Intracellular solution composition was (in mM): 130 K-methylSO4, 5 KCl, 5 NaCl, 10
HEPES, 2.5 Mg-ATP, 0.3 GTP, and 0.5% neurobiotin. No correc-tion for liquid junccorrec-tion potential was applied. The osmolarity was 265–275 mOsm, pH 7.3. Microelectrode resistance was 6–8 MOhms. Uncompensated access resistance was monitored throughout the recordings. Recordings were digitized online (10 kHz) with an interface card to a personal computer and acquired using Axoscope 7.0 software. For most stimulation
experiments, the movie acquisition time was separated evenly between (1) a 3 min resting period during which the cell was held close to Vrest (i.e., zero current injection); (2) a 3 min stim-ulation period during which phasic stimstim-ulation protocols were applied; and (3) a 3 min recovery period where the cell was brought back to resting membrane potential. Stimulation proto-col: suprathreshold current pulses (amplitude: 100–200 pA, duration: 200 ms) repeated at 0.1 and 0.2 Hz.
Morphological Analysis
A total of 30 neurons were recovered for morphological analy-sis. Slices werefixed overnight at 4°C in Antigenfix, rinsed in saline phosphate buffer (PBS) containing 0.3% Triton X-100 (PBST). After immersion in PBS containing 30% sucrose, slices were frozen in cold isopentane (−50°C), defrost in PBS, and finally incubated overnight at room temperature in cy3-streptavidin (1/1000 in PBST; Jackson Immunoresearch, West Grove, PA). Somefilled cells were tested for Sst labeling, and slices were processed for immunocytochemistry as described below. Post hoc analysis was performed using a confocal micro-scope. Stacks of optical sections were collected for neuronal reconstruction with a computer-assisted system (Neurolucida, MicroBrightfield). Morphological variables included dendritic and axonal lengths.
Immunocytochemistry
After anesthesia in isoflurane, P8 pups were perfused with paraformaldehyde before brain extraction. Brains were post-fixed overnight, washed in PBS, and 70 μm thick horizontal sec-tions were obtained. Horizontal brain secsec-tions from fixed brains (70μm thick sections, n = 3 pups) or 400 μm thick slices were processed for immunohistochemistry as described previ-ously (Picardo et al. 2011). Goat somatostatin primary anti-body (1:2000; Santa Cruz Biotechnology, SC-7819) was applied followed by incubation within donkey anti-goat DyLightTM649
(Jackson Immunoresearch, West Grove, PA).
Analysis of Calcium Dynamics
We used custom designed MATLAB software (Bonifazi et al. 2009) that allowed for: (1) the automatic identification of loaded cells; (2) measurement of the average fluorescence transients from each cell as a function of time; (3) detection of the onsets and offsets of calcium signals; and (4) reconstruction of the functional connectivity of the imaged network.
Active Cell Detection
A custom-made algorithm based on PCA/ICA was used and combined with morphological identification for cell detection. The offset PCA method was next applied (Kaifosh et al. 2013). Principal components displaying a variance greater than noise were fed to an iterative ICA algorithm (Mukamel et al. 2009). Cells were identified in the output of the ICA using 2D-spatial waveletfiltering matching the expected cell size (7–15 μm diam-eter), and cell contours were extracted. Thefluorescence trace of each cell was calculated by averaging over the area inside each contour.
Cell Activation Onset Detection
An automatic algorithm based on deep learning was designed to detect the onsets of thefluorescence calcium transient using a pattern recognition neuronal network (“patternnet” Matlab
function) with a hidden layer size of 10. The network was trained using 200 000 simulated calciumfluorescent transients mimicking the dynamics of the Fura2 dye.
Network Burst Detection
Network bursts were detected when peaks of synchronous cal-cium activation onsets exceeded chance levels. The threshold was defined as the 95th percentile of peak heights after reshuf-fling cell fluorescence traces.
Functional Connectivity
The relative delays of cell activation onsets were used to define the functional connectivity of the network. For each pair of cells, 2 statistical tests were made on the distribution of their onset time difference to assess whether or not they were con-nected. First, a uniformity test (Kolmogorov–Smirnov, with a threshold at 5% significance level) was applied in order to dis-card homogeneous distributions, and second, a t-test (with a threshold at 0.1% significance level) was applied in order to dis-card distributions centered at 0. If the results of both tests were significant (i.e., the onset time distribution was neither uniform nor centered at 0), the 2 cells were functionally linked, and the sign of the mean delay was used to define the direction of the link.
Correlation of Cell Activity to Network Bursts
For each cell, the correlation between the patterns of cellfiring and network bursts was calculated in order to quantify how reliably a cell participated in network bursts. First, the delays between the activation onset of the cell and the peak of net-work activity were computed for each event. Then, the histo-gram of the distribution of the delays was used tofind the most frequent delay, using 70 ms bins (70 ms= 1 imaging frame). The correlation coefficient was defined as the ratio between the number of events in the largest bin and total number of events. Thus, a correlation value of one means that the cell was always activated with the same delay±35 ms relative to the burst. This calculation was only performed for cells that participated in at least 10 bursts.
Driver Cell Test
To assess whether the stimulation of a cell had an influence on network bursts, the frequency of burst occurrence was com-pared between stimulation and control periods (prestimulation and poststimulation). The distribution of frequencies within a period was calculated by taking the mean frequency over a 20 s sliding window. These distributions were then statistically compared (Kolmogorov–Smirnov test, with a threshold at 1% significance level). A cell was qualified as a driver cell if (1) there was a significant frequency change between prestimula-tion and stimulaprestimula-tion periods, and (2) this difference was no lon-ger present between prestimulation and poststimulation periods.
Results
The Developing Entorhinal Cortex Contains Functional Hub Cells
In order to determine the participation of the GABAergic cell population in developmental network dynamics while distin-guishing the contribution of cells from different embryonic ori-gins, we used multibeam 2-photon excitation of entorhinal cortex slices (P8) from 3 different mouse lines: the GAD67-green
fluorescent protein (GFP) knock-in (KI) (GAD67-GFP) (Tamamaki et al. 2003), or the 5-HT3aR-BACEGFP (5-HT3aR-GFP) and the Lhx6Cre::RCE (Lhx6-GFP) mice that express GFP in all interneur-ons or exclusively in those originating from the CGE and MGE respectively (Fogarty et al. 2007;Batista-Brito et al. 2009;Sousa et al. 2009;Rudy et al. 2010). Slices were loaded with the cal-cium indicator Fura2-AM, to record spontaneous neuronal activity (Fig. 1). Within the 400 × 300 μm2 field-of-view, the
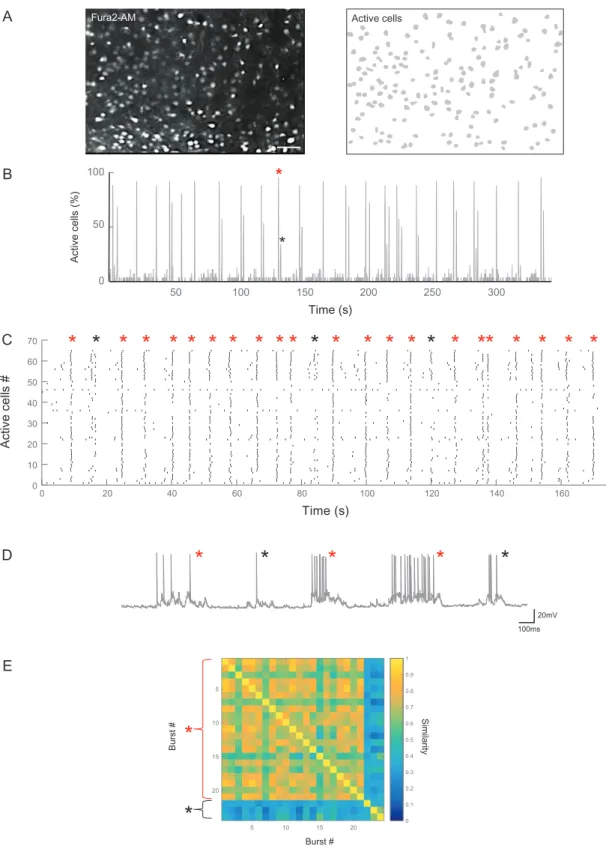
activity of 150± 23 cells (n = 64 slices), distributed across 3–4 layers, was simultaneously acquired (Fig. 1A). Active cells represented 70% of the imaged neuronal population. As previously described (Allene et al. 2008;Conhaim et al. 2010;Unichenko et al. 2014), the main activity pattern was a recurring population burst (Fig.1B). As previously reported (Unichenko et al. 2014), using a cluster analysis based on pairwise correlation between cell recruitment in network bursts, we found that population events could be split into global (i.e., large amplitude) and local events (i.e., small amplitude, Fig.1B,C). At the single-cell level, global and local bursts translated into prolonged and shorter mem-brane potential depolarizations in current-clamp recordings, respectively (Fig.1D). Most events (92% ± 13%, n = 64 slices) were grouped in the same cluster of global synchronizations, indicat-ing that neuronal dynamics at this stage of entorhinal cortex development are stereotyped and neurons are not randomly recruited in the synchronization process (Fig.1E).
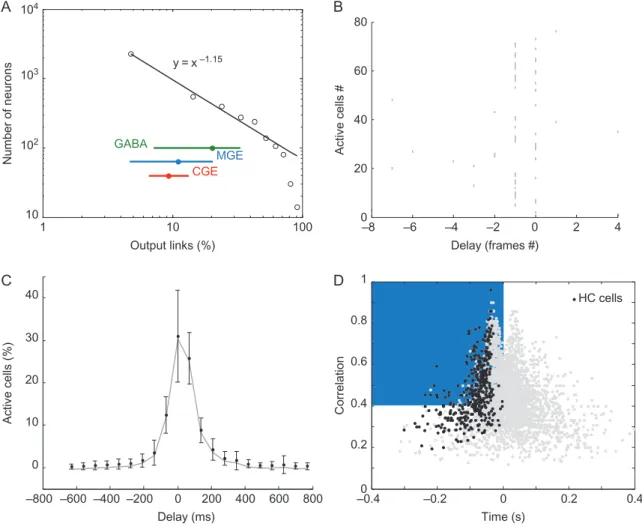
To identify functional hub neurons, we next computed the functional connectivity of the active cells based on the pairwise correlation between calcium activation onsets occurring within 500 ms of network bursts. Through this analysis of temporal correlations, a“functional connection” directed from neuron A to neuron B was established if the activation of A significantly preceded that of B (seeMaterials and Methods). In other words, neuron A displayed an output link to B if neuron A consistently fired before neuron B during bursts. A functional network describing the directed connectivity between all pairs of active neurons was constructed. We found that the distribution of the number of functional output links followed a power law (Fig.2A), meaning that while most neurons where poorly con-nected, a small minority of cells, the“highly connected” (HC) neurons, displayed many functional outputs. To identify this small minority of HC neurons among all active neurons, for each movie, we used a threshold value of the 90th percentile of the degree distribution of output links (Fig.2A). In other words, HC neurons were the 10% most functionally connected fraction of active cells; other cells were considered to be “lowly con-nected” cells (LC). Network burst dynamics were characterized by a build-up of activity lasting on average 290 ± 150 ms (Fig.1B,C; n = 64 slices; mean ± std). For each imaged neuron, we estimated the correlation and the delay of activation rela-tive to the network bursts (Fig.2D, seeMaterials and Methods). The presence of a region (Fig.2D) with high correlation starting 200 ms before the peak of synchrony indicated that network bursts repeatedly began with the synchronization of neurons plotted on the top left side of the distribution. By pooling the data from different slices (n = 4872 neurons, 64 movies), we found that 62% of HC neurons were in this region (correlation coefficient >0.4, Fig. 2D). We dubbed this subpopulation as functional hub cells because they are likely to be actively involved in the network synchronization process. It is impor-tant to note that this represents a very sparse subset of cells (i.e., 6% of the active cell population, which accounts for about 2% of the all imaged neurons).
Since GABAergic neurons can be identified by their expression of GFP in GAD67-GFP, 5-HT3aR or Lhx6-GFP slices, we next
examined the relative distribution of functional hub neurons among the GABAergic and glutamatergic cell populations. In GAD67-GFP slices, we found that GABAergic neurons represented only a small fraction (13%) of the functional hub cell population (17/128, n= 27 slices). A similar ratio was obtained when consid-ering only the MGE-derived cells, as 9% of functional hub cells were MGE-derived (7/78, n = 15 Lhx6-GFP slices). In contrast, none of the functional hub neurons originated from the CGE (0/ 47, n= 9 5-HT3aR-GFP slices). Therefore, functional hub neurons comprise glutamatergic cells and a small fraction of MGE-derived GABAergic neurons.
To conclude, a small set of glutamatergic and MGE-derived GABAergic functional hub neurons were spontaneously and reliably recruited at the onset of most network bursts. We next attempted at determining which of these functional hubs were additionally driver hub cells causally involved in the synchroni-zation process.
Almost Half of the GABAergic, But no Glutamatergic Neurons, Could Single-Handedly Influence
Spontaneous Network Bursts
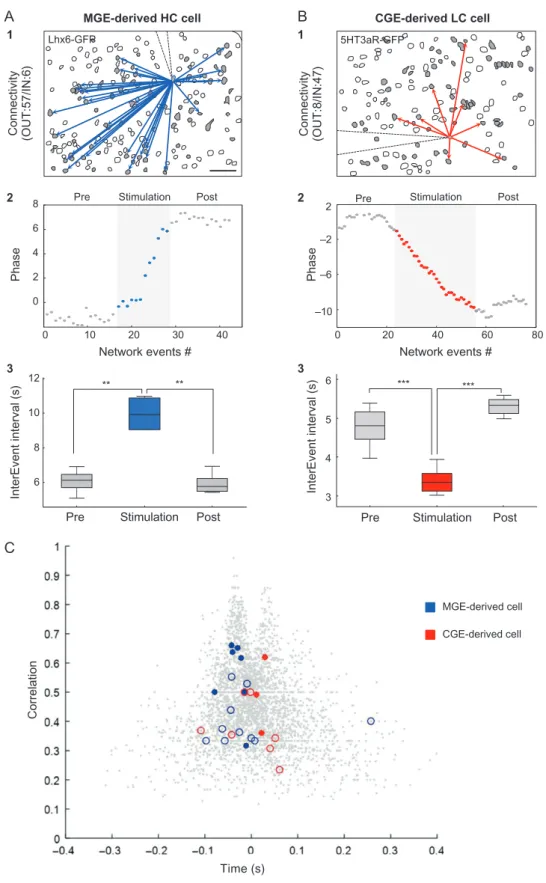
We tested for the ability of single cells to influence spontaneous network bursts when stimulated (Figs3and4). Glutamatergic, GABAergic, MGE-derived, and CGE-derived neurons were tar-geted for patch-clamp recordings in current-clamp conditions (n= 6, 27, 24, 13, respectively, Figs3and4); HC neurons were identified based on their output connectivity degree as described above; cells were stimulated using intracellular current injec-tions while imaging calcium responses in other neurons (see Materials and Methods). A phasic stimulation protocol was applied, that is, short suprathreshold current pulses repeated at 0.1–1 Hz (the frequency range of network burst occurrence). Cell/ network interactions were estimated using 2 types of metrics (seeMaterials and Methods): (1) alterations in the average net-work burst frequency during stimulation revealed by statistically different distributions of interburst intervals in prestimulus con-ditions and during stimulation (P < 0.01, Student’s t test or Mann–Whitney test); and (2) induction by phasic stimulations of a forward or backward GDP phase shift in comparison to presti-mulus conditions. A cell was considered to significantly affect network dynamics if it satisfied both criteria; in this case the cell was designated as a driver cell. None of the recorded glutama-tergic cell significantly affected network dynamics when stimu-lated (Fig.3A) whereas almost half of the GABAergic neurons could influence network bursts when stimulated (42%, n = 27 out of 64 recorded cells comprising GAD67-GFP, MGE and CGE-derived patched cells, Figs 3B,C and 4A,B). This represents a remarkably large proportion of cells compared with previous reports in the CA3 hippocampus (Bonifazi et al. 2009). Globally, 54% of cells decreased (Fig.4A) network burst frequency by 22% ± 8% of control when stimulated, while 46% of cells increased (Figs3B,C and4B) burst frequency by 23% ± 7% of control (P < 0.01) when stimulated. Interestingly, in contrast to CA3 (Bonifazi et al. 2009), the recorded GABAergic driver cells were not neces-sarily also functional hubs as only 50% of the functional hubs (n= 3 out of 6 functional hub GAD67-GFP patched cells) were also drivers (Fig.3B) and 48% of the LC GABA cells were drivers (n = 10 out of 21 LC GAD67-GFP patched cells; Fig.3C). This indi-cates that cells that are not spontaneously leading neuronal activity can nevertheless perturb network dynamics when stim-ulated provided that they are GABAergic (Fig.3C). We then inves-tigated if the embryonic spatial origin of interneurons was a hallmark of a cell’s participation and influence on spontaneous
network activity. By analyzing the data obtained from Lhx6-GFP or 5-HT3a-GFP slices, we observed that MGE or CGE-derived neu-rons were: (1) almost equally likely to be drivers, as 42% of the
MGE-derived cells (n= 10 out of 24 cells) and 31% of the CGE-derived cells (n= 4 out of 13) were drivers (Fig. 4A,B); and (2) driver hub cells could only be found among MGE-derived
B
A
Fura2-AM Active cellsActive c e lls (%) Time (s) 50 100 150 200 250 300 0 50 100
*
*
Burst # Burst #E
Similarity Active c e lls # 0 20 40 60 80 100 120 140 160 0 10 20 30 40 50 60 70C
*
*
* * * * * * * * *
*
*
* * *
*
* *
*
*
*
*
*
Time (s)D
20mV 100ms*
*
*
*
*
*
*
Figure 1. Imaging the functional organization of neuronal activity in the developing entorhinal cortex. (A) Representative 2-photon calciumfluorescence image from an entorhinal cortex slice of a P8 GAD67-GFP mouse loaded with the calcium indicator Fura-2AM (left) and contour plot of the cells detected as active (right). Scale bar: 100μm. (B) Histogram displaying the percentage of active cells as a function of time. Peaks in the histogram correspond to network bursts. Note that both global (red star) and local events (black star) can be observed. (C) Rasterplot of neuronal activity as a function of time, red stars indicate global events, black stars local events. (D) Long- (red stars) and shorter- (black stars) lasting membrane potential depolarizations indicating global and local events can be recorded in a MGE-derived GABAergic neuron from an entorhinal cortex slice of a Lhx6-GFP mouse. (E) Ordered similarity matrix of the burst events in (C).
neurons (Fig.4A). In fact, a large majority of the MGE-derived functional hubs (80%, n= 5) also influenced network dynamics when stimulated (Fig.4C). Hence, even though both functional hub and LC cells could influence network activity (driver cells), only driver hub cells were spontaneously and reliably active at the onset of early network bursts. Interestingly, these cells were only found among MGE-derived cells. We next focused our anal-ysis on these driver hub cells.
Morphophysiological Characteristics of Driver Hub Cells
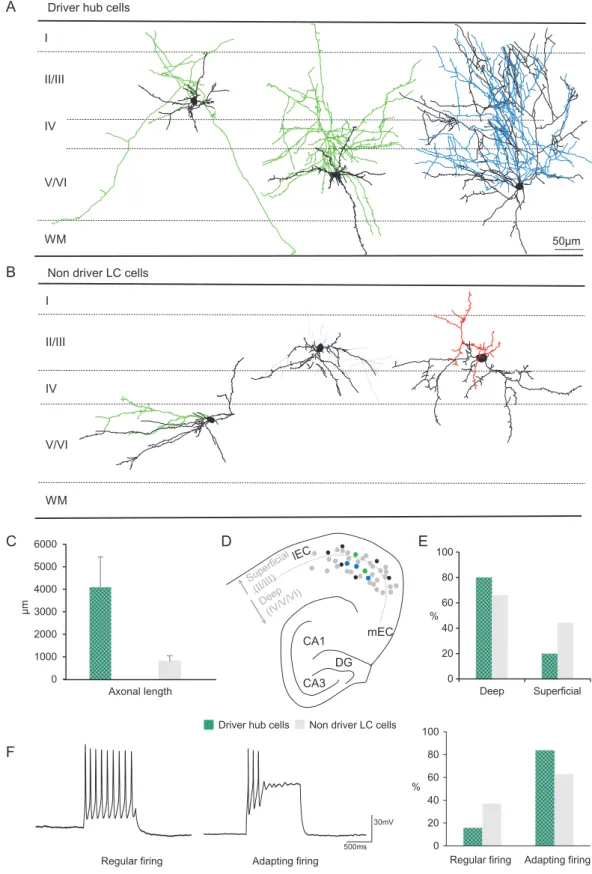
We next examined whether driver hub neurons described above represented a specific morphophysiological population (Table1). While being recorded, glutamatergic and GABAergic cells werefilled with neurobiotin and their anatomy was recon-structed post hoc for morphometric analysis (n= 30 GABA cells; n = 6 glutamatergic cells; Fig. 5 and Supplementary Fig. 1). Different types of morphologies could be recovered: some cells possessed dense axonal collaterals while others displayed long axonal branches (Fig.5 and Supplementary Fig. 1). Of all the parameters included in the analysis, driver hubs were most identifiable by their longer axonal length (average: 4091 ± 1352μm, n = 5 cells) when compared with “nondriver” LC cells
(average: 810± 232 μm, n = 7 cells; P < 0.01 Fig.5C, seeMaterials and Methods). No significant difference was observed regarding dendritic length (driver hubs average: 698± 334 μm; nondriver LC average: 810± 232 μm). In addition, although driver hubs displayed variable morphologies, a significant fraction of them (80%) were located in layers IV/V/VI with axon collaterals extending towards layer I (Fig.5). Driver hubs did not signifi-cantly differ from nondriver LC cells in their intrinsic mem-brane properties or action potential characteristics (Table 1), however, a large majority of them (84%, n= 6) displayed an adapting firing pattern in response to depolarizing current steps (Fig.5F), whereas nondriver LC cells were twice as likely to be regularlyfiring (37%, n = 19, Fig.5F). We conclude that the driver hub population is comprised of deep layer GABAergic neurons, with an extended axon towards upper layers, and an adaptingfiring pattern.
Aside from their morphological and electrophysiological properties, interneurons can also be identified by the expres-sion of differential molecular markers (Miyoshi et al. 2007; Rudy et al. 2010;Miyoshi and Fishell 2011). Although molecular marker expression builds up during postnatal development before reaching itsfinal mature characteristics, some molecular markers are already expressed early. Since driver hubs were
Delay (ms) –800 –600 –400 –200 0 200 400 600 800 0 10 20 30 40 Active cells (%)
B
Active cells # –8 –6 –4 –2 0 2 4 0 20 40 60 80 Delay (frames #)D
1C
–0.40 –0.2 0 0.2 0.4 0.2 0.4 0.6 0.8 Time (s) Correlation HC cellsA
1 10 100 y = x –1.15 GABA MGE CGE Number of neurons Output links (%) 10 102 103 104Figure 2. Computing the functional organization of neuronal activity in the developing entorhinal cortex. (A) Functional output connectivity distribution pooled across all datasets on a log-log scale (black circles), power lawfit (black line) and distribution range for all GABA (green), MGE- (blue) and CGE- (red) derived cells (dot: median, range: 10–90th percentile). (B) Representative rasterplot of a network burst with frame 0 indicating the peak of synchronization. (C) Histogram displaying the average fraction of active cells across all network events recorded in an imaging session for 1,6 s time window centered on the peak of the events (gray line: mean, error bars: standard deviation (SD)). (D) Scatterplot of the value for each imaged cell of the average correlation and delay with respect to network bursts, black dots indicate HC cells, grey dots are all other active cells. The blue area indicates the region of HC neurons reliably active at the onset of most network bursts.
MGE-derived with a soma in deeper layers and axon collaterals spanning towards upper layers, and given that their hippocam-pal counterparts expressed Sst (Picardo et al. 2011), we tested for the expression of this neurochemical marker. First, we char-acterized Sst expression within the entorhinal cortex in the Lhx6-GFP positive cells (Fig.6A,B). A large fraction of Lhx6-GFP positive cells (34%) in the deeper layers expressed Sst as com-pared with the superficial layers (Fig.6B). We last analyzed the expression of Sst among patched driver hubs and found that a majority of cells expressed Sst (3 out of 5filled cells, Fig.6C–E). In conclusion, entorhinal driver hubs comprise a subpopulation of Sst-containing GABAergic neurons.
Discussion
Self-generated recurring network bursts are a hallmark of developing networks that influence their final wiring diagram. Using an unbiased approach to extract functional connectivity in large networks and probe single-cell embedment, we show that GABAergic microcircuits are highly implicated in driving synchronization in the developing entorhinal cortex: almost half of these cells are capable of single-handedly affecting net-work activity when stimulated, whereas none of their glutama-tergic counterparts displayed a similar capability. Still, only a
specialized minority of deep layer MGE-derived neurons were spontaneously involved in the build-up of synchronization. These Sst-positive driver hub neurons displayed a longer axo-nal morphology spanning towards upper layers. This finding reveals that similar early developmental programs are shared between the entorhinal cortex and hippocampus to shape their functional wiring during postnatal development and perhaps scaffold their adult function.
Using transgenic mouse lines to label neurons according to their embryonic spatial origin, we show that driver hub cells originate from the MGE. This is reminiscent of the conclusions from a recent optogenetic study performed in the CA1 region of the hippocampus (Wester and McBain 2016). MGE-derived interneurons account for 70% of all cortical interneurons and are classified in 2 major subgroups according to their molecular expression profile: the parvalbumin (PV) and the Sst-expressing neurons. They distribute throughout all cortical layers although Sst tend to populate infragranular layers and to represent only 30% of the MGE-derived neurons (Xu et al. 2004;Wonders and Anderson 2006;Rudy et al. 2010;Bartolini et al. 2013). Between these 2 broad classes of MGE-derived neurons, driver hub cells are more likely to be of the Sst-expressing subtype given that: (1) some of the recorded cells could be immunohistochemically labeled post hoc with this marker; (2) they preferentially GABAergic HC neuron
1
2
3
Network events (#)
Network events (#) Network events (#)
–4 –3 –2 –1 0 3.5 4 4.5 5 5.5 6 *** *** Pre Stimulation Post
Phase Phase Phase Pre 2 3 GABAergic LC cell 1 Post Stimulation Pre Post Stimulation Pre Post Stimulation Pre –3 –2 –1 0 Stimulation 4 4.5 5 5.5 6 6.5 7 ** ** Glutamatergic HC neuron Inter Event ) s( l a vr et nI Inter Event ) s( l a vr et nI Inter Event ) s( l a vr et nI 1 2 3
Pre Stimulation Post
2 2.5 3 3.5 4 4.5 5 5.5 Post 40 0 20 60 40 0 20 60 0 50 100 –1 0 1 Connectivity (OUT:66/IN:0)
Connectivity (OUT:34/IN:0) Connectivity (OUT:9/IN:16)
B
A
C
Figure 3. Influence of single-cell stimulation on network bursts. Data from 3 representative cells stimulated while recording network activity in GAD67-GFP entorhinal cortex slices (P8) using calcium imaging: a HC glutamatergic cell (A1, in black), a HC and a LC GABAergic cell (B1 and C1, respectively, in green); contour plots indicate active (grayfilled) and inactive cells (open contours). Schematic representation of the glass pipette (dashed line) indicates the stimulated cell; arrows show the output links of the patched cell. Only the GABAergic cells (B and C) operate as driver cells: they significantly influence network dynamics when receiving phasic current-clamp stimulations (200 ms pulses 75-pA every 2 s) as indicated by the“network burst phase” plots (A–C2, seeMaterials and Methods) and“inter event interval” box plots (A–C3, seeMaterials and Methods).“Network burst phase” is defined as the normalized deviation from the median network burst occurrence (−1 means one more burst than expected) integrated in time. Scale bar: 100μm. **P < 0,01; ***P < 0001.
0 10 20 30 40 0 2 4 6 8 Network events # Phase Stimulation Post Pre
Pre Stimulation Post
6 8 10 12 ** ** MGE-derived HC cell Connectivity (OUT:57/IN:6) 1 2 3
C
Time (s) Correlation Lhx6-GFP Stimulation Post Pre 0 20 40 60 80 –10 –6 –2 2 Phase Network events # InterEvent interval (s) InterEvent interval (s) 3 4 5 6 ***Pre Stimulation Post
*** CGE-derived LC cell Connectivity (OUT:8/IN:47) 1 2 3 5HT3aR-GFP MGE-derived cell CGE-derived cell
B
A
Figure 4. Spatial embryonic origin determines single-cell network embedment and function. (A1, B1) Contour plots of imaged cells indicating active contours (gray) from 2 representative examples of entorhinal cortex slices from Lhx6-GFP (MGE-derived neurons, A1) and 5-HT3aR-GFP (CGE-derived neurons, B1) pups (P8). Schematic representation of the glass pipette (dashed line) indicates the GFP-positive stimulated cell. Arrows indicate the output functional links of the recorded cells. Scale bar: 100μm. Both examples of MGE- and CGE-derived cells operate as drivers as they significantly affect network dynamics when receiving a phasic current-clamp stimulation (200 ms pulses 75-pA every 2 s) as indicated by the“network burst phase” plots (A2 and B2, seeMaterials and Methods) and“inter event interval” box plots (A3 and B3, seeMaterials and Methods).“Network burst phase” is defined as the normalized deviation from the median network burst occurrence (−1 means one more burst than expected) integrated in time. Scale bar: 100 μm. **P < 0,01; ***P < 0001. (C) Scatterplot of the correlation value and mean delay with respect to network bursts (see methods) for all imaged cells in Lhx6-GFP and 5-HT3aR-GFP slices. MGE-derived (blue) and CGE-derived (red) patched cells are repre-sented depending on whether they operate as drivers (filled contours) or not (open contours).
distributed in deep layers; (3) their morphology could be remi-niscent of the well described Martinotti-cells (Muñoz et al. 2014); and (4) a majority of them displayed an adapting/accom-modatingfiring pattern in response to current injection rather than the typical regular/fast spiking response that charac-terizes PV neurons.
The fact that driver hub neurons expressed Sst has various major functional implications. First, Sst interneurons are among thefirst interneuron subtypes to populate the neocortex (Miyoshi et al. 2007;Miyoshi and Fishell 2011) suggesting they might play an important pioneer role in the functional integra-tion of cortical dynamics at those early stages (Lazarus and Huang 2011; Picardo et al. 2011). Remarkably, recent studies demonstrated the relevance of infragranular Sst neurons for the synaptic maturation of thalamocortical inputs onto PV interneurons and other Sst cells, but more specifically, for the precise timeline formation of cortical layers (Anastasiades et al. 2016;Marques-Smith et al. 2016; Tuncdemir et al. 2016). This process involves a transient innervation of these cells by tha-lamic inputs. In this way, these cells are ideally positioned to relay thalamic activity to local cortical circuits and as such sup-port the early dialogue between thalamus and cortex (Minlebaev et al. 2011). Interestingly, Sst cells can also operate at a structural level, by modulating the formation of inhibitory synapse clusters and dendritic spines in distal apical dendrites of layer 2/3 pyra-midal neurons during postnatal development (Oh et al. 2016).
Nevertheless, it is important to consider that Sst cells are a heterogeneous population. In the visual cortex, up to 6 classes of Sst neurons have been uncovered by single-cell RNA-sequencing (Tasic et al. 2016). In supragranular layers, they can roughly be divided into 2 classes according to whether or not they innervate layer 1 (Jiang et al. 2015). As discussed above, it is possible that driver hub cells develop into Martinotti cells. Another possibility is that they become long-range GABAergic neurons. Indeed, in the hippocampus, early-born Sst driver hub cells become long-range GABAergic neurons projecting to the septum (Villette et al. 2016). The vast majority of long-range GABAergic projecting cells (91%) in the neocortex express Sst together with other molecular markers such as nNOS and NPY (Tomioka et al. 2005). These long-range GABAergic cells have been mainly found in layer VI and connect cortical areas across the areal boundaries (Tomioka et al. 2005). Therefore, this cell type should function in coordinating oscillatory activity across
cortical areas. Interestingly, long-range GABAergic Sst hippo-campal cells projecting to the superficial layers of the medial entorhinal cortex (mEC) have been observed to be relevant for the synchronization of theta rhythms (Melzer et al. 2012). Unfortunately, we cannot conclude at present whether entorhi-nal driver hub cells develop into long-range projecting neurons like their hippocampal counterparts.
The development of the entorhinal cortex shows many simi-larities, but also distinct differences when compared with the hippocampus. Most interestingly, we observed that almost half of the GABAergic neurons could act as driver cells independently from their functional connectivity degree. This is in marked con-trast with the developing CA3, but in agreement with recent studies emphasizing the embedment of adult cortical circuits into a dense inhibitory network, including mEC upper layers (Couey et al. 2013;Karnani et al. 2014). Interestingly, stellate cells of the mEC were recently shown, through genetic manipulations, to drive the sequential maturation of entorhinal–hippocampal networks (Donato et al. 2017). Although we did not sample from any stellate cell in our glutamatergic cell dataset, we did notfind any evidence that single-glutamatergic neurons could influence network dynamics, even when they were identified as functional hubs (Fig.2A). This is in agreement with previous work, where early-born CA3 glutamatergic neurons were shown to be active at the onset of network bursts, but nevertheless were not drivers unless stimulated as a population (Marissal et al. 2012). It will therefore be of major interest to study the interaction between stellate cells and the driver hub GABA neurons described here, as the former may well, as a population, feed the activation of the latter. This finding adds to a number of additional differences previously observed during the development and integration of GABAergic microcircuits into functional networks in the neocor-tex and hippocampus. For example, while hippocampal GABAergic inputs ultimately develop in a highly target-specific manner (Lee et al. 2014) with“sister” principal neurons issued from the same progenitor cell sharing common GABAergic inputs (Xu et al. 2014), neocortical GABAergic innervation indistinctively provides an inhibitory“blanket” (Karnani et al. 2014) with“sister neurons” preferentially coupled to one another through glutama-tergic synapses (Yu et al. 2009). In addition, whereas time and place of birth are responsible for generating phenotypic diversity of neocortical GABAergic neurons into adulthood, recent evidence indicates a frequent dual origin for members of seemingly uniform hippocampal subpopulations as described for O-LM (Chittajallu et al. 2013) and neurogliaform cells (Tricoire et al. 2011). Despite these differences, it is important to acknowledge that both in the hippocampus and entorhinal cortex, driver hub neurons are likely early-born GABAergic neurons (Picardo et al. 2011). Certainly, the preferential infragranular positioning of these MGE-derived cells in the entorhinal cortex specifies an early temporal origin, and MGE-derived interneurons, like pyramidal cells, are generated in an inside–out manner in the 6-layer cortex, with MGE-derived Sst-cells populating infragranular layers being the earliest gener-ated (Miyoshi et al. 2007;Tuncdemir et al. 2016).
CGE-derived interneurons account for approximately 30% of the total interneuron population and include diverse subtypes of interneurons that express 5-Ht3aR (Rudy et al. 2010;Xu et al. 2010). As MGE-derived interneurons, CGE cells can also be clas-sified by their differential expression of molecular markers such as vasoactive intestinal peptide (VIP), reelin and calretinin (CR) in addition to their morphological and physiological char-acteristics. Interestingly, the functional connectivity schemes recently described for these cells, and the VIP cells in particular, may well explain their modulating network activity despite the
Table 1 Morphophysiological properties of driver hub cells and non-driver low connected (LC) cells
Hub cells LC cells Statistics Intrinsic properties n = 6 n = 16 M&W Rm (MOhms) 1014± 351 1375± 237 0.49 Cm (pF) 65± 29 60± 12 0.96 AP amplitude (mV) 40.5± 3.5 45± 2 0.3 AP duration (ms) 3.4± 0.3 4.5± 0.4 0.2 AP threshold (mV) −44 ± 2 −44 ± 1 0.85 Vrest (mV) −44 ± 6 −45 ± 3 0.9 Morphometric properties (μm) n = 5 n = 7 M&W Axon length 4091± 1352 810± 232 0.01 Dendrite length 2743± 834 3887± 1696 0.94 Firing pattern n = 6 n = 19 Χ2
Regular 1 (16%) 7 (37%) 0.35
Adapting 5 (84%) 12 (63%)
n, number of cells; M&W, P value from Mann and Whitney test; X2, P value from
Chi2test.
I
II/III
IV
V/VI
WM
Non driver LC cells
B
I II/III IV V/VI 50µm WMDriver hub cells
A
Axonal length
Regular firing Adapting firing
F
µmC
0 20 40 60 80 100 Deep Superficial DG CA1 CA3 mECD
E
% % 0 20 40 60 80 100Regular firing Adapting firing Driver hub cells Non driver LC cells
500ms 30mV 0 1000 2000 3000 4000 5000 6000
Figure 5. Morphophysiological properties of driver hub cells in the developing entorhinal cortex. (A,B) Composite drawings of neurobiotin-filled neurons reconstructed with the Neurolucida workstation. The somatodendritic domains of the cells are in black. Axons are in green, blue or red for the GFP-positive neuronsfilled in GAD67-GFP, Lhx6-GFP or 5-HT3aR-GFP mouse slices, respectively. Roman numbers indicate cortical layers; WM: white matter. (C,D) Distribution of the somata of the filled cells throughout the entorhinal cortex. Gray indicates nonhub LC cells, black nondriver hub cells, and respectively in green and blue, the GAD67-GFP and Lhx6-GFP cells that are driver hub cells. (E) Histogram showing that the mean length (±SD) of driver hubs axons is significantly longer that for LC cells. (F): Representative current-clamp traces of the 2 main evokedfiring patterns (adapting or regular spiking) and histogram plotting the distribution of firing patterns among driver hub cells and nondriver LC neurons.
fact that they were poorly functionally connected. Indeed, this population supports disinhibition in the adult cortex, mostly via the selective targeting of Sst neurons by VIP cells (Lee et al. 2013;Pfeffer et al. 2013;Pi et al. 2013). If the same connectivity motif applies during early development, then it is possible that the network influence of some CGE-derived neurons operates through their ability to modulate the activity of MGE-derived functional hub cells. Paired recordings between CGE-derived neurons and MGE-derived functional hub neurons will certainly help deciphering this issue.
In conclusion, our data extends the understanding of early cortical organization by showing the existence of GABAergic driver hub neurons in the developing entorhinal cortex. It also reveals how“hidden” effective connectivity patterns can have a functional influence at the network level when artificially acti-vated. Therefore, caution should be taken when interpreting the developmental consequences of cell-specific manipulations without considering the natural recruitment of these circuits into spontaneous network bursts. Self-generated coordinated activity is a hallmark of developing networks but also a charac-teristic property of recurrent networks supporting a cognitive function such as the hippocampus and the entorhinal cortex. This work shows how the differential functional role of various GABAergic circuits in this essential property is determined as early as their embryonic place of birth.
Authors
’ Contributions
L.M., V.H.S., A.B. and R.C. designed research; L.M., V.H.S., T.T. and A.B. performed experiments; L.M., V.H.S., A.B. and A.M. analyzed data; L.M., A.M., A.B. and R.C. wrote the article.
Supplementary Material
Supplementary data are available at Cerebral Cortex online.
Funding
This work was supported by the European Research Council under the European Union’s research and innovation programme FP7 (grant agreement no. 242842), Horizon 2020 (grant agreement no. 646925), and L.M. was supported by Horizon 2020 MSCA-IF-2014 (grant agreement no. 660795). V.S. was supported by La Fondation pour la Recherche Médicale (FRM). T.T was supported by The French National Research Agency (ANR; grant agreement no. ANR-14-CE13-0016). A.M., A.B., and R.C. are supported by The National Center for Scientific Research (CNRS).
Notes
We are grateful to Dr G. Fishell (NYU Neuroscience Institute) for providing the 5-HT3aR-BACEGFP and the Lhx6Cre mouse lines.
We thank C. Pauchet and L. Cagnacci for their technical sup-port. We feel indebted to Pr. S. Muldoon (University at Buffalo, SUNY) for proof-reading our article. We also thank S. Pellegrino-Corby, M. Kurz, and T. Titus, and F. Michel from the INMED animal and imaging facilities. Conflict of Interest: The authors declare no conflict of interest.
References
Allene C, Cattani A, Ackman JB, Bonifazi P, Aniksztejn L, Ben-Ari Y, Cossart R. 2008. Sequential generation of two distinct synapse-driven network patterns in developing neocortex. J Neurosci. 28:12851–12863.
Anastasiades PG, Marques-Smith A, Lyngholm D, Lickiss T, Raffiq S, Katzel D, Miesenbock G, Butt SJB. 2016. GABAergic interneurons form transient layer-specific circuits in early postnatal neocortex. Nature Commun. 7:1–13.
Batista-Brito R, Fishell G. 2009. Chapter 3: The developmental integration of cortical interneurons into a functional Figure 6. Driver hub cells can express somatostatin (A,B) The MGE-derived cells labeled in Lhx6-GFP mice that are also immunoreactive for Sst (arrows in B) represent 34% of the total MGE-derived cell population (inset) in the entorhinal cortex. (C–E) A neurobiotin-filled driver hub (arrow in C) that is also positive for GFP in Lhx6-GFP mice (arrow in D) is positive for Sst (arrow in E). Scale bars: 250μm in (A), and 25 μm in (B–E).
network. In: Development of neural circuitry. Current topics in developmental biology. (Amsterdam) Elsevier Inc. p. 81–118. Bartolini G, Ciceri G, Marin O. 2013. Integration of GABAergic interneurons into cortical cell assemblies: lessons from embryos and adults. Neuron. 79:8490–8864.
Batista-Brito R, Rossignol E, Hjerling-Leffler J, Denaxa M, Wegner M, Lefebvre V, Pachnis V, Fishell G. 2009. The cell-intrinsic requirement of Sox6 for cortical interneuron devel-opment. Neuron. 63:466–481.
Ben-Ari Y. 2002. Excitatory actions of gaba during development: the nature of the nurture. Nat Rev Neurosci. 3:728–739. Ben-Ari Y, Cherubini E, Corradetti R, Gaisar JL. 1989. Giant
syn-aptic potentials in immature rat Ca3 hippocampal-neurons. J Physiol. 416:303–325.
Blankenship AG, Feller MB. 2009. Mechanisms underlying spon-taneous patterned activity in developing neural circuits. Nat Rev Neurosci. 11:18–29.
Bonifazi P, Goldin M, Picardo MA, Jorquera I, Cattani A, Bianconi G, Represa A, Ben-Ari Y, Cossart R. 2009. GABAergic hub neurons orchestrate synchrony in developing hippocampal networks. Science. 326:1419–1424.
Canto CB, Witter MP. 2012. Cellular properties of principal neu-rons in the rat entorhinal cortex. I. The lateral entorhinal cortex. Hippocampus. 22:1256–1276.
Canto CB, Wouterlood FG, Witter MP. 2008. What does the ana-tomical organization of the entorhinal cortex tell us? Neural Plast. 2008:381243. doi:10.1155/2008/381243.
Chittajallu R, Craig MT, McFarland A, Yuan X, Gerfen S, Tricore L, Erkkila B, Barron SC, Lopez CM, Liang BJ, et al. 2013. Dual ori-gins of functionally distinc O-LM interneurons revealed by differential 5-HT(3A)Rexpression. Nat Neurosci. 16:1598–1607. Conhaim J, Cedarbaum ER, Barahimi M, Moore JG, Becker MI, Gleiss H, Kohl C, Moody WJ. 2010. Bimodal septal and corti-cal triggering and complex propagation patterns of sponta-neous waves of activity in the developing mouse cerebral cortex. Dev Neurobiol. 70:679–692.
Cossart R. 2014. Operational hub cells: a morpho-physiologically diverse class of GABAergic neurons united by a common function. Curr Opin Neurobiol. 26:51–56. Couey JJ, Witoelar A, Zhang S-J, Zheng K, Ye J, Dunn B,
Czajkowski R, Moser M-B, Moser EI, Roudi Y, et al. 2013. Recurrent inhibitory circuitry as a mechanism for grid form-ation. Nat Neurosci. 16:318–324.
Crépel V, Aronov D, Jorquera I, Represa A, Ben-Ari Y, Cossart R. 2007. A parturition-associated nonsynaptic coherent activity pattern in the developing hippocampus. Neuron. 54:105–120. De Marco García NV, Karayannis T, Fishell G. 2011. Neuronal
activity is required for the development of specific cortical interneuron subtypes. Nature. 472:351–355.
Donato F, Jacobsen RI, Moser M-B, Moser EI. 2017. Stellate cells drive maturation of the entorhinal-hippocampal circuit. Science. 355: doi:10.1126/Science.aai8178.
Egorov AV, Draguhn A. 2013. Development of coherent neuronal activity patterns in mammalian cortical networks: common principles and local hetereogeneity. Mech Dev. 130:412–423. Fogarty M, Grist M, Gelman D, Marin O, Pachnis V, Kessaris N.
2007. Spatial genetic patterning of the embryonic neuroe-pithelium generates GABAergic interneuron diversity in the adult cortex. J Neurosci. 27:10935–10946.
Hébert JM, Fishell G. 2008. The genetics of early telencephalon patterning: some assembly required. Nat Rev Neurosci. 9: 678–685.
Jiang X, Shen S, Cadwell CR, Berens P, Sinz F, Ecker AS, Patel S, Tolias AS. 2015. Principles of connectivity among
morphologically defined cell types in adult neocortex. Science. 350(6264):aac9462.
Kaifosh P, Lovett-Barron M, Turi GF, Reardon TR, Losonczy A. 2013. Septo-hippocampal GABAergic signaling across multiple modalities in awake mice. Nat Neurosci. 16: 1182–1184.
Karnani MM, Agetsuma M, Yuste R. 2014. A blanket of inhibi-tion: functional inferences from dense inhibitory connectiv-ity. Curr Opin Neurobiol. 26:96–102.
Kerr KM, Agster KL, Furtak SC, Burwell RD. 2007. Functional neuroanatomy of the parahippocampal region: the lateral and medial entorhinal areas. Hippocampus. 17:697–708. Lauri SE, Lamsa K, Pavlov I, Riekki R, Johnson BE, Molnar E,
Rauvala H, Taira T. 2003. Activity blockade increases the number of functional synapses in the hippocampus of new-born rats. Mol Cell Neurosci. 22:107–117.
Lazarus MS, Huang ZJ. 2011. Distinct maturation profiles of perisomatic and dendritic targeting GABAergic interneur-ons in the mouse primary visual cortex during the critical period of ocular dominance plasticity. J Neurophysiol. 106: 775–787.
Lee S, Kruglikov I, Huang ZJ, Fishell G, Rudy B. 2013. A disinhibi-tory circuit mediates motor integration in the somatosen-sory cortex. Nat Neurosci. 16:1662–1670.
Lee S-H, Marchionni I, Bezaire M, Varga C, Danielson N, Lovett-Barron M, Losonczy A, Soltesz I. 2014. Parvalbumin-positive basket cells differentiate among hippocampal pyramidal cells. Neuron. 82:1129–1144.
Marissal T, Bonifazi P, Picardo MAE, Nardou R, Petit LF, Baude AES, Fishell GJ, Ben-Ari Y, Cossart R. 2012. Pioneer glutamatergic cells develop into a morpho-functionally distinct population in the juvenile CA3 hippocampus. Nature Commun. 3:1316–12. Marques-Smith A, Lyngholm D, Kaufmann A-K, Stacey JA,
Hoerder-Suabedissen A, Becker EBE, Wilson MC, Molnár Z, Butt SJB. 2016. A transient translaminar GABAergic interneu-ron circuit connects thalamocortical recipient layers in neo-natal somatosensory cortex. Neuron. 89:536–549.
Melzer S, Michael M, Caputi A, Eliava M, Fuchs EC, Whittington MA, Monyer H. 2012. Long-range-projecting GABAergic neu-rons modulate inhibition in hippocampus and entorhinal cortex. Science. 335:1506–1510.
Minlebaev M, Colonnese M, Tsintsadze T, Sirota A, Khazipov R. 2011. Earlyγ oscillations synchronize developing thalamus and cortex. Science. 334:226–229.
Miyoshi G, Butt SJB, Takebayashi H, Fishell G. 2007. Physiologically distinct temporal cohorts of cortical inter-neurons arise from telencephalic Olig2-expressing precur-sors. J Neurosci. 27:7786–7798.
Miyoshi G, Fishell G. 2011. GABAergic interneuron lineages selectively sort into specific cortical layers during early post-natal development. Cereb Cortex. 21:845–852.
Mukamel EA, Nimmerjahn A, Schnitzer MJ. 2009. Automated analysis of cellular signals from large-scale calcium imaging data. Neuron. 63:747–760.
Muñoz W, Tremblay R, Rudy B. 2014. Channelrhodopsin-assisted patching: in vivo recording of genetically and mor-phologically identified neurons throughout the brain. Cell Rep. 9:2304–2316.
Namiki I, Ishida T, Akiyama Y. 2013. Acceleration of sequence clustering using longest common subsequence filtering. BMC Bioinformatics. 14:1–8.
Oh WC, Lutzu S, Castillo PE, Kwon H-B. 2016. De novo synapto-genesis induced by GABA in the developing mouse cortex. Science. 353:1037–1040.
Pfeffer CK, Xue M, He M, Huang ZJ, Scanziani M. 2013. Inhibition of inhibition in visual cortex: the logic of connections between molecularly distinct interneurons. Nat Neurosci. 16:1068–1076.
Pi H-J, Hangya B, Kvitsiani D, Sanders JI, Huang ZJ, Kepecs A. 2013. Cortical interneurons that specialize in disinhibitory control. Nature. 503:521–524.
Picardo MA, Guigue P, Bonifazi P, Batista-Brito R, Allene C, Ribas A, Fishell G, Baude A, Cossart R. 2011. Pioneer GABA cells comprise a subpopulation of hub neurons in the developing hippocampus. Neuron. 71:695–709.
Rudy B, Fishell G, Lee S, Hjerling-Leffler J. 2010. Three groups of interneurons account for nearly 100% of neocortical GABAergic neurons. Dev Neurobiol. 71:45–61.
Sousa VH, Miyoshi G, Hjerling-Leffler J, Karayannis T, Fishell G. 2009. Characterization of Nkx6-2-derived neocortical inter-neuron lineages. Cereb Cortex. 19:i1–i10.
Tamamaki N, Yanagawa Y, Tomioka R, Miyazaki J-I, Obata K, Kaneko T. 2003. Green fluorescent protein expression and colocalization with calretinin, parvalbumin, and somatostatin in the GAD67-GFP knock-in mouse. J Comp Neurol. 467:60–79. Tasic B, Menon V, Nguyen TN, Kim TK, Jarsky T, Yao Z, Levi B,
Gray LT, Sorensen SA, Dolbeare T, et al. 2016. Adult mouse cortical cell taxonomy revealed by single cell transcrip-tomics. Nat Neurosci. 19:335–346.
Tomioka R, Okamoto K, Furuta T, Fujiyama F, Iwasato T, Yanagawa Y, Obata K, Kaneko T, Tamamaki N. 2005. Demonstration of long-range GABAergic connections dis-tributed throughout the mouse neocortex. Front Neurosci. 21:1587–1600.
Tricoire L, Pelkey KA, Erkkila BE, Jeffries BW, Yuan X, McBain CJ. 2011. A blueprint for the spatiotemporal origins of mouse hip-pocampal interneuron diversity. J Neurosci. 31:10948–10970.
Tuncdemir SN, Wamsley B, Stam FJ, Osakada F, Goulding M, Callaway EM, Rudy B, Fishell G. 2016. Early somatostatin interneuron connectivity mediates the maturation of deep layer cortical circuits. Neuron. 89:521–535.
Unichenko P, Yang J-W, Luhmann HJ, Kirischuk S. 2014. Glutamatergic system controls synchronization of sponta-neous neuronal activity in the murine neonatal entorhinal cortex. Eur J Physiol. 467:1565–1575.
Villette V, Guigue P, Picardo MA, Sousa VH, Leprince E, Lachamp P, Malvache A, Tressard T, Cossart R, Baude A. 2016. Development of early-born γ-aminobutyric acid hub neurons in mouse hippocampus from embryogenesis to adulthood. J Comp Neurol. 524:2440–2461.
Wester JC, McBain CJ. 2016. Interneurons differentially contrib-ute to spontaneous network activity in the developing hip-pocampus dependent on their embryonic lineage. J Neurosci. 36:2646–2662.
Wonders CP, Anderson SA. 2006. The origin and specification of cortical interneurons. Nature Rev Neurosci. 7:687–696. Xu Q, Cobos I, De La Cruz E, Rubenstein JL, Anderson SA. 2004.
Origins of cortical interneuron subtypes. J Neurosci. 24: 2612–2622.
Xu HT, Han Z, Gao P, He S, Li Z, Shi W, Kodish O, Shao W, Brown KN, Huang K, et al. 2014. Distinc lineage-dependent structural and functional organization of the hippocampus. Neuron. 157:1552–1564.
Xu X, Roby KD, Callaway EM. 2010. Immunochemical character-ization of inhibitory mouse cortical neurons: three chemi-cally distinct classes of inhibitory cells. J Comp Neurol. 518: 389–404.
Yu Y-C, Bultje RS, Wang X, Shi S-H. 2009. Specific synapses develop preferentially among sister excitatory neurons in the neocortex. Nature. 458:501–504.