Content and Solubility of Trace Elemient in Veins Quarts From Ouachita Mountain, Arkansas
by
Antonio Quesada Esteves
Geologo Universidad Central do Venezuela (1962)
Submitted in Partial Fulfillment of the Requirement for the Degree of Master of Science
at the
Massachusetts Institute of Technology
s,\ST.
TEC LINDGEN September, 1965 Signature of Author Certified by Accepted by-Deprt ient of Geology and Geophysics,
10, 1965
i hesis Supervisor
'Chairman, DepaKrtmental
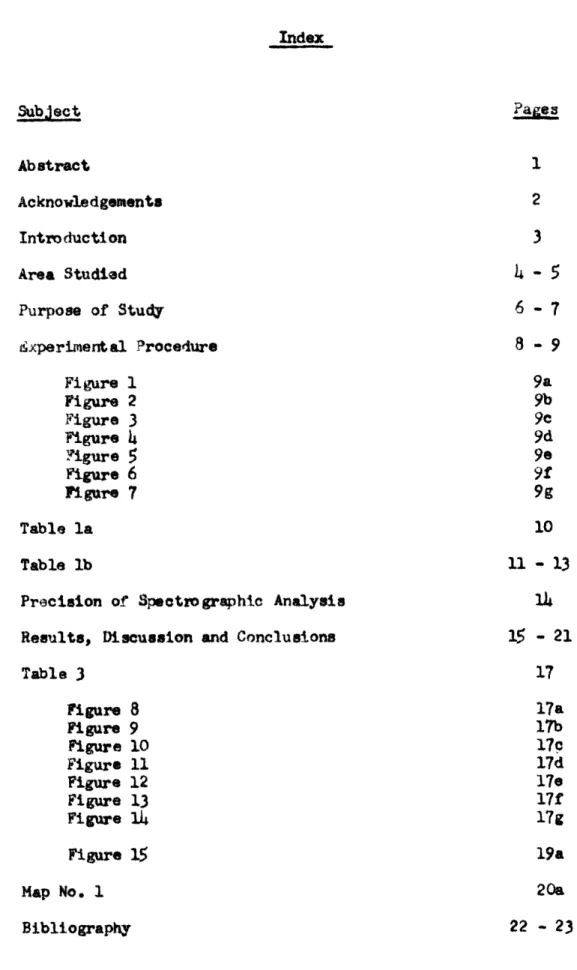
Index Abstract Acknowledgements 2 Introduction 3 Area Studied 4-
5
Purpose of Study 6 -'7 &xperimental Procedure 8 -9 Figure 1 9a Figure 2 9b Figure 3 9c Figure h 9d ?igure 5 9e Figure 6 9f Figure 7 9g Table la 10 Table lb 11 - 13Precision of Spectro graphic Analysis 14
Results, Discussion and Conclusions 15 - 21
Table 3 17 Figure 8 17a Figure 9 17b Figure 10 17c Figure 11 17d Figure 12 17e Figure 13 17f Figure l 17g Figure 15 19a
Map No. 1 20a
Abstract
The trace elements of a suite of quarts samples from hydrothermal veins from Ouachita Mountains whose temperatures of formation were previously determined by A. E. Bence (1963) was measured spectrochemically using the technique described by W. H.
Dennen (1962)
The values obtained were plotted in curves of temperature
vs. concentration and show a possible use of quarts as a geological
thermometer.
-Acknowledgements
This study is part of a program in trace elements in natural quartz conducted by the Cabot Spectrography Laboratory,
and is submitted as partial fulfillment of requirements for the degree of Master of Science. Financial support was received from the Consejo de Desarrollo Cientifico y Humanistico de la Universidad Central de Venezuela, by a scholarship at the Massachusetts Institute
of Technology.
I wish to express my sincere thanks to Dr. William H. Dennen,
my thesis advisor, for his comments, criticisms, during the analytical experimentation and for constructively criticizing the manuscript.
I am also appreciative for the collaboration of Stanley Heath who read the thesis and offered many helpful comments.
I am further appreciative of the kindness of A. E. Bence who has permitted the use of his thesis material.
Finally, I wish to acknowledge my debt to Mrs. Mary A. Ellis for typing this manuscript.
Introduction
Consideration of temperature and concentration of elements are necessary for geological thermometry.
One of the most promising chemical approaches is that of
Ramberg and Devore (1951) who suggested the possibility of using the
partition ratio Mg (Mg + Fe) in coexisting olivines and pyroxenes as
a geological thermometer.
Bambauer (1961) in a comprehensive survey of quartz veins
in the Swiss Alps, found among "ordinary rock crystals" and smoky quartz that the content of contaminating elements ws: Al 4 150,
Li
z
100 and H 450
per million Si;* Crystals with a mimetic structure formed by lamellae of lower symmetry contained Al -200 - 2500, Li 100-. 1300 and H +1- 60 - 1200 per million Si. A direct correlation was observed between aluminum concentration and the sum of the hydrogen and
Lithium concentration.
Perry in his Ph.D. theses (1963) found that under controlled conditions the aluminum concentration of quartz can act as a sensitive geothermometer.
The hydrothermal quartz veins from the Ouachita Mountains were used in an attempt to apply these relationships on a broad regional scale.
* Bambauer uses the term "per million Si"
but reports his data as "per million 3102"
-Area Studied
In the present work, the investigated area those used by
A. S. Bence (1964) who studied the inclusion thermometry of a number
of quartz veins in the Ouachita Mountains, and who kindly permitted the author to use his material.
The following description of the quartz crystal deposits
in the Ouachita Mountains is an abstract from Bence's M. A. thesis:
"According to Miser (1943,1959) and Engel (1946,1951) the quartz deposits are genetically related to the Middle Pennsylvanian
Ouachita Orogeny. East-west trending fractures, formed by compressional
forces early during the orogeny opened up later during the uplift of
the main anticlinorium (Miser
1959).
Silica-bearing hydrothermalsolutions rose from depth along the fractures and deposited quartz as
solubility decreased in response to lower temperatures or changing pH near the surface.
The country rock enclosing the veins are generally highly folded and jointed whereas the veins are relatively undeformed, in-dicating that quartz deposition took place late in the orogeny when the intensity of the deformational forces was decreasing.
The lithology of the country rock greatly affects the size
and distribution of the quartz deposits. The majority of the veins occur as fissure filling in highly brecciated sandstones. At the
-contact with a shale unit, the veins terminate abruptly or branch out into many fine veinlets in the shale. The crystals from those
veins are the typical low-temperature form of quartz having
trapezo-hedral symmetry due to unequal growth of the rhombotrapezo-hedral and prism faces.
The source of mineralizing solution is still in doubt.
Miser (1943) suggests a magmatic origin, but Engel (1951) believes
that there is no evidence to support this. Engel suggests three
other possibilities, (1) Comingled metheoric and magmatic water,
(2) temperature and pressire increases at depth, and (3) a
Purpose of this Study
The works of Bambauer (1961) Frondel (1962) Dennen (1964) Ritter and Dennen (1964) report different elements that enter solid
solution in natural quarts and suggest the possibility of using quarts composition as a quantitative measure of the envirornent of formation
of a rock.
The goals of this tudy were to find what elements enter into the composition of hydrothermal vein quartz and what are their solu-bilities.
The quarts studied was obtained from hydrothermal veins in the Ouachita ountains, Arkansas. This quarts was previously studied by Benee (1964) who made determinations of the temperature of its
formation, using the liquid inclusion method of Sorby (1858).
To cross-check the accuracy and precision of the determinations made, some of the samples of Bambauer and Dennen were used as standards.
One goal of this work was to see whether or not a meaningful relation between the concentration of foreign elements and the temper-ature of formation of the quarts could be established. There are
evident defects in this approach; first, there is little information
on coupled substitution (Al - H) (Kats 1961, Bambauer 1961) and quartz
in any case is not an ideal solvent for aluminum, iron or magnesium.
-Second, the temperatures reported by Bence (1964) cover a large area in proportion to the samples measured. Third, it is possible tha-t the data may only show scattered points over the temperature -concentration region available but represent a significant point
on an extended temperature - concentration diagram. For this reason,
the data was plotted on a general carve derived from data obtained in the files of the Cabot Laboratory and literature. If nothing more, this work should justify the laboratory study of element
solubility in quartz under controlled conditions.
-Exerimental Procedure Separation:
The system used to obtain material for spectrochemical analysis was devised by Dennen (1964). It is intended to pervt a minimum contamination during the preparation of the sample.
Only a restricted portion of each of the different
crystals under study (5 to 10cm long) was selected. This was done to avoid any chemical error, which might result because of the radial zoning, which had been noted by A. E. Bence in his work,
A pair of steel pliers was used to break off a chip from the border of the selected area, these chips were then crushed with the pliers, screened to -40 +100 mesh and soaked in 6N Hl for a day. The acid was removed by washing the sample with demineralized water, and the grains were then stored in gelatine capsules.
Another source of error is the inclusions, visible or microscopic. To avoid these, the sample was put in acetone under a
1OX binocular and grains having an inclusion or stain were removed.
The microscopic inclusions which are still in the grains make only a small variation in the analysis. The following quotation from Dennen, July 1965, exemplifies this,
"A measure of the amount of contamination resulting from the use of quartz with microscopic inclusions was obtained by com-paring materials selected by the procedure described with analysis of the same material free of microscopic inclusions. The particular
samples are those which were used by (Perry, Ph.D., M.I.T., 1963)
He studied low quartz taken from a quartz-kyanite schist and, by a series of careful cleaning procedures, including ultracentrifugation, and was able to obtain samples free of microscopic impurities. The
comparative data for Al in ppm is,"
Perry Dennen
C5
109 114C18 77 85
023 39 40
The chosen grains were placed, using pure copper tweezers, in the crater of a pre-arced spectrographically pure graphite electrode which was then arced.
The standards used as a reference were prepared by a mixture
of a known amount of the elements under study with a high purity quartz
glass in a boroncarbide mortar. Ihe concentration data for these
9 8 7 6 5 4 3 2 1 9 8 7 6 5 4 3 2 1 9 8 7 6 5 4 3 2 1 >N N 3 a 4 a 0 1 0 V f a 4 Z) u 1. -, I n : -T-. -, U M -~~ --,- -T -r. -4 -- -.4- --7i 4 $ -. J- d -I~ -- -r n S -T I *! 7: --I T- i , lT -T- I 'i -'TT ta4 i -r ui t tTH -7: --r- -I- -I- -n --11 I -t ll -+- ---H 7 -ll I- H- -H -7 ZT T ] -T --I --- T -24 1 l l -1 -, -i r 1 TIT TI T Tl i -T~ ~ -uT -HtII -- 3 -t, t T: -A 4- -I r3 -- 14 u: ----p III- T -T l T T -r -i r i Tll- t-i t t --d -. .;- T -T- 1T -1: T 3 4 5 6 7 8 9
N
N
NN
N
" .F3 .4 1 . 4 IOT 4JUU--1 -7 4 tt -T- 1_ 1 q: 1 '.- + r r, I47-7 K~7ITH.
1 -T-1~ F. 4411iK 2J l Fr~ [I .4. ri- TTI F I -4' r i 4 3 71 IF' I' F~l ,'ir I [irI -Ii ilh :2 -1 -t 1' 1 FF ;F I~ R: 12 17 li~~ I ... ~1IFII 71 --T" I F Q < jrfii 4 22 1F 1 1-E ... '-1P FP,'I IF 1 FTF~ FFj:
-i7 IT [F F1iF F* , 77 84 2 3 - -----1
-2a -F-- ____4 -I r - t --2 --1± r 7 3-- --: --j -C IL pT an 1 -"Tl -! r ? -r 2-11-1-
II-I
7 f[ - --H- --- -- -!" -:u
-1 -i 1 -~~~T t4 --- -p . u --- -r -- TTil T 1 -O!iL 3 -a -I t pT- l ---- n; --i T -j 7 t --1 TtT T ] --1- - -Ti L T -~ n'T I --1 -r I N T; -l r _ '-- T -- . l - ---;: : -, -- -a p7- t -n -,: Tr T-u u- -- -1- -A i i -rT -- -l I -t -1 !- 1 1 i , i 6 -it -J F it -:: --- -t - --t -- --1 -T- -I r -i -l -i I t 4 1 7~ ~ -L --1 -1 -41 4 i 1r- -1- u4 -ll -I u 2 9 2 3 456783 4 5 67891 2 3 4 5 67891 .01 '-~ I/do ~1/ N S 144 t 'J NI 2 3 4 5 6 7891 /4'0
IN
la 01 A 8 -1 8 'T t. 7 --- * - --r -I t } I -5 --- -tc
-n -v* 3 ---- -1a
n -T 7- 4 T -t1 , tT 3 . j i ---- -FT -T 3 2 --i- -]1 ' 1 41 T 1 -4 --TT 1 T T T -r ,hrm- r-'t5ftd .-VT; j
T U---
-bi
T-
-r
4 H --ae-
II-2-f,
-t
1
-_
-t
1r
-i.-jW
L- T-n"f _ 1' -t t t T --1 T -U -T UT OT T --:- ---- -_7 -r~ --- --n --T --- ---- --- --i- *- a -7 __ -; --:: : : 5. -L t-r -4 ~ Ir i -- 1F-- --1 --_ -1 1 - --I -r -E --- -4 ---- -u -4-- t r -tr 1- 1-?1-1---- 1 * --T'f 4 tuT -5 -r -T _1 -11 r ! 11 __ _1 r i inT I- -t I '7/ /Vt #4//Miii /17////Vv 1 2 3 4 5 6 7 8 9 1 2 3 4 56 7 8 9 1 2 3 4 5 6 7 8 9 1 2 3 4 5 6 7 891 3 4 5 6 7 8913 4 567891 2 3 4 567891 3 4 567891 2 3 4 567891 2 3 4 567891 V h.1 ~I~iIt4.iIl4~r---y4- I441II I: 4, Tt. -P- -Y -'- ---
-7
ii4 TT__--1
t-I - --n-uq
ps4 44-- ti T z1 Vt--14 4zg tL
iL
t 44,
_J1
4
4
442 i
. --4 -A1'7 IT -ib --1 3 IT lJVwT i t 11 1 I il- 7 1P -U 1711 f Tt1 -~J: -=t--. it EF t u Tt 1/9
N N N A At -3 4 5 6 7 891 -A_ A I :I A 2 3 '5 7 891 2 3 4 5 6 7 891 3 4 5 6 7 891 2 3 4 5 6 7 891./
-4 4- . I -. ..h-141 . .. . .. .-H-t-4-+
TMI-r~ 'Um
4~4~t-~-~ 1A44 A1~E1LH-EE ~ Fl ~ ~ f El -~+ii~
~HFE~-ttvFtrTtlTtl 1-4-1 v-ti-I
4 I n tLr tLtIzIzlirrz!zi
t :Ijj-lrf. V i4 FE4E 1-q - A Ili 114 I' il 41P [ 14* Atfl if, 17,
1 41- . I -;I Wi 14 jj 7 I-Tr r T' I I iT R J.M CID PTT-. T r J1 +1 zmmmm M, 4 4-TTF I ItT +t4 Tf T'i -TT Fri I -;9T u 144T wz .. .......... it- -H +-:-H 1 4. i-- 1+4 77:7 + T1 tr7-4 4--$k mill - T: ti F it IP FT pf I IT T? 1 q- 1 LJ M 1 + 4- J TtU -F-;ti + 4--IT! 14' 7 TF-it 11 :11 u UT i OD Tr; -1 :I!; 4i 4- :14-rl t7 T R -t=t it, i J, 1; Ln 4 1: ;71 1' 7T -- Tt 7-RT I T NT' 3 F al" :;4 pt 5 A t 41" t , ; - --1 T-- -T-I T Irv il 1 4 T4 t-L T 4i T L. I rl, H + , 14- 111 1 -1 r1 t 1-1 r 1 1 117:1 1 Ii 71 IT' 7: El ! -i i T l 7 11- 7 -1 1111 ifli I I ill - j T F1 11-1 Tf J L Lit i t i I Th I T t4. M=t 4p. -P--, 4- +t tz --ftff 11 4-T+ ++4- -+1+ fmlfl TH- M -tl k# ftt + 4;i 4 I.pLl. l I 411 51, -1 q W-,-t- TP 11-i 4T + 4 444+ - . --t- - - 11 11;,! u - . AL,-. -'h' H11 4 1,-,-TT T LL -,-ci TFT ill :T.1 it +4 F -I 1HT T t LL i I M .. T-; 1-iTF 1 i i 1 'Af e/f =H tr~t4M 'K3 N 1 ME OAS% -14jP I.444 f-4-4 EF-TUra 1=1: f It fffl
w1w
-- IM CID rl IID LO Iq (n CM 4111- IM a) r- (0 Ln IV cn C14ze/ 14r1&
13112-1K11*11-K
8 7 6 5 4 3 2 9 8 7 6 5 4 3 2 1. 9 8 7 6 5 4 3 2 0.1-A
L;
'I!~~~~ TITV444 I{ 4 F.1 .j . I , -- -7 1t-4 --r- -- -', -, t- t -- -i -T 4-4 1 --4 pu7 _77 vtl I ':;Ti4n
u
+
-4-t
WT
-t 77 --i --H -, --I 11 -! 4 -1- 1 T I I u ----rT -1 -Tr-a -Tl 7 I --- L I ', -T -i Ti- u _T I'-:[ T--* 11 -- -1 -1 I1~ L 1111 Til 11F___f 7 _- pI -1- * Tf -l -1 ---- -ll -5 --F i 1. -- I- --t --Ai-p--- -l + -T- r- ----T-I 1- 1-- -T 1 17 -n -1 Tn 1u Tp n ni MW-T -T -- -* * ! -*', -: --, - --: . .-T--- - T- ---~~ - --~ --- -1 -w:- -Ti~ : -7 .p -7 ' ' ! t l- -l -1 . --1-7-r -T --- -~ 1 l- -t --I -F -- --TT -- -- --il 1 t -i nL! -T-7 .a 1 T T~~ TTha Hu ---M V i T --tM1l
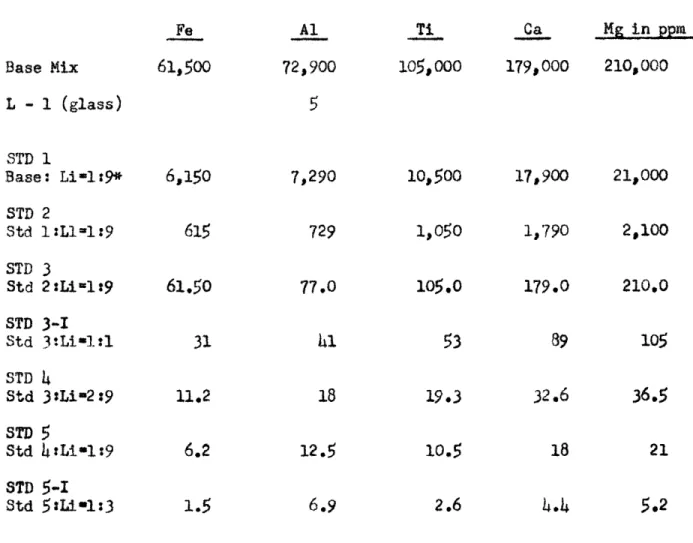
L 11 11 Th --L 1 11 I-,-r -;I !/l 914111 9Table la
Analytical Standards for Fe, Al, Ti, Ca, Mg, Determination in quartz Fe Base Mix L - 1 (glass) STD 1 Base: Li-l:9* STD 2 Std 1:L1=1:9 STD 3 Std 2:Li-l:9 STD 3-1 Std 3tLi*l:1 STD 4 Std 3SLi-t2t9 STD
5
Std htti.1:9 STD 5-I Std 5:L101:3 61,500 6,150 61.50 31 11.2 6.2 Al 72,900 7,290 729 77.0 41 18 12.5 Ti 105,000 io,5OO 1,050 105.053
19*36.9
2.6
Ca Mg in ppm 179,ooo 210,ooo 17,900 1,790 179.0 89 32.6 21,000 2,100 210.0 105 36.5 4.4 5.2*mixing ratio by weight
-Table lb
Analytical Standards for Li, Na, Determination in Quartz ppm Li ppm Na V-05 V-5 7.5 STD Li-i 1.04 STD Na-1 19.8 STD Li-2 1.6 STD Na-2 28.5 STD Li-3 2.74 STD Na-3 46.5 STD Li-4 5.00 STD Na-h 77.7 STD Li-5 11.4 STD Na-5 139.0
These standards were cross-checked with other standards whose concentration had been reported by other analysts.
Spectrographic Analysis
The procedures for arcing and spectrochemical determination followed those established by Dennen, 1965.
Table 2
Spectrographic Conditions (after Dennen 1965)
Spectrograph-Nilger 3 meter quartz-glass Littrow-mounted prism spectro-graph
Plates and Development - Kodak Spectrum Analysis-1 (2750-4200A), Kodak Type 1-M (5700-8200k) plates developed for
h
minutes at 190C in Kodak D-19 developer in a
time-temper-ature controlled tank.
Electrodes - Saiple - National Carbon Co. AOK8P Specpure-graphite rod
provided with a 1.5 mm diameter 3 mm deep cavity
Counter - National Carbon Co. Lll3SP Speopure carbon rod,
pointed.
-All electrodes prearced 10" at 6 am±ps prior to use.
ixcitation - 9 amps anode to completion (30-40 seconds.) 7 mri
ana-lytical gap.
Optical path - source focused upon (masked) collimating lens by quartz lens at slit. Rotating disk sector passing 1/1, 1/4, 1/16, and 1/64 of incident light at slit.
Photometry and Plate Calibration - Nilger nonrecording
microphoto-meter. Stop-sector method of calibration used for "red
group" (see below.) Preliminary curve method used for "blue group."
All intensities corrected for blanks and plate background.
Spectrochemical determinations - Element concentrations obtained by comparison with external standards prepared by dilution of appropriate oxides with rather pure natural quartz. Blank corrections for quartz used as diluent obtained by addition method. Several standards and blanks included on each plate. Gravimetric corrections necessitated by use of quartz fragments as saaples were made by weighing indivi-dual samples for "red group" and by intensity ratio of the unknown element to Si2970A for the "blue group." Numerous cross-checks were employed.
-Lines used Line Approx. detection limits pm Sodium Lithium Potassium Manganese Magnesium Silicon Iron Aluminum Titanium Calcium, 5889.6 6707*8 7664.9 2794.8 2852.1 2970.3 3020.6 3092.7 3234.5 3968.5 .1 red group 1 blue group Traces in electrodes Standard Unlised Si line at 3019 Interference with OH fine structure - 13 -Element Remarks
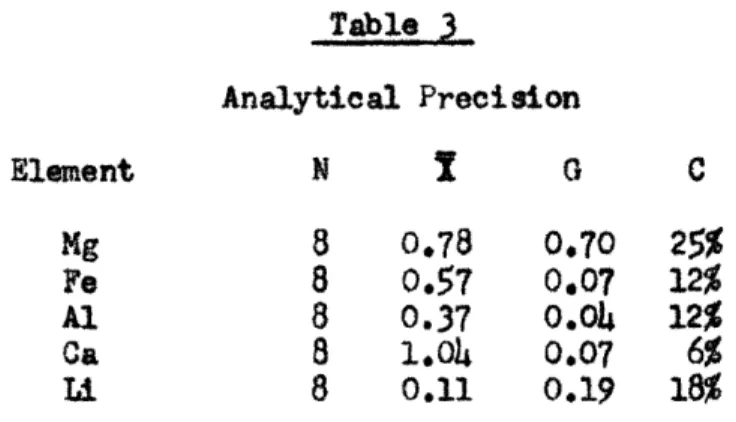
Precision of Spectrographic Analysis:
The analytical precision may be judged by examining the ana-lytical results of the spectrographic determination of different elements
in eight samples which are given in Table 3.
Table 3 Analytical Precision Element N i 0 C Mg 8 0.78 0.70 25% We 8 0.57 0.07 12% Al 8 0.37 0.04 12% Ca 8 1.04 0.07 6% Li 8 0.11 0.19 18%
This tabulation shows the analytical error for the same prepared sample, but not any effects of sample preparation. Such preparation errors are believed to be small. There seems to be no
question that the variation in foreign element content observed is much larger than analytical variations and hence is real.
The accuracy of the analysis can only be evaluated by comparison with reference standards and reported data from other analysts. From such comparisons, accuracy appears to be good.
-Results, Discussion and Conclusions
Thirty-three selected samples were analyzed and aluminum,
magnesium, iron, sodium and lithium have been measured. H and OH
were not measured in the present study. H was however, determined
by an indirect method (Table No.
3.)
The cation deficiencies found in these samples suggest that either H or OH must be present, which is quite possible in quartz which has formed in a hydrothermal environment. (These samples came
from hydrothermal solutions whose temperature ranged from 116 to 2020C
according to Bence.)
At higher temperatures, hydrothermal quarts should be able to
contain higher concentrations of foreign elements up to some saturation value as indicated by the variation in the high-low inversion
temper-ature of saaples taken from different environments (Keith & Tuttle) and by the variation in the unit cell dimension of certain samples of
synthetic quartz (Frondel & Hurlbut, 1955.)
Following crystal-chemical rules Al may readily substitute for Si, the compensation of charge occurring by the concomitant entrance of a small positive ion into an interstitial position. Univalent Li, Na, or H or divalent Fe may serve by going into an interstitial position in six-coordination with oxygen. Iron may occupy either an interstitial or tetrahedral site, notably depending upon whether it is in the ferrous
or ferric state.
-The solubility of these elements in S102 is a function of
temperature and chemical potential, but not often are these elements
found at saturation in hydrothermal veins.
In the thirty-three saples examined, twenty were lacking
Na, sixteen Li, and two Mg. Since these samples occur over a large area, these variations give an idea about the differences in the hydrothermal solution which were injected in the region. The samples which have foreign element contents in, or nearly in, the saturation region coincide with the geothermic anomalies reported by Benee Map No.l.
If the foreign elements in the solution are at, or above the saturation amounts to saturate quartz forming at a particular
temper-ature, then their determination can be applied as a tool in
geothermo-metry. In an attempt to relate observed, aluminum, magnesium, iron,
sodium and lithium concentration in quartz to the actual temperature of formation of the Ouachita Mountain samples, a series, of temperature-concentration curves have been plotted, Figure 8 to Figure 13. These points represent the temperature average and the median values of a
series of spectrochemical analyses in each sample. Table 3.
-Atom / 106 Si Sum. Temp. No. Al hg Fe Na Li Al Xg Fe Na Li H 6 7 9 10 14 15 16 17 19 21 22 24 25 27 28 31 32 33 36 39 41 42
45
46 48 49 50 51 5253
54 56 57 430. 3.50 90. 0.70 90. 0.75 28. 1.10 50. 1.90 80. 0.70 30. 0.52 170. 0.6054.
1.00 17. 0.70 15. 0.19 21. 0.90 85. -4o. 0.35 80. 1.04 42. 2.00 110. 0.90 35. 1.10 35. 0.60 4o. 2.1075.
100. 1.10 35. 0. 44 1000. 0.54 4o, 0.35 25. 0.01 48. o.16 20. 2.30 900. 17.00 150. 1.10 150. 1.4o 34. 0.80 60. 2.30 1.70 0.80 1.00 0.60 1.70 1.00 0.36 2.50 0.35 1.00 0.70 3.00 2.35 2.10 3.70 1.00 0.70 0.35 2.30 6.40 4.60 0.70 2.00 2.00 1.00 3.00 1*30 5.40 2.50 9.00 5.20 2.00 52.0 3.0 2.8 -1 4.8 -- --68.0 17.0 57.0-7.04 --~-- 1.8 -- 2.7 -- 1.4 0-- ---A-f 13.00 66.O 5.0 -- 4.6 9.0 27.0 65.5 11.8 --400" 0.9 --av 0.1 46.0 15.0 -- 0 18.0 40.0 18.0 8.o -3.0 -1 480.0 90.0 90.0 28.0 50.0 80.0 30.0 170.0 54.0 17.0 15.0 21.0 85.0 40.0 80.0 42.0 11.0 35.0 35.0 40.0 75.0 100.0 35.0 1000.0 40.*0 25.0 48.0 20.0 900.0 39.10 150.0 2.52 150.0 3.22 34.0 1.84 60.0 5.28 8.05 1.61 1.72 2.52 4.36 1.60 1.19 1*38 2.30 1.60 0.43 2.06 0.80 2.38 4.60 2.06 2.52 1.38 4*82 2.52 1.00 0.80 0.02 0.36 5.28 1.70 0.80 1.01 0.60 1.71 1.01 0.35 2.52 0.*35 1.01 0.70 3.02 2.00 2.12 3.72 1.01 0.70 0.34 2.32 6.46 4.64 0.70 2.00 2.00 1.01 3.02 1*305.44
2.52 9.08 5.20 2.oo 12.12 16.16 68.68 22-62 1100O - -048 -- 6 68.685 10.90 18.58 394.61 71.43 87.27 21.47 43.30 71.54 28.46 166.10 51.35 14.39 13.87 15.92 51.28 28*31 99.97 21.24 25.65 8.72 22.48 1.84 14.72 63.52 3.41 5.85 82.96 82.96 69.54 8.08 00 18.30 80.n 1800 56.12 48.80 9.76 3.66 - 17 -Sample P P m Table 3 40.00 878.00 15.35 3.55 --fw 23.973.55
41.07 0.24 13.18 60.60 738.74 72.72 72.24 72.72 16.18 --00 17.20 --ON 49.0685.93
18.57 2.73 6.53 6.07 8.46 1.54 3.90 2.65 2.61 1.13 5.08 153.64 72.46 28.72 13.69 10.03 13.76 9.35 31.28 52.52 98.16 20.28 122.00 36.45 1.03 6.93 6.82 161.26 77.76 133.82 16.80 10.94 152 180 175 197 174 122 153 134 165 150 16 159 124 162 174 158 152 148 161 143 192 190 14o 135144
131 151 158 158 178 202 159 125--- - -- 1--
4
_--L-W"
T F m z -- T - 4 T TT $Li i_ t -4-- - --'
'
LK4
b-4
-zm K<Htf7
LK L - - - - ] D t1T -E. - O' d$ FIF t -a4 - T A ± m I- I I -TLi ivr -~~~F -P -r- T- -1 . .r rp L~ I L!<~I
'fir J4I I I~ti -T- - - -
-- -
-I-
-
-I7 -t- - - -F --- -'
-I-- - - - I - - -I- - - A -L -i--_
*l -- - - - - -T -t - - J E $ T r - $c I r r _;$ -L t -Ac - i-i-- - -c - q -T-- -- -r --- T-- -- -F]-' u E T -1 ' -_ - T 1- T- LL
41-
'L Lt
$ -V u u u-- - L - 1 -t 1-7 1 - T 7 A- L +W - - -- - -- H7-A-L L TH ._ p ]p + - - -- - - -- - -4 --i - , - - -:' - - -- -I - T T7 - i 7 -77-- - 7F T I_T
t
_
LT T4 T0
- _] L 41 - T - - - -- *E* - -T L _ _I _L - L _ - 1 -H . ... -H L IL E 1 --1 -- * - - -- -- - 1- - - - -_L _ -i T_ - - - -- ---- -4- - -LL ± IUL H-H i HI +I I +II iii H tht~i-i-H-V H-HTh-I±1 H-HF -'H+H+H +HII-H-HHH I-H H! Hi-i7 4
7/VP
0< I I H i i i I i -H-FI1 --± ELL 11111 All 11 4+41-1-L+-MUE4,
i I I I I I I I I ! -p- Q$gV177T-iu7+~-iL~v1
1kiz~L~
ThI
±11T.
-7T ffth dF-TLTE'
__4T
-!-Tj 7-- i 1 1 J -- i-+V _ p-M F 2IITJ I-_ _-j -Ti- -T7 441 T LTI f 71 v, -F- 7 -11 F_ F L p-74 LFP -- I~ ii I IF-;1
4 ll Im
~ ' + 4-T I T- _~rLi
2k
hi LL -F 1 F 11t1117~1
I-
-- 4-7 .cI
I
jT
7 ~ ~ JJZ L ~1'V'1±H1
1f 4P,
427~~T 7 17II-F_ T__~ 1 I--iV1I _T I v,'- -iI_ ji~~~L 1- -1A [Ii f-1~1 .ELL.U~.I -±~1ItLIL 1 7- it Fil 11 M 1 171 _77 T J-I T-F, A / #/V4,7 // a I -1H-FI7 77 I- L Tj 1 -I-!A -I- 11 !i I_
1I
Ij "' 21 1 . t 1_ + }, -ILT f7117 ,2 -- --4 11v 4 -7- '1-{
T1j1 T T I ILL:!u '7' i + LII .... ..j
-T 1 1I4 1 -L J L -T I ILI I I !- 1 LT ;A -T 1 T 1+'--~ 1 4 ..-' -4J ._ tr_~- - --71'~~~~~ L 41 - --' ~ t I I i i 31F ~ -L1 I -L, . IE IT I -1f T~I7 3 1 -442 T I'L rr A 1-Il I I :- h ji ' -!T 1 -I ] I A I I 3 -1-1 1 1 :1F -i I 17 uT I Ht T --i ~ ~ I I -I± I-[ rI Li -7 il .. --I II I 4 -j-I -7~~~~~~~~~ . -+ H:r
r
H
l
-I.-. -- -- e--k- + -$E lal --n-i-iF-iF ITiiF H 7--t 0/++
+
L
7 T 1 7 1 1 Tl ii I I I I -I I I I . I I I I I LLI F -7 . . . .. .. . .. .. . .. . . . .. . -i -1- r1 1 : lV ~ .,,. V T ~ 1 ~iI 7-r-'---r-- ~ -r-~ r -*- -VCLL '-l-! ! n I Ltf I1 ~
T
L
7
H
L.
''I .1I
---
---
--
-4__
-7-
1
--+-ITt
j
-1 -r -Kj-. -4 --1 -1 F T -.. L ! -- -1 ---,-
1
-A --1 -I- -~'i~~'17I-ii~
-I r -i --: --- n -~~~1~T
7
4
777~
-rI _ 1141 1111W] ± 411 HI ItLiKit i'T2
.01 I*
--1
I!,] -I-1 --
--1r
--t---I-
-T -.I1 -- --L-- +- -t -__ 1F1 -T ;-'
f
-4
--7--
-_K
i
-
l----
--
-1
-.
.
1--
---i wI
2 I~1 --,.-I--
.-
-
----
1
1
~ -~----
---
.--
.
-*
-I
.. . . -+-- -, --_-t
,-4A
§-
-4-
---
--_-
---
---_ ~I l- ---I
-TI
--I
...
_____.i~L... /00/0
i2/6//W
A A h) ; -1 1 -1 t T --- -I I i -I : I I , I [ , I i -- -;- I---- I -I -I -I -- I I-!~~~- --. + ~ + - r-r--oA 4-1 r~ - - -LI I -
/-
-pp _ -LF1 -{ - tr -ro- - -4- H n4
-P t -c 1u ~ 4 icD
-Lu I~ F A f Ii L - t4 j 7-T F ti i Tr - t + -1 I I I} ~ ~ 1 + il I-~f 2 I Lb? Ji 1.<" 7 rl ST -1p7p 1 -c--7 I- $L--+-a 1 - - F :1 ft SL - -- - - t -F T H-i T i l I, T_ -- H----ILI H tb - -T-7-1-1'
-F-p -1 t- p -f - -- u Tlu - I 7 F7 I r i Pt 4-PAf-FIWW t>> cc] - - - -- I r - C - T t TtE
T--L--i vD --T -V p I= I LL I L ' "7l d -- H t - --T -- -1 - -I -I -l - -T -- --br~~~ - s -H-T - - -- - -I + -l J i; l-- El-- -- -d-h-7 no -+ +L - T - -- - T ; T - -i , r7 ---- 7E... p -C-:75 -V _7- - -F -1 -1 - Hd--J $4 - -- F-1E$ TI - T1 T - -- - - - - -- - - - -T 1 I~ - FT IFF T F4 I I F- + -i-vr
I'IIIIIII' "1 +4-+4I--K
xx 'N'xx
I . I I I . I T$ L AMIRM-1.
- - - - -H - H -1 H - 1 T -
7
Cf
~T - -E a-~ - n -A 11 *F pA _ LIF - TT - - I T1 - -- $- n --- : TK
-- - - u-F: F t -- -1 -C -E~ - - - - - - - T -- ~- L -1 --HH H -l -li - I I 7 [ ,II I I .+4Kt-
I - c-T ---- -L1 u I 1 -- --- - - - -+ - 1 H -- -r - --- -T
- - --- I-A -- FL - - --- J-K C l D - 1 -. -L 114 S L. L Li- ] -- -F- 0 E r - - L U u-J -- -_ -- -4 .u ~E L ~ m -T] T+ I-' F,i-4I-
-'
-
-II
b,_cc
- _ + I -1
-4 4-1 E - - --- -- F --_ 3 -U - -- E 2j I4 . IF- II!T
1 ±12L UL 1 i--4 u + ' H+ 14 r -H -7 -- --- - -- -- - - - -- -- - - -q7L- - - --- T - b u 7 -- E -t - - -.- ---1
-1
F-L T {
--
uT
T
--L-- - -r - - -u f 3n a - - - - --7 -T T : -r- -i - -r1 - - -7 -1 - - -u -- -L,- -- i u I T --- ---b --El- t - q-ji L i~-- -HpId-- u LI- H-- ~ ~ ~ q--7 ~ - TTC tH . . 1 + -- - --- f - -- -- --T - -- ---- I l-Jf H --,, - -T F i -I -F - - F - -p 4Tp 1 -p - -- H -1-4---- 4 - - -- --- -- r- rr-, f Al/o1 OCK
4it1-H-ftt1 tttftH+M I IF i i I i I i i I i-t - _I -
I
Tr-+ 1+-f-- -++ ] L I 1 T T - ] !-4 IT, ] LIT JL F TT T - 11 1 c - [ D 7 L J{F F F F F F 14T VF-p 'L - -4 * -- -- --IT - - - -n-] Lh1
i<7t
.-... ]+D 1 ELL] ] L H 4HF -F F ++ - t7 -h -7 LL H_! LIL -1 $ L-- -1!4 i- LL T - - T- - _1 L.L3 I + L -L$ H -72-t t i+ L F T L I 1 TFF J_71F
7L
I I[I-L--+ !! ]-ufit -iF .. ._ . . -- rI ,~~ II ~~ ~~~~ , I , 1 1 -- T -7 -L -14 - - - - I - - - --- T rE ]~~ 4 ] ~ ~ T--It I ---LtF - - - - ] 1 T- - --1 j T+ -I- -- t --_ --- --- -- -r - - - - -- F-!- - -- tr iz_ I _ -i +K
K
-
~i.
..
-
c777 I I I I I I I I I I -r I _r -I-.Temperature - Aluminum curve: Figure 8. The plotting of the values T-Al gives three different regions (a) 33% of these points define a saturation curve for the aluminum dissolved in quartz. These are also the best equilibrated points in the ratio Al-H vs. temperature. The slope of the curve is less than the slope given by Perry (M.I.T. Ph.D.
Thesis, 1963) for a highly aluminous environment (a metamorphic quartz
kyanite assemblage) in which the chemical potential of aluminum is
controlled by the presence of one or more of the Al2 SiO5 polymorphics.
The samples under analysis here formed in a low aluminous
environment, (sandstones) and the chemical potential of aluminum is
probably controlled by the presence of scattered detrital feldspars. This probably explains why the 62% of the points lie in the unsaturated region.
Ten percent of the points are in an anomalous position that can
be explained in one of the following ways: (a) These points represent errors in the analysis. This is not certain because some of these samples
show similar anomalies in the content of other elements. (b) They can represent contamination of the samples by micro-inclusions, (c) Bambauer's
data implies that "laellar" quartz may have a much higher amount of aluminum dissolved than does non-lamellar material. This is the more
satisfactory answer.
-The other element's curves can be explained in a general way by comparison with the T-Al curve provided. These curves have almost the same shape, and slope as the aluminum, and the anomalous points are
correlative.
There is an evident lack of elements in the hydrothermal
solutions at or above their saturation levels in the crystalling quartz. It is possible, however, that two or more foreign elements might be competing for the same structural site and that their ratio might be
temperature sensitive.
Several trails were made in an attempt to discover a partition curve, Figure 13 and Figure 14. Some of these curves are similar to the T - X curves while in other cases no curve was obtained. This suggests that many of the samples are not equilibrated, or that the quartz was not
saturated with respect to these elements and their concentrations in the quartz are simply a function of their concentrations in the hydrothermal solution.
An interesting test, Figure 15, was made by plotting the median values, for temperature of formation, vs. aluminum content of the following samples: Quartz from welded tuff and liyolite
(5),
granite (13),pegpa-tites (22), hydrothermal veins (10), geodes (4), data from Perry's Thesis
(1963), two synthetic samples made by C.N. Fenner and the present work.
-Aa ,7
A/I
7
I f 117 0 / -1- -iTr1 - ---7- 1 1 -- --- H-, -+ + - --9 + -H i -r--*j L - -1 *1 I - --7- - -.7-'
1t
!
T_ TL44
-pi -1-r
1 T__ _ _ I Ii -T 17 'A I t_
T _-T
-NOT
1Li
1*Llhi-idI
T
z1 zzzzn__
,W /I0 0 1
These values appear to define two limiting curves depending on which interpretation is given to Perry's data, including his
theoretical calculation to find the maximum temperature for his
materials. Curve No. 2 seems to be the likely one since it embraces more 3tatistical data.
GEOGRAPHICAL PATTERN AAP No. 1
The concentration of Al and Mg was plotted over the geo-thermal-gradient map of Bence and shows a concise matching with the anomalies reported by him.
CONCLUSIONS
On the basis of the results obtained from the analysis of the veins quartz samples from Ouachita Mountains, one can derive the following conclusions:
1st. The quartz veins from the Ouachita Mountain have a low
contamination with the only detectable elements being aluminum, magnesium, iron, sodium and lithium. The last one is the only one which is strongly controlled by crystal-chemistry whereas the other are major constituents
of the earth's crust.
2nd. The solution of the elements in quartz is not always at a saturation point because the concentration of these elements in the
hydrothermal solutions was not high enough.
-3rd. The work shows a good possibility for the use of the
quartz as a geological thermometer in those instances when the trace elements are at saturation and equilibrium, or through construction of
a general T - X curve, by means of statistical data, Figure
15.
th. Genetically, the hydrothermal quartz studied is equi-valent in time or space, but its foreign element content varies
markedly. This can be explained as, (a) Hydrothermal solution from
the same source traversing and reacting through different rock, or
different hydrothermal solutions evolved at slightly different times.
(b) Different sources with different hydrothermal solutions in the
same period of time. (c) A thermal metamorphism which involved meteoric and connate water in different source areas during the metamorphic process.
The last one i s more applicable in this case and at the same
time gives an explanation for the regional application of teiap-concen-tration curve (Figure
15)
since as metam~orphisn increases, temoerature increases dissolved solid increases and the amount of an element inquartz should increase. Eventually, the element dissolved will reach a
saturation and equilibration point.
5th.
Where there are concentrations of high temperatures(anomalous) these are coincident with high element concentrations, Hap 1.
-EXPLANATION
Tertiary rocks of the Gulf
Tl Coastal Plain
Cret aceous igneous rocks
Carboniferous rocks
Devonian, Silurian, and
Ordovician rocks Cambrian rocks 5 Isotherms in OC. County Line Temperature data Stations SCALE MILES 0 10 15 I 20 A. E. BENCE, 1964 A -F.. 0 f.SADA, iiqG5
GEOTHERMAL GRADIENT IN
OUACHITA
MOUNTAINS, ARKANSAS
GEOG
RAMI"C
DISTRkBUTlON
OF AWMINUN AND
MAGNESIUM
Approximate mean declination 1962 3 :
5:=
o - 7 z0 p-31 4,0-71 KCL
I7 I-:4::
pp oho
-
0-4'
/-0 - 1.99 4.00LBibliography
Ahrens, L. H. and S. R. Taylor 1960 Spectrochemical Analysis. A treatise
on the d - c are analysis of geological and related material,
Addison-Wesley Publishing Co., Inc., Reading, Mass.
Bambauer, H. U. (1961) Spurenelementgehalte und Y-Farbzentren in Quarzen
aus Zerrklikften der Schweizer Alpen, Schweiz, Min. und Det. 41 335-.69.
Bence, A. E. (1964) Geothermometric Study of Quartz Deposits in the
Ouachita "lountains, Arkansas. M. A. thesis, University of Texas.
Cohen, A. J. (1956a) Color Center in the x-Quartz called Amethyst Am.
Mineralogist
41
874-91.Cohen,-A. J. (1960) Substitutional and Interstitial Aluminum Impurity in Quartz. Structure and Color Center Interrelationships, Int. Jour. Phys.
and Chemistry of Solids 2 371-75.
Denbigh, K (1963) The ?rinciples of Chemical Equilibrium, Cambridge at
the University Press.
Dennen, W. H. (1964) Impurities in Quartz, Geological Society of 4ierica Bull. V.75, 241-46.
Dennen W. H. (1965) Stoichiometric Substitution in Natural Duartz, submitted to Geochemical and Cosmochemical Society, July, 1965.
Dennen, W. H. (1965) Cabot Laboratory Procedures.
-Frondel, C. (1962) Dana's System of Mineralogy V.3, New York, John
Wiley and Sons, 334p.
Frondel and Hurlbut (1955) J. Chem. Phys. 23, 1215 p.
Perry, C. E. (1963) Aluminum Substitution in Quarts, A Study in Geo-thermometry, Ph.D., Thesis, M.I.T.
Ritter, C. J., Dennen, W. H. (1964) Color Center Zonation in Quartz,
Geological Society of America Bull, V.75, 915-16.
Stavrou, 0. D._(1961) On the Content of Rate Elements in Quartz,
Geochemistry No.6, p.52-549.