HAL Id: hal-00304957
https://hal.archives-ouvertes.fr/hal-00304957
Submitted on 1 Jan 2004HAL is a multi-disciplinary open access archive for the deposit and dissemination of sci-entific research documents, whether they are pub-lished or not. The documents may come from teaching and research institutions in France or abroad, or from public or private research centers.
L’archive ouverte pluridisciplinaire HAL, est destinée au dépôt et à la diffusion de documents scientifiques de niveau recherche, publiés ou non, émanant des établissements d’enseignement et de recherche français ou étrangers, des laboratoires publics ou privés.
catchment in southern Finland
K. Granlund, K. Rankinen, A. Lepistö
To cite this version:
K. Granlund, K. Rankinen, A. Lepistö. Testing the INCA model in a small agricultural catchment in southern Finland. Hydrology and Earth System Sciences Discussions, European Geosciences Union, 2004, 8 (4), pp.717-728. �hal-00304957�
Testing the INCA model in a small agricultural catchment in
southern Finland
K. Granlund, K. Rankinen and A. Lepistö
Finnish Environment Institute, P.O. Box 140, FIN-00251 Helsinki, Finland Email for corresponding author: [email protected]
Abstract
Nutrient leaching from agricultural production is still recognised as a major environmental problem in Finland. To estimate agricultural nitrogen loading under changing land-use and climate conditions, the Integrated Nitrogen Model for Catchments (INCA) was applied in Savijoki, a small (15.4 km2) agricultural catchment, which represents the intensively cultivated areas in south-western Finland. Hydrological
calibration and testing of the INCA model was first carried out in Savijoki during 19812000. In spite of heterogeneous soil and land-use conditions, INCA was able to reproduce the overall hydrological regime in the stream. The model was calibrated further in respect of nitrogen processes during 19952000. The model was able, reasonably well, to simulate the overall annual dynamics of the inorganic N concentrations in the stream water and the annual N export from the catchment. The average simulated NO3-N export was 550 kg N km2 yr1 and the
observed one (constituting more than half of the annual total N export) was 592 kg N km2 yr1. For NH
4-N, the simulated export was
somewhat higher than that measured but NH4-N was only 4% of the total N export. In spite of some underestimation of flow and N concentration
during extreme hydrological conditions, the INCA model proved to be a useful tool for analysing flow pattern and inorganic nitrogen leaching in a small agricultural catchment, characterised by a rapid response to rainfall.
Keywords: nitrogen, integrated modelling, hydrology, catchment, agriculture
Introduction
Agricultural production is the major source of diffuse nutrient load to watercourses in Finland. Total nutrient load from catchments depends strongly on the proportion of agricultural land (Rekolainen, 1989a). To date, studies in Finnish agricultural catchments and river basins have indicated no reduction of nutrient loads, even though massive efforts have been made towards environmentally sound management practices, especially by introducing the Finnish Agri-Environmental Programme in 1995 (FAEP, Valpasvuo-Jaatinen et al., 1997). Increasing trends in nitrogen N concentrations have been detected in southern and western Finland, especially in some rivers flowing through intensively cultivated agricultural areas (Räike et
al., 2003; Granlund and Räike, 2004). According to
Kauppila and Bäck (2001), the extent of eutrophied areas increased in the Gulf of Finland, the Archipelago Sea and the Bothnian Bay in the late 1980s, and the situation has
not essentially changed during the 1990s. Today, water protection policy aims at a significant reduction of nutrient loads, due to increased concern about water quality in inland waters and the Baltic Sea (Ministry of the Environment, 1998).
In Nordic and Baltic conditions, leaching of N and annual riverine N load is strongly dependent on hydrological conditions, such as variation of annual and seasonal runoff (Hogland, 1994; Arheimer et al., 1996; Eltun and Fugleberg, 1996; Vagstad et al., 1997; Mander et al., 1998; Ulen, 1998; Vuorenmaa et al., 2002). Transformation of organic matter and N mineralisation in catchment soils varies considerably in response to temperature and moisture (e.g. Vagstad et
al., 1997; Andersson and Lepistö, 1998). In Finland, the
Integrated Nitrogen Model for Catchments (INCA) (Whitehead et al., 1998; Wade et al., 2002; Wade, 2004) has been applied successfully in a large forested river basin in the north: the Simojoki river system (Rankinen et al.,
2002a; Rankinen et al., 2002b; Lepistö et al., 2004; Rankinen et al., 2004b). The emphasis was on evaluating N losses related to forestry and changing atmospheric N deposition. To develop methods for estimating agricultural N loading on catchment scale under changing hydrometeorological and land-use conditions, the INCA model is being tested in Savijoki, a small (15.4 km2) agricultural catchment, which represents the intensively cultivated areas in south-western Finland. In Savijoki, agriculture is the main source of diffuse nutrient loading (Rekolainen, 1989a), even though about 60 percent of the catchment is covered by coniferous forests. The effect of different land uses on the catchment water balance and river discharge can be modelled only by integrating key processes related to water flow in catchment soils. A sound calibration of hydrological response is extremely important for analysing N dynamics in agricultural catchments.
In this study, the hydrological part of the INCA model was first calibrated and tested in the Savijoki catchment with long-term monitoring data on water flow. Hydrological input data were taken from the Finnish Watershed Simulation and Forecast System (WSFS) of the Finnish Environment Institute (Vehviläinen, 1994), which is in operational use in Finland. The main emphasis was to test the applicability of lumped, spatially uniform input data, which were originally derived from WSFS results for a larger sub-catchment than the study catchment, Savijoki. Also, the capability of the INCA model to describe the hydrological response under heterogeneous landcover and hydrogeological conditions is discussed. Twenty years hydrological input data (1981 2000) were divided into two for independent calibration and testing of the model. As a first step in analysing N dynamics in the catchment, a preliminary calibration of N processes was also carried out.
Material and methods
DESCRIPTION OF THE STUDY AREA AND THE MONITORING PROGRAMME
The Savijoki catchment is located in south-western Finland in the southern boreal zone, about 30 km north-east of the city of Turku (60°36', 22°40'); it is a small, agriculture-dominated sub-catchment (15.4 km2) of the River Aurajoki that discharges to the Baltic Sea (Fig. 1). Savijoki contains no lakes and belongs to the Finnish network of small representative catchments, originally established for hydrological research in 1957 (Mustonen, 1965; Seuna, 1983). The network has been used to study the complex interactions related to nutrient leaching, especially the impact of agriculture and forestry on water flow and quality
(e.g. Rekolainen, 1989a; Rekolainen, 1989b; Lepistö, 1996; Vuorenmaa et al., 2002; Granlund, 2003). The main characteristics of the Savijoki catchment are described in Table 1.
The annual mean values for temperature and precipitation in 19712000 were 5.2 °C and 698 mm, respectively
Table 1. Main characteristics of the Savijoki catchment
Area (km2) 15.4
Agricultural land (% of total area) 39
Forest (% of total area) 57
Scattered settlement (% of total area) 4
Soil types (% of total area):
fine sand 1
silt 1
clay 34
peat 7
moraine soils 57
Mean annual precipitation (mm) 698
Mean annual temperature (°C) 5.2
Mean annual runoff (mm) 369
(Table 1; Drebs et al., 2002).
The mean annual runoff for the period 19812000 was 369 mm. The highest precipitation occurs during the late summer and autumn. During the winter months (DecemberMarch) precipitation usually falls as snow. In southern Finland more than half of the total annual discharge originates during the snow and frost melting period in spring (Seuna, 1982). In this part of the country, the length of the growth period is about 170 days. The annual dates for the start and end of the growth period, with average temperature over 5°C, were provided by the Finnish Meteorological Institute.
Agriculture is the main source of diffuse nutrient losses in the Savijoki catchment (Rekolainen, 1989a). No database with a continuous survey of forest management is available, but the water quality impacts of forestry are assumed to be low in this area. The specific N load from forestry is typically only 1020% of that of agriculture in southern Finland (Kortelainen et al., 1997; Vuorenmaa et al., 2002). Detailed information on agricultural practices was collected by farmer interviews in 1987, 2001 and 2002, covering the years 1987 and 19992002. Livestock density and the area of grassland is relatively low and spring cereals are the most common crops, which is typical of this part of the country. The mean total N (Tot-N) export from the catchment was 820 kg N km2 yr1 during 19812000 (Granlund, 2003). Annual N export was strongly dependent on weather-driven variation in runoff. So far, no reduction of loads has been achieved, even though most of the farmers are participating in the FAEP (Vuorenmaa et al., 2002; Granlund, 2003; Granlund and Räike, 2004).
In Finland, the landscape has been influenced strongly by the glacial period. More than half of the Savijoki catchment is covered by coniferous forests growing on shallow glacial moraine layers (usually less than one metre deep) (Table 1). During the melting of the continental ice cap most of the area was covered either by freshwater or saltwater and, thus, the cultivated stream valleys of Savijoki consist of thick clay layers of different ages. Sub-drainage is needed on fields to provide good conditions for management practices, especially after snowmelt in spring. Due to geological conditions, the groundwater resources are very restricted in the area, usually sufficient for single households only (Haavisto-Hyvärinen et al., 1983).
In Savijoki catchment, the discharge and water quality measurements started in 1971. Due to changes in sampling strategy, only data since 1981 were used in this study. Detailed long-term climatic data were available from Turku airport, less than 30 km south-west of the Savijoki catchment. Precipitation, snow water equivalent and soil frost are also measured in the catchment. The discharge at the catchment outlet has been measured continuously by a
V-notch overflow weir and a water stage recorder described in detail by Mustonen (1965); here daily discharge values were used.
The streamwater quality monitoring strategy is based on a combination of manual and automatic flow-weighted sampling. Most of the samples are usually taken in spring and autumn high flow periods (Vuorenmaa et al., 2002) with, on average, 20 samples per year. The NO3-N was analysed by reduction of nitrate to nitrite followed by colorimetric determination. The NH4-N was analysed colorimetrically with hypochlorite and phenol. The Tot-N was analysed as NO3-N after oxidation of the sample with K2S2O8. No measurements of soil or groundwater quality were available from the catchment.
INCA model and input data
description
MODEL DESCRIPTION
The Integrated Nitrogen Model for Catchments (INCA) (Whitehead et al., 1998; Wade et al., 2002) is a process-based and semi-distributed model that integrates hydrology, catchment and river N processes to simulate daily concentrations of NO3-N and NH4-N in the river system. In this study, the model version 1.9 was used, with a simple degree-day model to calculate snow pack depth and an empirical function to calculate soil temperature from ambient air temperature (Rankinen et al., 2004a).
In the INCA model, hydrologically effective rainfall (HER) is the input to the soil water storage, driving water flow and N fluxes through the catchment system (Whitehead
et al., 1998). Catchment hydrology is modelled with a simple
two-box approach, including reservoirs of water in the reactive soil zone and deeper groundwater zone. Flows from the soil and groundwater zones are controlled by time constants T1 and T2, respectively, representing residence time in the reservoirs. Base flow index (BFI) is used to calculate the proportion of water being transferred to the groundwater zone. Calculation of river flow is based on mass balance of flow and a multi-reach description of the river system. Flow variation within each reach is determined by a non-linear reservoir model. Mean flow velocity is related to discharge and controlled by two constants, a and b (Whitehead et al., 1998).
MODEL INPUT DATA
Long-term, daily input data on HER for the period 1981 2000 were used to calibrate and test INCA at the Savijoki catchment. The input data were divided into two 10-year
periods for independent hydrological calibration and testing. Years 19811990 were used for testing and 19912000 for calibration because more background information on agricultural practices was available.
The daily HER was derived from the operative Watershed Simulation and Forecast System WSFS (Vehviläinen, 1994), that has been calibrated originally to the Aurajoki river basin (874 km2) and its nine sub-basins (30147 km2). The Savijoki catchment (15.4 km2) is in one of these sub-catchments and represents typical headwater conditions in the area. The WSFS utilises information on precipitation, snow water equivalent and temperature to simulate soil moisture, changes in subsurface and groundwater storage and runoff on homogeneous sub-basins. Because the WSFS was originally calibrated on sub-basins larger than the Savijoki catchment, only lumped (and spatially uniform) HER input could be used to calibrate the hydrological part of INCA at the Savijoki catchment. No sub-catchment delineation was introduced in this model application because discharge and water quality are measured at the catchment outlet only.
Information on agricultural land-use was based on farmer interviews carried out in 1987, 2001 and 2002. The extent of the forested area was estimated from earlier studies (Pajala, 1989; Rekolainen, 1989a; Vuorenmaa et al., 2002) and the recent satellite image-based land-use and forest classification data (Vuorela, 1997). Six land-use classes were defined for the Savijoki catchment, five of them representing the main crop types cultivated in the agricultural fields (barley and oats (17%), wheat (12%), oilseed (2%), grass (5%), green fallow (set-aside) and others (3%)) and one representing the managed forested area and the scattered settlement (61%). In INCA, the same hydrological input data are used for all land-use classes. The time constants (i.e. residence times in soil and groundwater zones) could be given individually for each of the land-use classes. In the present model application, it was assumed that the agricultural land types are homogeneous with respect to time constants, but separation between agricultural and forest land was taken into account.
For N calibration, information on crop N uptake rates and growth periods was taken from the literature. All crops were simulated using the growth rate in the INCA model as defined in Wade et al. (2002). For the agricultural area, the crop-specific N fertilisation rates set by the FAEP were used as input. Due to lack of long-term data on actual management practices and dates, fertilisation was assumed to take place simultaneously with sowing on one day in May. Observed data on atmospheric N deposition were available from a station located approximately 50 km north-east of the Savijoki catchment. During 19952000, the Tot-N
deposition ranged from 510 to 730 kg N km2 yr1. In Finland, N deposition is highest in the southern part of the country, where the load of transboundary air pollution and the deposition of the Finnish emissions is highest (Syri, 2001; Vuorenmaa et al., 2002).
HYDROLOGICAL AND N PROCESS PARAMETRISATION
The base flow index was calculated from the hydrograph using the smoothed minima method (Gustard et al., 1989). The same method was used by Rankinen et al. (2002a) when calibrating the INCA model to the Simojoki river basin.
To simulate daily discharge in the catchment, the INCA model was calibrated for the period 19912000 against measured daily hydrograph data by adjusting the time constants for soil and ground water flow, and the flow velocity parameters, until the simulated discharge matched that observed reasonably closely. The initial values and calibrated parameter values for hydrological calibration are presented in Table 2. In addition to plotting the modelled versus observed daily discharge values, model performance was assessed by calculating the Nash and Sutcliffe (1970) coefficient for model efficiency (R2).
After hydrological calibration and testing, the INCA model was calibrated for N processes. The latter part of the 1990s (19952000) was chosen for N calibration period, due to the fact that information about agricultural practices
Table 2. Initial values and parameters used in the hydrological calibration of the INCA model at the Savijoki catchment
Unit Value
Initial values
Soil water flow* m3 s-1 0.04
Groundwater flow* m3 s-1 0.01 River flow m3 s-1 0.3 Parameters Time constants Groundwater zone forest days 4
arable land days 2
Soil reactive zone
forest days 2
arable land days 1
Flow a - 0.04
Flow b - 0.32
Base flow index - 0.2
was not available before that, except for the year 1987. Most of the farmers in Savijoki catchment are participating in the FAEP, and it was assumed that they have adapted the environmentally sound management practices (e.g. targeted fertilisation rates) suggested by the FAEP since 1995. Detailed field-parcel based data on management practices have been available only since 1999. Thus, the management practices were assumed to be similar to those during 1999 2000 for each simulated year.
The N process parameters (Table 3) were adjusted until the annual process loads were in the range reported in the literature. Net mineralisation was calibrated after setting the N immobilisation rate to zero because information on estimated N immobilisation rates is unavailable.
Results
ANNUAL HYDROLOGICAL PATTERN
The observed precipitation, HER, and the mean annual temperature showed considerable variation during the study period 19812000 (Fig. 2). The precipitation varied between 547 and 914 mm, HER between 238 and 562 mm and the mean annual temperature between 1.6 and 6.3 °C.
Climatological and hydrological conditions were somewhat different during the 1990s and the 1980s (Table 4). The calibration period (19912000) was warmer (mean annual temperature 4.7 °C and 4.1 °C, respectively) and drier than the testing period (19811990). The observed mean annual precipitation during 19811990 was 745 mm and during 19912000 637 mm. The observed mean annual values for runoff were 389 mm and 351, respectively. The observed annual precipitation showed more variability during the testing period (Fig. 2). As a result of these climatic
Table 3. Parameter values used in N process calibration. Barley land-use class includes also oats, SWheat includes spring and winter wheat, green fallow includes other crops not simulated and ForMin includes forest on mineral soil and scattered settlement
Process Land-use class Value Unit
Denitrification Barley 0.004 day-1
SWheat 0.004 day-1
Grass 0.004 day-1
Fallow 0.004 day-1
Oilseed 0.004 day-1
ForMin 0.008 day-1
N fixation Barley 0.0 kg N ha-1day-1
SWheat 0.0 kg N ha-1day-1
Grass 0.0 kg N ha-1day-1
Fallow 0.0 kg N ha-1day-1
Oilseed 0.0 kg N ha-1day-1
ForMin 0.001 kg N ha-1day-1
Nitrification Barley 0.8 day-1
SWheat 0.8 day-1
Grass 0.8 day-1
Fallow 0.8 day-1
Oilseed 0.8 day-1
ForMin 0.03 day-1
Mineralisation Barley 0.7 kg N ha-1day-1
SWheat 0.7 kg N ha-1day-1
Grass 1.2 kg N ha-1day-1
Fallow 0.7 kg N ha-1day-1
Oilseed 0.7 kg N ha-1day-1
ForMin 0.4 kg N ha-1day-1
Table 4. Annual mean, minimum and maximum values of hydrological input and observed runoff values in the Savijoki catchment during the calibration and testing periods
Calibration period Testing period (years 19912000) (years 19811990) Precipitation (mm) Mean 637 745 Min 547 625 Max 742 914 HER (mm) Mean 327 379 Min 253 238 Max 410 562 Mean temperature (°C) Mean 4.7 4.1 Min 3.4 1.6 Max 5.6 6.3 Runoff (mm) Mean 351 389 Min 259230 Max 444 618
Fig. 2. Hydrometeorological input data for the INCA model in the
differences, the monthly runoff patterns differed during the periods. (Fig. 3). During the calibration period, the spring high flow peak started earlier and was lower than during the testing period. Late summer and autumn runoff (from August to November) was higher during the testing period (Fig. 3).
ANNUAL NITROGEN EXPORT
The observed annual exports of Tot-N, NO3-N and NH4-N varied considerably during 19812000. The mean Tot-N export was 820 kg N km2 yr1. More than half of the annual Tot-N export was in the form of NO3-N, while the relative contribution of NH4-N was low (on the average 13% of the annual Tot-N load). This is common in Finnish agricultural mineral soils (Jaakkola, 1984; Lemola et al., 2000). However, the surface application of slurry can occasionally cause leaching of NH4-N in surface runoff (Turtola and Kemppainen, 1998). In Savijoki, the NH4-N export remained lower than 50 kg N km2 yr1 during 19952000. This may be due to changes in agricultural practices required by the FAEP (for example, restrictions related to manure application). The NO3-N export was strongly correlated to annual runoff, reflecting the high mobility of this anion. Further, the highest annual Tot-N export was measured in 1984, along with the highest annual runoff (Granlund, 2003).
COMPARING OBSERVED AND SIMULATED HYDROLOGY
The observed hydrological response of the Savijoki catchment is rapid, due to low groundwater storage in the forested areas and intensive artificial drainage on agricultural fields. As a result, the base flow index was low (0.2) and the calibrated values for time constants were low for both soil water and groundwater flows. During low flow periods in summer time (JuneAugust), the river discharge is often
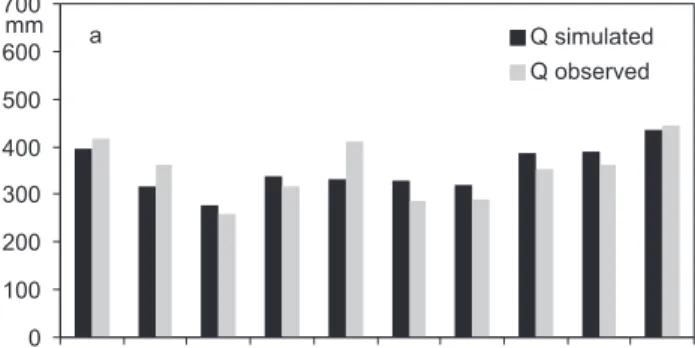
very low, approximately zero. The R2 was 0.70 when relating simulated to the observed daily discharge for the calibration period of 19902000. Figure 4(a) shows the good agreement between simulated and observed annual runoff values.
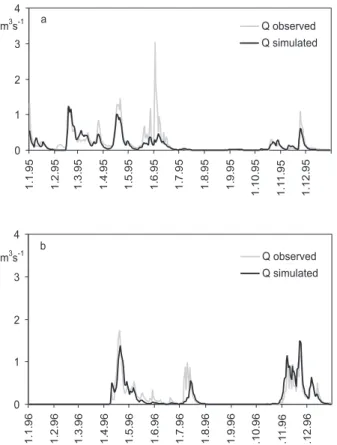
The timing of the flow peaks was simulated well for the whole calibration period. The magnitude of the peaks was also reasonable in spring and autumn high flow periods, although slight underestimation of spring peaks was more common than overestimation. The model seemed to underestimate flow peaks during very intensive summer storms. This was the case in 1995 (Fig. 5a). The underestimation was probably due to inability of INCA to represent the activation of all hydrological source areas and the complex interaction between the source areas and the flow-paths. Moreover, the spatial variability of precipitation is typically high during summer storms in Finland. WSFS utilises measurements from several meteorological stations to calculate HER. In Savijoki, this resulted in an underestimation of precipitation amounts (and thus HER) during summer storms. In 1995, the precipitation value provided by WSFS was 108 mm for the period 15 May to 30 June, while the value measured at the local station was 183 mm. The model behaved adequately during normal years, dominated by spring and autumn high flows. An
Fig. 3. Monthly mean runoff during the calibration period (years
19912000) and the testing period (years 19811990) in the Savijoki catchment
Fig.4. Observed and simulated annual runoff in the Savijoki
catchment for (a) the calibration period 19912000 and (b) the testing period 19811990
example of model fit under such conditions is given in Fig 5(b) for the year 1996.
After calibration, the model was tested with hydrometeorological input data from the period 19811990. The R2 was 0.65 for simulated versus observed daily discharge during the testing period. It was slightly lower than that of the calibration period, probably reflecting more extreme climatic conditions during the testing period. Both the maximum and minimum annual runoff for the whole study period occurred during the testing period (years 1984 and 1985, respectively). Figure 4(b) shows the simulated and observed annual runoff values. As can be seen, the correspondence between observed and simulated annual values was mostly good. The model clearly underestimated runoff in years 1984, 1987 and 1988. The highest runoff for the whole study period (618 mm) occurred in 1984, corresponding to the highest precipitation (874 mm, local station) and snow water equivalent (119 mm). It is possible that the HER input was not fully representative during these extreme hydrological conditions. In 1987 and 1988 the underestimation was, again, due to problems of modelling the spatial variability of rainfall during summer storms.
COMPARING OBSERVED AND SIMULATED N DYNAMICS
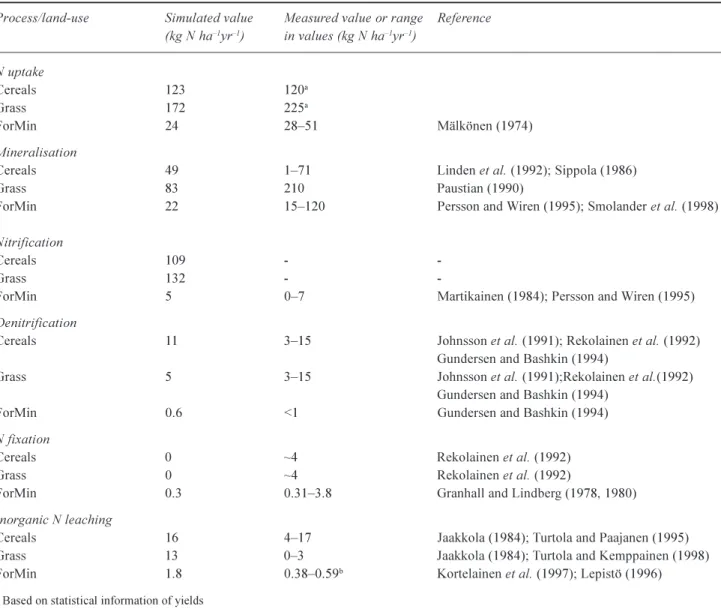
The model simulated, adequately, the overall annual dynamics of inorganic N concentration in the stream during 19952000 (Fig. 6). However, the comparison between simulated versus observed inorganic N concentrations was to some extent impeded by the selective sampling strategy: concentration data were rather scarce during low flow periods and even in mild and wet winters in the late 1990s. The simulated values of N process fluxes for cereals, grass and forest (constituting 95% of the catchment area), presented in Table 5, were comparable to those published in the literature for Finnish and Nordic conditions. Simulated inorganic N leaching from grass was somewhat higher than reported literature values (13 compared to the observed values of 03 kg N ha1 yr1). This was probably due to the simple fertilisation strategy in the present calibration.
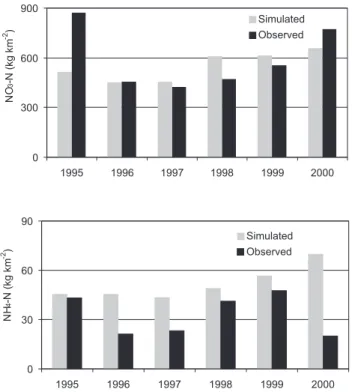
The simulation of annual export from the catchment was fairly good for NO3-N (Fig. 7). The average simulated NO3-N flux for six years was 550 kg N km2 yr1 and the measured one was 592 kg N km2 yr1. For NH
4-N, the simulated flux was higher than the measured one,
Fig. 5. Observed and simulated discharge at the Savijoki catchment
outlet in (a) 1995, a year dominated by intensive summer rainfall event and (b) in 1996, a year dominated by spring and autumn high flows 0 1 2 3 4 1995 1996 1997 1998 1999 2000 Q( m 3s -1) Observed Simulated 0 3 6 9 1995 1996 1997 1998 1999 2000 NO 3 -N (m g l -1) Observed Simulated 0 0.4 0.8 1.2 1995 1996 1997 1998 1999 2000 NH 4 -N (m g l -1) Observed Simulated
Fig. 6. Observed and simulated discharge, NO3-N and NH4-N
Table 5. Catchment process fluxes for inorganic N: comparison of observed values within the published literature with simulated mean annual fluxes during 1995-2000 in the Savijoki catchment. For simulated values: Cereals includes barley, oats and wheat; ForMin includes forest on mineral soil and scattered settlement
Process/land-use Simulated value Measured value or range Reference
(kg N ha1yr1) in values (kg N ha1yr1) N uptake Cereals 123 120a Grass 172 225a ForMin 24 2851 Mälkönen (1974) Mineralisation
Cereals 49 171 Linden et al. (1992); Sippola (1986)
Grass 83 210 Paustian (1990)
ForMin 22 15120 Persson and Wiren (1995); Smolander et al. (1998)
Nitrification
Cereals 109-
-Grass 132 -
-ForMin 5 07 Martikainen (1984); Persson and Wiren (1995)
Denitrification
Cereals 11 315 Johnsson et al. (1991); Rekolainen et al. (1992)
Gundersen and Bashkin (1994)
Grass 5 315 Johnsson et al. (1991);Rekolainen et al.(1992)
Gundersen and Bashkin (1994)
ForMin 0.6 <1 Gundersen and Bashkin (1994)
N fixation
Cereals 0 ~4 Rekolainen et al. (1992)
Grass 0 ~4 Rekolainen et al. (1992)
ForMin 0.3 0.313.8 Granhall and Lindberg (1978, 1980)
Inorganic N leaching
Cereals 16 417 Jaakkola (1984); Turtola and Paajanen (1995)
Grass 13 03 Jaakkola (1984); Turtola and Kemppainen (1998)
ForMin 1.8 0.380.59b Kortelainen et al. (1997); Lepistö (1996)
aBased on statistical information of yields bAverage of mineral soil catchments
particularly in 2000 (Fig. 7). However, the total amount of NH4-N export is only about 4% of the total N export.
The hydrological conditions were highly variable during the N calibration period. Due to mild winters, winter runoff was considerable at the end of the 1990s. The highest NO3-N concentrations during the N calibration period were measured during OctoberNovember in 1999 and 2000 (Fig 6). These peak concentrations were typically underestimated in the NO3-N simulation. A good hydrological simulation in 1996 resulted in good results also for N dynamics (Fig. 6).
Discussion
The INCA model was calibrated and tested on the Savijoki catchment using two independent hydrological input datasets (period 19912000 and 19812000, respectively). The dominant hydrological pathways in the Savijoki catchment are shallow in moraine soils of the forested area and follow sub-drainage pipes in the agricultural area. Thus, groundwater storage is rather small (Haavisto-Hyvärinen
et al., 1983). There are no lakes in the catchment, and the
upper stream channels of the river Savijoki are rather short (less than 6 km). Consequently, the flow at the catchment outlet rises quickly after an intensive precipitation event (Pajala, 1989). The complex hydrogeochemical interactions
(such as timing and distribution of melting) during the snow melt period have a pronounced effect on discharge and nutrient concentrations in the catchment (Pajala, 1989; Rekolainen, 1989b).
The agricultural fields lie along the river channels. Due to effective sub-surface drainage, the contribution of the agricultural area to runoff and N export is expected to be pronounced in these conditions. According to Turtola and Paajanen (1995), improved sub-drainage increased N leaching in a heavy clay soil. In a study by Seuna and Kauppi (1981), changing from open ditches to sub-surface drainage increased annual N loads. INCA was able to take into account the prevailing hydrogeological conditions in the Savijoki catchment and reproduced, adequately, the annual hydrological regime in the stream during calibration and testing periods of ten years each. The simple two-box approach described the dynamics of the soil and groundwater storages sufficiently and resulted in a realistic simulation of discharge at the catchment outlet.
According to Drebs et al. (2002), the winters since 1989 1990 have been milder than usual. In Savijoki, the hydrological calibration period was warmer and also drier than the testing period. Hence, the difference in climatic conditions provided a good test for the hydrological part of the INCA model. The timing of the spring and autumn flow peaks was simulated well. A correct simulation of these
peaks is crucial, because most of the nutrients are transported during spring and autumn high flows.
The model slightly underestimated flow during extreme hydrological conditions, especially during local summer storms, probably due to an underestimation of HER under such conditions. N leaching is normally low during the growth period, due to vegetative uptake. However, if an intensive precipitation event occurs during late springearly summer, there is a risk of substantial leaching of fertiliser N. Thus, a more detailed spatial resolution for HER is needed, if the response of flow and N leaching to local storms is to be modelled properly at this scale.
After the hydrological calibration, the INCA model was calibrated in respect of N processes. Only the latter part of the 1990s was chosen for N calibration due to restricted availability of data on management practices. Simulated agricultural N leaching represents typical agricultural practices related to FAEP. Potential application of fertilisers in autumn were not taken into account here. However, autumn application is most probably low in the area, due to the low proportion of winter cereals. Inorganic N concentrations were reasonably well simulated by INCA, except under extreme hydrological conditions. The mild winters at the end of the 1990s may have provided favourable conditions for enhanced N mineralisation in soil, resulting in peak concentrations in stream water. Moreover, INCA is not able to fully take into account annual variations in yields, which were low in 1998 and 1999. Unused inorganic fertiliser N, which is susceptible to leaching may have remained in soil after harvest. The average annual inorganic N export was simulated adequately. Discrepancies in the simulated versus observed exports could be explained by deviations in the observed versus simulated water flow. This result highlights the importance of simulating the hydrology correctly in order to characterise the transport and retention of nitrogen within the system, and the capacity for dilution.
INCA was able to integrate the available data on land-use, hydrology and management practices to provide adequate representation of the hydrological regime and N dynamics. The calibrated model was used to analyse N dynamics for key land-use types. However, if effects of extreme hydrological conditions or major land-use changes (e.g. such as reforestation or forest cut) are to be modelled, a distributed representation for HER is needed. For a more detailed calibration of N uptake, the simple fertilisation strategy (application during one day) for agricultural crops used in this study must be improved by introducing a realistic fertiliser dissolution time-series. Detailed interview information about recent agricultural management practices on field parcels will be used to develop a better
Fig. 7. Observed and simulated annual NO3-N and NH4-N exports
representation about present agricultural actitivities in the next phase of the study. The model equations for crop growth should be developed to allow crop-specific simulation of both growth and N uptake.
The slow response of diffuse loading in Nordic-Baltic river basins to changed land-use and agricultural practices has been clearly demonstrated, for example by Löfgren et al. (1999), Vagstad et al. (2001) and Räike et al. (2003). A study by Vagstad et al. (1997) on Norwegian agricultural catchments indicated that a major part of the leached N originated from the mineralisation of organic matter rather than that from applied fertilizers. Processes related to N mineralisation may take decades (Grimwall et al., 2000). Thus, a more detailed long-term model analysis concerning the effects of hydrometeorological variations on N mineralisation and N dynamics is needed, preferably with measured N process data. The application of INCA model to the Savijoki catchment data is planned to simulate the 2025 year time-series of N. The purpose of this future work is to study the impacts of climatic and agricultural changes on N leaching. Future scenarios for agriculture, such as those presented by Rankinen et al. (2004c), will concentrate on crop rotation and different management practices instead of expanding agricultural land: suitable land area for agricultural crop production is already under cultivation. The impact of fertilisation rates on N leaching will also be studied to assess the possibility of achieving the 50% reduction in agricultural nitrogen load required by the national water protection policy.
Conclusions
Hydrometeorological conditions are known to have a pronounced impact on nitrogen leaching on both agricultural and forested catchments. Therefore, the hydrological behaviour of a catchment must be described properly before modelling nitrogen processes. Hydrological patterns could be calibrated and tested successfully by INCA in a small agricultural catchment with heterogeneous hydrogeological conditions. Lumped input data for the hydrologically effective rainfall was adequate for modelling the overall long-term variability of annual runoff. The timing of the flow peaks was good. In extreme hydrological conditions, such as during very wet years, the model somewhat underestimated the volume of the flow peaks. This discrepancy was most probably due to an underestimation of the hydrologically effective rainfall. Further, the INCA model could be adequately calibrated with respect to annual N export, but the single high peak concentrations were underestimated in the simulations, mostly due to inadequate hydrological calibration. The INCA model proved to be a
useful tool for analysing flow pattern and inorganic nitrogen leaching in a hydrologically quickly responding, small scale agricultural catchment.
Acknowledgements
This study was partly financed by the Commission of the European Union, the Euro-limpacs project (GOCE-CT-2003-505540). The authors would like to thank Dr. Bertel Vehviläinen and Mr. Jussi Vuorenmaa of the Finnish Environment Institute, for providing the WSFS model simulations and the N deposition data, respectively.
References
Andersson, L. and Lepistö, A., 1998. Links between runoff generation, climate and nitrate-N leaching from forested catchments. Water Air Soil Pollut., 105, 227237.
Arheimer, B., Andersson, L. and Lepistö, A., 1996. Variation of nitrogen concentration in forest streams - influences of flow, seasonality and catchment characteristics. J. Hydrol., 179, 281 304.
Drebs, A., Nordlund, A., Karlsson, P., Helminen, J. and Rissanen, P., 2002. Climatological Statistics of Finland 19712000. Climatic Statistics of Finland, No. 2002, 1.
Eltun, R. and Fugleberg, O., 1996. The Apelsvoll cropping system experiment VI. Runoff and nitrogen losses. Norwegian J .Agr. Sci., 10, 229248.
Granhall, U. and Lindberg, T., 1978. Nitrogen fixation in some coniferous forest ecosystems. In: Environmental Role of Nitrogen-fixing Blue-green Algae and Asymbiotic Bacteria, U. Granhall (Ed.), Vol 26, Ecological Bulletin (Stockholm), Sweden. 178192.
Granhall, U. and Lindberg, T., 1980. Nitrogen input through biological nitrogen fixation. In: Structure and Function of Northern Coniferous Forests - An Ecosystem Study, E. Persson (Ed.), Vol 32, Ecological Bulletin (Stockholm), Sweden. 333 340.
Granlund, K., 2003. Nitrogen leaching in a small agricultural catchment in southern Finland. Proc. Northern Research Basins 14th International Symposium and Workshop. Kangerlussuaq/ Sdr. Stromfjord, Greenland, August 2529 2003. Institute of Geography, University of Copenhagen, Denmark.
Granlund, K. and Räike, A., 2004. Runoff conditions and nitrogen leaching in agricultural catchments in southern Finland. Proc. XXIII Nordic Hydrological Conference, Tallinn, Estonia, 812 August 2004.
Grimwall, A., Stålnacke, P. and Tonderski, A., 2000. Time scales of nutrient losses from land to sea - A European perpective. Ecol. Eng., 14 , 363371.
Gundersen, P. and Bashkin, V.N. (Eds.), 1994. Nitrogen Cycling, Wiley, Chirchester, UK. 255283
Gustard, A., Roald, L.A., Demuth, S., Lumadjeng; H.S. and Gross, R., 1989. Flow Regimes from Experimental and Network Data. Volume I Hydrological Studies. Institute of Hydrology, Wallingford, UK.
Haavisto-Hyvärinen, M., Sten, C-G., Svanbäck, L. and Urvas, L., 1983. Explanation of the soil map. Soil map 1:20 000 (202202 Aura). National Board of Land Survey.
Hogland, W., 1994. Hydrological and environmental effects of agricultural and urban activities in a small Swedish river basin. Nord. Hydrol., 25, 247266.
Jaakkola, A., 1984. Leaching losses of nitrogen from clay soils under grass and cereal crops in Finland. Plant Soil, 76, 5966. Johnsson, H., Klemedtsson, L., Nilsson, Å. and Svensson, B.H., 1991. Simulation of field scale denitrification losses from soils under grass ley and barley. Plant Soil, 138, 287302. Kauppila, P. and Bäck, S., 2001. The state of the Finnish coastal
waters in the 1990s. The Finnish Environment 472. Finnish Environment Institute, Helsinki, Finland. 134pp.
Kortelainen, P., Saukkonen, S. and Mattsson, T., 1997. Leaching of nitrogen from forested catchments in Finland. Global Biogeochem. Cycles,11, 627638.
Lemola, R., Turtola, E, Eriksson, C., 2000. Undersowing italian ryegrass diminishes nitrogen leaching from spring barley. Agr. Food Sci., Finland, 9, 201215
Lepistö, A., 1996. Hydrological processes contributing to nitrogen leaching from forested catchments in Nordic conditions. Monographs of the Boreal Environment Research, 1. 171. Lepistö, A., Granlund, K. and Rankinen, K., 2004b. Integrated
nitrogen modelling in a boreal forestry dominated river basin: N fluxes and retention in lakes and peatlands. Water Air Soil Pollut.: Focus 4, 113123.
Lindén, B., Lygstad, I., Sippola, J., Soegaard, K. and Kjellerup, V., 1992. Nitrogen Mineralisation during the Growing Season. 1. Contribution to the nitrogen supply of spring barley. Swedish J. Agr. Res., 22, 312.
Löfgren, S., Gustafson, A., Steineck, S. and Stålnacke, P., 1999. Agricultural development and nutrient flows in the Baltic states and Sweden after 1988. Ambio, 28, 320327.
Mälkönen, E., 1974. Annual primary production and nutrient cycle in some Scots pine stands. Department of Soil Science, Finnish Forest Research Institute, Helsinki, 87pp.
Mander, U., Kull, A., Tamm, V., Kuusemets, V. and Karjus, R., 1998. Impact of climatic fluctuations and land use change on runoff and nutrient losses in rural landscapes. Landscape Urban Plan., 41, 229238.
Martikainen, P.J., 1984. .Nitrification in two coniferous forest soils after different fertilization treatments. Soil Biol. Biochem., 16, 577582.
Ministry of the Environment, 1998. Water protection targets to 2005, The Finnish Environment, 226. Ministry of the Environment, Helsinki, Finland. 82pp.
Mustonen, S., 1965. Hydrologic investigations by the Board of Agriculture during the years 1957 to 1964. (In Finnish with English abstract). Soil and Hydrotechnical Investigations 11. Helsinki, Finland. 144pp.xxxx
Nash, J.E and Sutcliffe, J.V., 1970. River flow forecasting through conceptional models. 1. A discussion of principles. J.Hydrol.,
10, 282290.
Pajala, H., 1989. Erosion of suspended solids on Savijoki catchment (in Finnish). Vesi-ja ymparistöhallituksen monistesarja 171. Vesi- ja ymparistöhallitus. Helsinki 1989. Paustian, K., Bergström, L., Jansson, P.-E. and Johnsson, H., 1990.
Ecosystem dynamics. Ecol. Bull., 40, 153180.
Persson, T. and Wirén, A., 1995. Nitrogen mineralization and potential nitrification at different depths in acid forest soils. Plant Soil, 168-169, 5565.
Rankinen, K., Lepistö, A. and Granlund, K., 2002a. Hydrological application of the INCA (Integrated Nitrogen in Catchments) model with varying spatial resolution and nitrogen dynamics in a northern river basin. Hydrol. Earth Syst. Sci., 6, 339350. Rankinen, K., Lepistö, A. and Granlund, K., 2002b. Sensitivity of
the INCA model to N process parameters and hydrological input. Integrated Assessment and Decision Support. Proc. 1st biennial meeting Int. Environ. Modelling and Software Soc. 2427. June 2002, University of Lugano, Switzerland. 1, 317321.
Rankinen, K., Kaste, O. and Butterfield, D., 2004a. Adaptation of the Intergrated Model for Catchments (INCA) to seasonally snow-covered catchments. Hydrol. Earth. Syst. Sci, 8, 695705. Rankinen, K., Lepistö, A and Granlund, K., 2004b. Integrated nitrogen and flow modelling (INCA) in a boreal river basin dominated by forestry: Scenarios of environmental change.
Water Air Soil Pollut.: Focus, 4, 161174.
Rankinen K., Lehtonen H., Granlund K. and Bärlund, I., 2004c. Assessing the effects of agricultural change on nitrogen fluxes using the Integrated Nitrogen CAtchment (INCA) model. Integrated Assessment and Decision Support Proc. 2nd biennial meeting Int. Environ. Modelling and Software Soc., 1417 June 2004, University of Osnabruck, Germany.
Rekolainen, S., 1989a. Phosphorus and nitrogen load from forest and agricultural areas in Finland. Aqua Fennica, 19 , 95107. Rekolainen, S., 1989b. Effect of snow and soil frost melting on
the concentrations of suspended solids and phosphous in two rural watersheds in Western Finland. Aquat. Sci., 51, 211223. Rekolainen, S., Kauppi, L. and Turtola, E., 1992. Maatalous ja vesien tila. MAVEROn loppuraportti [in Finnish], Luonnonvarajulkaisuja 15. Luonnonvarainneuvosto, Maa- ja metsätalousministeriö., 61pp.
Räike, A., Pietiläinen, O.-P., Rekolainen, S., Kauppila, P., Pitkänen, H., Niemi, J., Raateland, A. and Vuorenmaa, J., 2003. Trends of phosphorus, nitrogen and chlorophyll a concentrations in Finnish rivers and lakes in 19752000. Sci. Total Envir., 310, 4759.
Seuna, P., 1982. Frequency analysis of runoff of small basins. Publications of the Water Research Institute, 48. National Board of Waters, Finland. 77pp.
Seuna, P., 1983. Small basins - a tool in scientific and operational hydrology. Publications of the Water Research Institute 51. National Board of Waters, Finland. 61pp.
Seuna, P. and Kauppi, L., 1981. Influence of sub-drainage on water quantity and quality in a cultivated area in Finland. Publications of the Water Research Institute 43. National Board of Waters, Finland.
Sippola, J., 1981. Viljelymaan typpivarat. Koetoiminta ja käytäntö, 39:51.
Smolander, A., Kukkola, M. and Mälkönen, E., 1998. Metsäekosysteemin toiminta typpikuormituksen alaisena. In: Ympäristönmuutos ja metsien kunto, E. Mälkönen (Ed.), Metsien terveydentilan tutkimusohjelman loppuraportti. Vol 691, Metsäntutkimuslaitos, 175181.
Syri, S., 2001. Air pollutants and energy pathways: Extending models for abatement strategies. Monographs of the Boreal Environment Research, 19, 43pp.
Turtola, E. and Jaakkola, A., 1985. Viljelykasvin ja lannoituksen vaikutus typen ja fosforin huuhtoutumiseen savimaasta. (In Finnish). Maatalouden tutkimuskeskus. Tiedote 6/85. 43pp. Turtola, E. and Paajanen, A., 1995. Influence of improved
subsurface drainage on phosphorus losses and nitrogen leaching from a heavy clay soil. Agr. Water Manage., 28, 295310. Turtola, E. and Kemppainen, E., 1998. Nitrogen and phosphorus
losses in surface and drained water after application of slurry and mineral fertilizer to perennial grass ley. Agr. Food Sci. Finland, 7, 569581.
Ulen, B., 1998. Nutrient exports from two agriculture-dominated watersheds in Southern Sweden. Nord. Hydrol., 29, 4156. Vagstad, N., Eggestad, H.O. and Hoyås, T.R., 1997. Mineral
nitrogen in agricultural soils and nitrogen losses: Relation to soil properties, weather conditions, and farm practices. Ambio,
Vagstad, N., Stålnacke, P., Estrup Andersen , H., Deelstra, J., Gustafson, A., Ital, A., Jansons, V., Kyllmar, K., Loigu, E., Rekolainen, S., Tumas, R. and Vuorenmaa, J., 2001. Nutrient Losses from Agriculture in The Nordic and Baltic Countries. Measurements in small agricultural catchments and national agro-environmental statistics. Nordic Council of Ministers, Copenhagen. TemaNord 2001, 591. 74pp.
Valpasvuo-Jaatinen, P., Rekolainen, S. and Latostenmaa, H., 1997. Finnish agriculture and its sustainability: environmental impacts. Ambio, 26, 448455.
Vehviläinen, B., 1994. The watershed simulation and forecasting system in the National Board of Waters and the Environment. Publications of the Water and Environment Research Institute, 17, National Board of Waters and the Environment, Finland. 3 16.
Vuorela, A., 1997. Satellite image based land cover and forest classification of Finland. In: Proc. Finnish-Russian Seminar on Remote Sensing, R. Kuittinen (Ed.) Helsinki, 29 August-1 September, 1994. Reports of the Finnish Geodetic Institute, 97, 4252.
Vuorenmaa, J., Juntto, S. and Leinonen, L., 2001. Rainwater quality and bulk deposition in Finland in 1998. In Finnish with English abstract. The Finnish Environment 468. Environmental protection. 115pp.
Vuorenmaa. J., Rekolainen, S., Lepistö, A., Kenttämies, K. and Kauppila, P., 2002. Losses of Nitrogen and Phosphorus from Agricultural and Forest Areas in Finland during the 1980s and 1990s. Environ. Monit. Assess., 76, 213248.
Wade, A.J., Durand, P., Beaujouan, V., Wessels, W., Raat, K., Whitehead, P.G., Butterfield, D., Rankinen, K. and Lepistö, A., 2002. A nitrogen model for European catchments: New model structure and equations. Hydrol. Earth Syst. Sci., 6, 559582. (See also Errata. Hydrol. Earth Syst. Sci., 8, 858859.) Whitehead, P.G., Wilson, E.J. and Butterfield, D., 1998. A
semi-distributed Integrated Nitrogen model for multiple source assessment in Catchments (INCA): Part I - model structure and process equations. Sci. Total Envir., 210/211, 547558.