HAL Id: hal-00317848
https://hal.archives-ouvertes.fr/hal-00317848
Submitted on 15 Sep 2005
HAL is a multi-disciplinary open access
archive for the deposit and dissemination of
sci-entific research documents, whether they are
pub-lished or not. The documents may come from
teaching and research institutions in France or
abroad, or from public or private research centers.
L’archive ouverte pluridisciplinaire HAL, est
destinée au dépôt et à la diffusion de documents
scientifiques de niveau recherche, publiés ou non,
émanant des établissements d’enseignement et de
recherche français ou étrangers, des laboratoires
publics ou privés.
and variabilities in the regional aerosol distribution over
the oceanic areas around the Indian subcontinent
S. K. Nair, K. Parameswaran, K. Rajeev
To cite this version:
S. K. Nair, K. Parameswaran, K. Rajeev. Seven year satellite observations of the mean structures and
variabilities in the regional aerosol distribution over the oceanic areas around the Indian subcontinent.
Annales Geophysicae, European Geosciences Union, 2005, 23 (6), pp.2011-2030. �hal-00317848�
SRef-ID: 1432-0576/ag/2005-23-2011 © European Geosciences Union 2005
Annales
Geophysicae
Seven year satellite observations of the mean structures and
variabilities in the regional aerosol distribution over the oceanic
areas around the Indian subcontinent
S. K. Nair, K. Parameswaran, and K. Rajeev
Space Physics Laboratory, Vikram Sarabhai Space Centre, Trivandrum 695 022, India
Received: 16 February 2005 – Revised: 30 May 2005 – Accepted: 2 June 2005 – Published: 15 September 2005
Abstract. Aerosol distribution over the oceanic regions around the Indian subcontinent and its seasonal and interan-nual variabilities are studied using the aerosol optical depth (AOD) derived from NOAA-14 and NOAA-16 AVHRR data for the period of November 1995–December 2003. The air-mass types over this region during the Asian summer monsoon season (June–September) are significantly different from those during the Asian dry season (November–April). Hence, the aerosol loading and its properties over these oceanic regions are also distinctly different in these two pe-riods. During the Asian dry season, the Arabian Sea and Bay of Bengal are dominated by the transport of aerosols from Northern Hemispheric landmasses, mainly the Indian sub-continent, Southeast Asia and Arabia. This aerosol transport is rather weak in the early part of the dry season (November– January) compared to that in the later period (February– April). Large-scale transport of mineral dust from Arabia and the production of sea-salt aerosols, due to high surface wind speeds, contribute to the high aerosol loading over the Arabian Sea region during the summer monsoon season. As a result, the monthly mean AOD over the Arabian Sea shows a clear annual cycle with the highest values occurring in July. The AOD over the Bay of Bengal and the Southern Hemi-sphere Indian Ocean also displays an annual cycle with max-ima during March and October, respectively. The amplitude of the annual variation is the largest in coastal Arabia and the least in the Southern Hemisphere Indian Ocean. The inter-annual variability in AOD is the largest over the Southeast Arabian Sea (seasonal mean AOD varies from 0.19 to 0.42) and the northern Bay of Bengal (seasonal mean AOD varies from 0.24 to 0.39) during the February–April period and is the least over the Southern Hemisphere Indian Ocean. This study also investigates the altitude regions and pathways of dominant aerosol transport by combining the AOD distribu-tion with the atmospheric circuladistribu-tion.
Keywords. Atmospheric composition and structure (Aerosols and particles) – Meteorology and atmospheric dynamics (Climatology) – Oceanography: physical (Ocean fog and aerosols)
Correspondence to: K. Parameswaran
(k parameswaran@vssc.org)
1 Introduction
The effects of aerosols on the radiation budget of the Earth-atmosphere system, cloud characteristics and the Earth’s cli-mate are well recognised (Charlson et al., 1992; Hansen et al., 1997; Ramanathan et al., 2001a,b). Annual variation of tropospheric circulation and the resulting aerosol trans-port over the oceanic regions around the Indian subconti-nent are unique because the Inter Tropical Convergence Zone (ITCZ) has the largest annual migration over this part of the globe. Over the Indian longitude the ITCZ, which is lo-cated around 15–20◦S in the February–March period, moves to 20– 25◦N during the Asian summer monsoon period of June–September. As a result, the Arabian Sea, Bay of Ben-gal and the tropical Indian Ocean encounter contrasting air-mass types in these two periods. The prevailing lower tro-pospheric wind in this region during the Asian dry season has a dominant northerly component directed from the con-tinents to the ocean. This flow pattern enables transport of continental aerosols over to the Arabian Sea, Bay of Ben-gal and Indian Ocean, as revealed by several studies (e.g. Husar et al., 1997; Krishnamurti et al., 1998; Rajeev et al., 2000; Leon et al., 2001; Li and Ramanathan, 2002; Satheesh and Srinivasan, 2002; Tahnk and Coakley, 2002; Nair et al., 2003; Ramachandran, 2004). This aerosol transport is aided by the relatively large aerosol residence time (about 10 days) caused by the prevailing large-scale dryness during the Asian dry period (Lelieveld et al., 2001). The lower tropospheric circulation and the strength of the lower tropospheric inver-sion during this season also show significant year-to-year variabilities. This leads to a large interannual variability in aerosol distribution over the Arabian Sea and Bay of Bengal (Nair et al., 2003). During the June–September period, due to the intense low pressure zone generated in the northwest-ern parts of the Indian subcontinent, the ITCZ migrates north and brings the massive Asian summer (southwest) monsoon over to this region. During this season horizontal pressure gradient and lower tropospheric wind speeds over the Indian subcontinent and adjoining oceanic regions are significantly larger than those during the Asian dry period. Though this season is characterised by high rainfall in the region east of the central Arabian Sea, leading to increased aerosol removal
through washout and rainout (thereby reducing aerosol resi-dence time), large-scale transport of aerosols through the pre-vailing strong lower and mid tropospheric westerlies (Rajeev et al., 2004) is quite significant.
Regional distribution and transport of aerosols over the oceanic regions around the Indian subcontinent observed us-ing satellite data showed large interannual variability (Rajeev and Ramanathan, 2000; Li and Ramanathan, 2002; Tahnk and Coakley, 2002; Nair et al., 2003; Rajeev et al., 2004). But most of these observations were based on a limited data length of 3 to 4 years, a good number of which were based on the observation period of 1998–1999 around the Indian Ocean Experiment (INDOEX) (Ramanathan et al., 2001a). These observations, however, showed that AOD values dur-ing the March and April period of 1999 over the southeast Arabian Sea and northern Bay of Bengal were larger than those during the corresponding periods of 1997 and 1998 by a factor of 1.5 to 2 (Nair et al., 2003). This brought out the need for establishing a regional mean aerosol distribution that is truly representative for this region and to quantify the year-to-year variability in AOD using a larger database.
The continuous series of data from the Advanced Very High Resolution Radiometer (AVHRR) on board the NOAA-14 and NOAA-16 satellites provide an opportunity to study the regional distribution of aerosols and their interannual variability over the oceanic areas around the Indian subcon-tinent bounded by 25◦N to 25◦S in latitude and 40◦E to 100◦E in longitude, using a longer period data. Here we report the mean structures in the monthly and seasonal mean regional aerosol distribution and their interannual variabili-ties based on the AOD derived from 14 and NOAA-16 AVHRR data during the seven-year period from Novem-ber 1995 to DecemNovem-ber 2003.
2 Data and method of analysis
The AOD at the wavelength 630 nm ±50 nm over the oceanic regions around the Indian subcontinent is derived from the radiance measured in Channel 1 of NOAA-14/NOAA-16 AVHRR during the period of November 1995 to Decem-ber 2003. Due to the delay in the equatorial crossing time of NOAA-14, the solar zenith angle for most of the pixels was very high in the anti-solar side of the scan during 2000. This leads to a larger uncertainty in the derived AOD val-ues. Hence we have used NOAA-14 data only up to Decem-ber 1999. The NOAA-16 data is available only from March 2001. This has resulted in a data gap of 14 months, from January 2000 to February 2001 in the present study. The method of deriving AOD from the satellite data, the sources of errors, and the intercomparison of the AOD derived from AVHRR data with in-situ measurements are presented else-where (Rajeev et al., 2000; Rajeev and Ramanathan, 2000; Parameswaran et al., 2004; Rajeev et al., 2004). The global area coverage (GAC) data of the afternoon satellite passes are used for the retrieval of AOD. Revised post-launch cal-ibration constants, which correct for the degradation of the
AVHRR channel 1 sensor, are used to convert the digital counts to reflectance (Rao and Chen, 1999, and calibration updates from NOAA website at http://noaasis.noaa.gov). Re-trieval of AOD is based on the comparison of the observed satellite radiance at channel 1 with the look-up tables of modelled radiances. The look-up tables of satellite radiances as a function of solar zenith angle, the satellite viewing an-gle, relative azimuth, surface wind speed, and AOD are gen-erated using the discrete ordinate radiative transfer method (Stamnes et al., 1998) for a plane parallel atmosphere with 32 layers in vertical which accounts for the multiple scatter-ing and absorption by aerosols and molecules (Rajeev et al., 2000). In order to minimize errors in the retrieval of AOD, we use the data only from the anti-solar side of the satellite scan. Variations in ocean reflectance due to wind speed are taken into account by considering daily surface winds from the NCEP/NCAR reanalysis. Clear sky pixels that are not adjacent to cloudy pixels are only used for the estimation of AOD. Identification of the clear sky pixels is done based on the threshold, channel ratio and spatial coherence methods (Rajeev and Ramanathan, 2000).
The aerosol scattering phase function and single scatter-ing albedo are required for derivscatter-ing AOD from the satellite-measured radiance. The scattering and absorption properties of aerosols used in deriving the AOD for the summer mon-soon period and the Asian dry period are explained in Rajeev et al. (2004). Extensive observations of the scattering and absorbing properties of aerosols carried out over the Indian Ocean during the Asian dry season of 1998 and 1999, par-ticularly in the January–March period as part of INDOEX, are used to derive the aerosol scattering phase function for the estimation of AOD during the Asian dry season. The sin-gle scattering albedo at the surface is taken as 0.90 with a column integrated value of 0.87, which is in agreement with the in-situ observations (Ramanathan et al., 2001a). These values are also in agreement with those reported by Eck et al. (2001), using the aerosol data obtained at the Kaashidhoo Climate Observatory (KCO), Maldives, during the January– April period of 1998–2000. It is interesting to note that the Angstrom exponent observed at KCO is very consistent (be-tween 0.97 and 1.24) during the November to April period (Holben et al., 2001). Unlike the Asian dry season, ex-haustive measurements of aerosol properties are lacking over the oceanic areas around the Indian subcontinent during the summer monsoon period. However, several satellite-based observations have demonstrated that the aerosol distribution over the Arabian Sea and Indian Ocean are significantly in-fluenced by the transport of dust aerosols from the Arabian Desert (Husar et al., 1997; Li and Ramanathan, 2002; Ra-jeev et al., 2004). Two channel inversion of Mishchenko et al. (1999) showed that the Angstrom exponent is very nearly uniform over the Arabian Sea, Bay of Bengal and the tropical Indian Ocean and has a mean value of ∼0.4 during the sum-mer monsoon period, which is grossly in agreement with the Angstrom exponent observed at Bahrain (Holben et al., 2001; Dubovik et al., 2002), the Indian Ocean island of Kaashid-hoo (Holben et al., 2001) and the ship-borne observations at
the Arabian Sea (Vinoj and Satheesh, 2003). Kaufman et al. (2001) showed that the dust aerosols are less absorbing and have a mean single scattering albedo of 0.97 in the vis-ible region. Dubovik et al. (2002) reported aerosol single scattering albedo between 0.92 and 0.95 in the visible region over Bahrain during the Asian summer monsoon period. The dust-laden air from the Saharan region is also found to have an aerosol single scattering albedo around 0.93. The model presented by Takemura et al. (2002) suggests aerosol single scattering albedo of ∼0.9 to 0.95 over this region during the summer monsoon period. Considering the above observa-tions and models, in the present study, we assume that during the summer monsoon period the aerosol size distribution is of modified power law (MPL) type, yielding an Angstrom ex-ponent of 0.4, in accordance with the reports of Mishchenko et al. (1999) and the single scattering albedo of these aerosols is 0.93.
The satellite derived AODs are compared with the ground-based measurements of AOD, as described in Rajeev and Ramanathan (2000); Parameswaran et al. (2004); Rajeev et al. (2004) and hence are not repeated here. The satellite re-trieved AOD during the Asian dry season is compared with the ground-based measurements of AOD at Kaashidhoo, as well as ship-borne observations (Rajeev and Ramanathan, 2000) over the Arabian Sea and Indian Ocean. The slope of the intercomparison between the two during the Asian dry period is 0.98 with an intercept of 0.02. The correlation co-efficient is 0.92. The RMS deviation between the AVHRR-derived and the ground-measured of AOD is 0.055. A com-parison of the monthly mean AOD obtained from ground-based measurements at KCO (Li and Ramanathan, 2002) with that of the present AVHRR-derived AOD indicates that the values are in agreement within 0.03, except for one case in which the difference is 0.07 (Rajeev et al., 2004). Sensi-tivity analysis of the satellite derived AOD due to variations in the assumed aerosol phase function, the single scattering albedo, the surface reflectance and the AVHRR calibration constants, was also carried out (Rajeev et al., 2000; Rajeev and Ramanathan, 2000; Rajeev et al., 2004). Based on these, the maximum uncertainty of the AVHRR derived AOD is approximately 15% during the Asian dry season. Consid-ering the non-availability of in-situ measured chemical and radiative properties of aerosols, the maximum uncertainty in AVHRR-derived AOD during the summer monsoon season is expected to be slightly larger but less than 20%.
3 Results
3.1 Spatial distribution of aerosol optical depth
Aerosol optical depths are derived only from the pixels that are not affected by clouds. Furthermore, the solar side of the satellite scan is avoided in deriving AOD. The pixelwise AOD values for each satellite pass in the latitude-longitude range of 25◦S to 25◦N and 40◦E to 100◦E are gridded at 1◦ by averaging the AOD values derived from all the clear
sky individual pixels within the grid box. The frequency of occurrence of clouds in the Arabian Sea and Bay of Bengal regions are distinctly different during each season. North of the equator the fractional cloudiness is generally less than 30% during the November to April period and is lowest (less than 20%) between 10◦N and 25◦N for all the longitudes in this region during the January to March period. During the Asian dry season, south of the equator up to about 20◦S, due to the presence of ITCZ, the fractional cloudiness is gener-ally more than 60%. During the summer monsoon period, north of equator over the central and east Arabian Sea, In-dian peninsula and Bay of Bengal, the fractional cloudiness is generally greater than 60% and often exceeds 70% in July and August. During the Asian dry season, the number of days in which AOD values could be derived for each 1◦×1◦grid is more than 10 per month except between 0 to 20◦S, where the number of days in which AOD could be derived for each grid is around 5 per month (Rajeev and Ramanathan, 2000). At the western Arabian Sea close to the coast where the frac-tional cloudiness is less than 30% throughout the summer monsoon, the AOD values are available for more than 10 days per month. Similar is the case for the region over the Indian Ocean south of around 15◦S during this season (Ra-jeev et al., 2004).
A seven-year (1996–1999, 2001–2003) average of the monthly mean regional aerosol distribution over oceanic ar-eas around the Indian subcontinent is obtained by averaging the satellite derived AOD in the same month for different years during the study period and this is shown in Fig. 1. The arrows indicate that the monthly mean vector wind field at 850-hpa (approximately 1.5 km above MSL) level prevailed in this region. The aerosol distribution clearly undergoes a notable annual variation over most of the regions in the Northern Hemisphere as discussed below:
1. The mean AOD over the west Arabian Sea, close to the Arabian coast is less than 0.2 during January–February, and increases to 0.3 in the March–May period. By June, AOD in this region increases drastically (exceeding 0.4) and reaches its highest value, exceeding 0.5 in July fol-lowed by a decrease to ∼0.3 by September. The AOD and its spatial distribution remain more or less stable during the period November to January.
2. The mean AOD over the east Arabian Sea, close to the Indian peninsula is less than 0.3 during January– February. This value increases to ∼0.4 in the March– April period, especially at the southeast Arabian Sea, while it remains less than 0.3 over the northeast part. Though the AOD values over the east Arabian sea show a small decrease up to June, by July–August the en-tire Arabian sea region is characterized by high ues of AOD. By November–December, the AOD val-ues resume to the level that is observed in January. From November the spatial pattern of AOD also restores slowly to its January pattern through December.
Fig. 1. Spatial distribution of monthly mean AOD (at 630±50 nm) averaged for seven years (1996–1999, 2001–2003) over oceanic areas around the Indian subcontinent, along with the monthly mean wind vectors at 850-hpa level.
3. Over the northwest Bay of Bengal, relatively large AOD values exceeding 0.3 are observed over a small region close to the Indian Peninsula during January–June. In January–February over the rest of the region, AOD de-creases with increasing distance from the continent.
This high in AOD and its spatial extent increase, reach-ing their respective maxima in April (∼0.4) followed by a decrease then onwards and a reduction to AOD<0.2 by September, and again an increase from October. The AOD and its spatial distribution in this region during
December are very similar to those observed in January. This shows that the temporal variation of AOD and its spatial distribution are distinctly different in the western and eastern parts of Indian Peninsula.
4. The western parts of Bay of Bengal have AOD values between 0.2 to 0.3 during the January–April period and
<0.2 during the May to November period. By Decem-ber, the AOD value exceeds 0.2 over some parts in this region.
5. A minimum in AOD is observed in the central Bay of Bengal throughout the year.
6. From January to May in most of the places over the Southern Hemisphere Indian Ocean (SHIO), the AOD values are generally <0.1 except over a small region close to ∼15◦S where it exceeds 0.15. It increases marginally in the June–November period and is in the range of 0.1 to 0.2 in the latitude belt ∼5◦S to 15◦S. In general, AOD is highest in October (between 0.2 and 0.3) in the western parts near Sumatra and Indonesia, followed by a decrease, to reach its background value by December–January.
3.2 Annual variation in different sectors
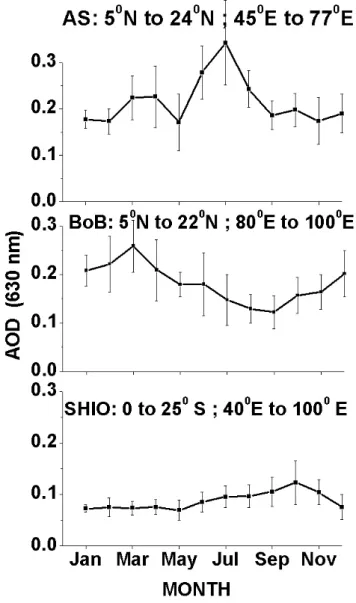
The annual variation in the regional mean AOD over three distinct regions viz. the Arabian Sea (5◦N to 24◦N, 45◦E to 77◦E), the Bay of Bengal (5◦N to 22◦N, 80◦E to 100◦E), and the Southern Hemisphere Indian Ocean (0 to 25◦S, 40◦E to 100◦E) are examined in detail. The monthly values of AOD in these regions for the study period are presented in Fig. 2, along with vertical bars indicating the standard de-viations. Over the Arabian Sea, the regional mean AOD is maximum in July (∼0.34) and minimum (∼0.17) in Novem-ber. A secondary maximum is also observed in the March to April period (∼0.22), which is contributed by high AOD val-ues in the southeast Arabian Sea near the Indian peninsula. The large standard deviations during the March to July pe-riod when the mean AOD is relatively high are due to larger spatial gradients and the interannual variability in AOD as-sociated with variations in lower tropospheric circulation, which will be discussed later. Over the Bay of Bengal, the mean AOD is high during the November–April period with a peak (0.26) during March and a low (∼0.12) in the August– September period. The standard deviations are also large in February–April and June–July. The annual variation in the mean AOD is less significant over the Southern Hemisphere Indian Ocean (SHIO), where the highest values (∼0.12) are encountered in October and lowest values (∼0.07) during the December–May period. The standard deviation is also large in October, showing large spatial and temporal variability. 3.3 Latitude variation of AOD
The latitude variation in the monthly mean AOD in five dif-ferent longitude sectors viz. the West Arabian Sea (WAS; 40◦E to 60◦E), Central Arabian Sea (CAS; 60◦E to 70◦E),
Fig. 2. Monthly variation of AOD averaged for 7 years from 1996– 1999, 2001–2003 for the Arabian Sea (5◦N to 24◦N; 45◦E to 77◦E), Bay of Bengal (5◦N to 22◦N; 80◦E to 100◦E) and South-ern Hemispheric Indian Ocean (0 to 25◦S; 40◦E to 100◦E).
East Arabian Sea (EAS; 70◦E to 80◦E), West Bay of Ben-gal (WBoB; 80◦E to 90◦E) and East Bay of Bengal (EBoB; 90◦E to 100◦E) are examined in detail. These sectors are selected such that the spatial variations along the longitude are insignificant. It may also be noted that even though these sectors are taken with a fixed longitudinal width of 10◦, since no AOD data will be available over the land, the number of AOD values averaged for each latitude will not be the same in all longitude sectors. In those sectors for a given latitude that encounters more continental regions the available num-ber of AOD values will be small and as such, these should be treated cautiously. Additionally, cloud cover also limits the number of AOD values in different sectors, especially near the northern continents during the monsoon period as described in Sect. 3.1. The monthly mean values of AOD for
each latitude in these longitude sectors are estimated by av-eraging the corresponding 1◦×1◦grided AOD data for a lat-itudinal width of ±0.5◦centred around latitude. These mean values of AOD in each month are examined to study the lat-itudinal variation in different longitude sectors. The latitu-dinal variations for different months are presented in Fig. 3, with each curve depicting the latitude variations in different longitudinal sectors. Throughout the year, the latitude varia-tion in AOD is large in the Northern Hemisphere compared to that in the Southern Hemisphere, and also shows significant seasonal variations. A sharp gradient in AOD is observed especially north of 5◦N. Between the equator and 15◦S the latitudinal gradient is very small and the AOD values remain fairly constant in this region considering the associated un-certainties. South of 15◦S, on average, the AOD shows a small decrease with an increase in latitude except during the winter months. Though the latitude variation in AOD is al-most similar in the East Arabian Sea and Bay of Bengal sec-tors during the November to May period, a significant differ-ence is observed in these sectors during June–August.
Over the WAS sector, the highest latitude gradient in AOD is observed during June –August at north of about 5◦N, with the mean AOD increasing from about 0.15 to greater than 0.5 with increase in latitude. Generally, the latitude gradient is higher in the EAS sector in all the months. During the March –April period, it is significantly larger than those in the other sectors. During May, the latitudinal gradients in all five sec-tors are more or less similar. The gradient in the EAS sector starts increasing from June and reaches its maximum by July. Except during the June to September period, the latitudinal gradient in the CAS sector is generally smaller than that in the other Arabian Sea sectors. In the CAS and EAS sectors the gradient increases drastically in July and becomes more or less the same as that for the western sector. While the gra-dients in the three Arabian Sea sectors are almost the same in July and start decreasing from August, those over the Bay of Bengal remain more or less the same as that observed in May. It is quite interesting to note that the latitudinal gra-dients in the two Bay of Bengal sectors are low during the June–September period and build up slowly from October, reaching maximum during the March–April period. The lat-itude gradient is least in all the sectors during the October– November period. In the East Bay of Bengal sector, a peak in the AOD is observed around 15◦N predominantly in the Asian dry season, with relatively larger values in March. This feature is also observable in the AOD maps shown in Fig.1, close to the Myanmar coast, associated with a localized high value of AOD, which can be attributed to a localised advec-tion of aerosols from the adjacent continent. It may be noted that in this longitude sector beyond 15◦N, the oceanic region is relatively small and no AOD will be available over the con-tinents. As such, data availability will also be poor beyond 15◦N in this sector, especially during the monsoon period. In such cases the curve for this sector is terminated at 15◦N. Another important feature observed in this figure is a small peak in AOD appearing around 15◦N in the West Bay of Bengal sector during the June–July period. This feature is
also observable from AOD maps presented in Fig. 1. On ex-amining the wind field in this figure it can be seen that during the Asian dry period the flow is directed along the east coast of the Indian continent which turns to west in the Peninsular region around 15◦N and the AOD in this region decreases from 20◦N towards south in the direction of the flow. With the onset of monsoon in the west coast of the Indian penin-sula in June the flow pattern changes drastically. The wind is directed across the Indian Peninsula. The high AOD region near the east coast on peninsular India extending to Head of Bay of Bengal (HBoB) recedes north, leaving a small portion around 15◦N, which subsequently spreads towards the east in June along the wind direction. With the onset of south-west monsoon, though the source strength over central India decreases and the wet removal becomes more efficient, re-sulting in a drastic decrease in the strength of the continental aerosol plume, the east-coast of the Indian peninsula remains more or less dry because of scanty rain fall in this region, which picks up only towards the end of the southwest mon-soon period (September). Thus, the east coast of the Indian peninsula remains fairly dry during June and strong westerly wind drives the aerosol from the continent over to BoB, con-tributing to the peak in AOD around 15◦N (Fig. 3) in the EBoB sector (this feature is observable in Fig. 1 also). This peak disappears almost completely by September. The latitu-dinal gradient in the two BoB sectors is very small during the September to November period, as there is no significant ad-vection of continental aerosols over to the BoB in this period of the year.
This study thus clearly brings out the fact that the latitu-dinal gradients over the northern parts show significant vari-ability with longitude and is strongly influenced by the na-ture of advection from the adjoining continental landmasses. Apart from this, a small increase in AOD is seen south of the equator up to about 15◦S in all five sectors, with the highest AOD occurring around 15◦S during the period June-September (with peak values around 0.13). This increase is less pronounced during the Asian dry season, and can be at-tributed to increased in-situ production of sea-salt aerosols through strong surface winds. A peak in AOD appearing around 10◦S in the two longitude sectors over the Bay of Bengal (WBoB and EBoB) during the September-December period is due to increased aerosol loading caused by forest fires occurring in the Indonesian region associated with in-creased dryness (Parameswaran et al., 2004).
As can be seen from Fig. 3, the latitude variations in AOD are well pronounced in the Northern Hemisphere. In order to depict the seasonal variations in latitude gradient, the mean gradient in each of the five longitude sectors are estimated for each month through linear regression. This analysis is performed for the entire latitude region (20◦S to 20◦N), as well as for the Northern Hemisphere in the latitude region 0 to 20◦N, where the gradients are largest. The month-to-month variations of the AOD gradient (per degree latitude) thus obtained for the two cases are presented in Figs. 4a and b, respectively. Though the gross seasonal patterns of the lat-itude gradients in Figs. 4a, b are similar, the variations are
Fig. 3. Monthly mean latitudinal variation of AOD averaged for the period of 1996–1999, 2001–2003 in the longitudinal sectors of the West Arabian Sea (WAS; 40◦E to 60◦E), Central Arabian Sea (CAS; 60◦E to 70◦E), East Arabian Sea (EAS; 70◦E to 80◦E), West Bay of Bengal (WBoB; 80◦E to 90◦E) and East Bay of Bengal (EBoB; 90◦E to 100◦E).
more pronounced in Fig. 4b. The absolute value of the gra-dient in Fig. 4b is also significantly larger (about twice) than the corresponding value in Fig. 4a. Seasonal variations of the latitude gradient in AOD in different longitude sectors are clearly observable in Fig. 4. The latitude gradient in the two BoB sectors is very small during September and October
(nearly zero in EBoB sector). The gradient in all five sec-tors show a peak during the March–April period when the AOD value over the Indian continent shows also a maximum (Moorthy et al., 1993; Vinoj et al., 2004). A sharp increase in gradient is observed in the Arabian Sea sectors during the July–August period while this feature is totally absent in the
Fig. 4. Month-to-month variation of latitude gradient in AOD ob-served by linear regression of latitude variation in the West Arabian Sea (WAS; 40◦E to 60◦E), Central Arabian Sea (CAS; 60◦E to 70◦E), East Arabian Sea (EAS; 70◦E to 80◦E), West Bay of Ben-gal (WBoB; 80◦E to 90◦E) and East Bay of Bengal (EBoB; 90◦E to 100◦E) for the entire latitude region of 20◦S to 20◦N (a) and for the Northern Hemisphere 0–20◦N (b).
BoB sectors. This is mainly contributed by the high AOD over the Arabian Sea during the summer monsoon season.
It would sometimes be more meaningful to present the lat-itude distribution in terms of a “scale distance” rather than a linear gradient, in quantifying the spatial distribution of AOD. The scale distance is defined here as the distance at which the AOD decreases by a factor of 1/e from its ini-tial value around 20◦N (near the continent) along each lon-gitude sector across the latitude. For this it is necessary to examine the slope of a logarithmic regression between AOD and latitude. The regression analysis is performed between log (AOD) and latitude at different longitude sectors and the resulting slopes are obtained. The scale distance is es-timated by multiplying the reciprocal of the regression slope by 110 km, which approximately corresponds to the horizon-tal distance covered by 1◦latitude in the tropics. The month-to-month variation of scale distance in different longitude sectors thus obtained is presented in Figs. 5a and 5b, re-spectively, for the 20◦S to 20◦N and 0 to 20◦N. The scale
Fig. 5. Month-to-month variation of “scale distance” (see text
for details) in different longitude sectors in the West Arabian Sea (WAS; 40◦E to 60◦E), Central Arabian Sea (CAS; 60◦E to 70◦E), East Arabian Sea (EAS; 70◦E to 80◦E), West Bay of Bengal (WBoB; 80◦E to 90◦E) and East Bay of Bengal (EBoB; 90◦E to 100◦E) for the entire latitude region 20◦S to 20◦N (a) and for the Northern Hemisphere 0–20◦N (b).
distance is low when the latitude gradient in AOD is large and vice versa. In the Northern Hemisphere, except over the mid Arabian Sea sectors, in general, the scale distance is around 2000–3000 km during January which decreases to <2000 km by August. This is in agreement with the value of scale dis-tance derived from spatial variation of aerosol optical depth measured using solar radiometer on different cruises over the Arabian Sea and Indian Ocean (Satheesh et al., 1998). The scale distances in the three Northern Hemispheric Arabian Sea sectors increases to >3000 km during the October– De-cember period. During September–November the scale dis-tance is very large in the BoB sectors (as seen from Fig. 3 there is no pronounced latitude variation in these sectors dur-ing this period) and hence is not presented in this figure. On examining the scale distance in Fig. 5a (20◦S to 20◦N) the value lies in the range of 2000 to 8000 km in all the longi-tude regions. Due to very small AOD gradients prevailing in the Southern Hemisphere the overall scale distance is langer than that in the Northern Hemisphere.
4 Interannual variations in the mean AOD during 1996–2003
As seen in the earlier studies (Nair et al., 2003; Rajeev et al., 2004) the monthly mean spatial pattern of prevailing lower tropospheric circulation and hence the aerosol transport show significant similarities during the period November to Jan-uary (first half of the Asian dry season, hereafter referred to as D1), February to April (second half of the Asian dry season, hereafter referred to as D2), and June to Septem-ber (Asian summer monsoon season, hereafter indicated by SM). This is also evident from the circulation pattern at the 850-hpa level presented in Fig. 1. Hence, the AOD data are grouped into three seasons and the seasonal mean AOD dur-ing each year of observation is obtained. The intra-season months of May and October are not included in estimating the seasonal mean AODs mainly because of the fact that the circulation pattern changes from one form to other in the month and hence could not be included in either of the two. Figure 6 shows the regional distribution of the seasonal mean AOD during D1, D2 and SM for different years during the study period. The geographical structure of the seasonal mean AOD distributions (such as the locations of low and high AOD) is strikingly similar during the same season in different years, though significantly large interannual vari-ability in AOD is observable. This varivari-ability is largest dur-ing the second half of the Asian dry season (February–April), particularly over the southeast Arabian Sea and north Bay of Bengal near the Indian peninsula. The seasonal mean AOD values during the February–April period of 1999 is about 1.5 to 2 times larger than the corresponding values during all the other years. Though this enhanced aerosol loading is largest around the Indian peninsula, such high AOD val-ues are also observed in the eastern parts of Bay of Ben-gal and the coastal regions of Arabia. It is also interesting to note that the AOD values are considerably lower in these regions for the same season in the previous and subsequent years. The maximum observed interannual variability (min-imum to max(min-imum value) in AOD is ∼0.25 in the southeast Arabian Sea and northwest Bay of Bengal near the Indian peninsula and in Southeast Asia during the February–April period. This variability is less than 0.2 in all the seasons over the West Arabian Sea. Interannual variability in the sea-sonal mean AOD is a minimum during the first half of the Asian dry period (November–January), and is less than 0.1 over most of the areas in the Northern Hemisphere. During the Asian summer monsoon season (June–September), the seasonal mean AOD ranges from ∼0.45 to 0.6 near the west-ern Arabian Sea close to Arabia, a zone of largest aerosol loading over the study region. The interannual variability in AOD in this region is less than 0.2. Though this variabil-ity is relatively high in the eastern and central Arabian Sea during the summer monsoon, it must be remembered here that this region is mostly cloudy during the Asian summer monsoon season (with seasonal mean fractional cloudiness between 70% and 90%). The AOD data during the sum-mer monsoon period in this region is only one-fourth of that
available in other regions and also in the same region during the other seasons and hence should be treated cautiously.
The observed interannual variability in AOD can be at-tributed to the interannual variability in the rainfall, tropo-spheric circulation and surface wind speed. Over the Bay of Bengal, the seasonal mean AOD values are less than 0.3 during SM and the maximum variability is less than ∼0.15. Over the Southern Hemisphere Indian Ocean, these values are less than 0.2 in all seasons, except during the second half of 1997 when the tropical Indian Ocean was under the in-fluence of an intense aerosol plume originating from the In-donesian forest fires (Parameswaran et al., 2004) and the in-terannual variability is less than ∼0.05. This aspect is further examined in detail by taking the mean AODs over a relatively small region bounded by 5◦×5◦in latitude-longitude width. The regions so selected are: Coastal Arabia (CA: 15◦N to 20◦N, 58◦E to 63◦E), Southeast Arabian Sea (SEAS: 7◦N to 12◦N, 70◦E to 75◦E), Head Bay of Bengal (HBoB: 15◦N to 20◦N, 85◦E to 90◦E), South East Bay of Bengal (SEBoB: 0◦to 5◦N, 90◦E to 95◦E) and Southern Hemisphere Indian Ocean (SHIO: 15◦S to 20◦S, 85◦E to 90◦E). The temporal variations in the seasonal mean AOD during the 3 seasons discussed above (D1, D2, and SM) are presented in Fig. 7. A systematic variation in AOD by month is clearly seen in Fig. 7 over CA, SEAS and HBoB. Over Coastal Arabia max-imum AOD is observed in SM and minmax-imum in D1. Over the southeast Arabian Sea and Head Bay of Bengal maxi-mum AOD is observed during D2 and minimaxi-mum during SM. The maximum interannual variability is observed in SEAS during D2, when the seasonal mean AOD varies from 0.19 to 0.42, with the highest values during 1999. The interan-nual variability over SEAS is least during D1 when the AOD varies only between 0.16 and 0.22. During the summer mon-soon the interannual variability over SEAS is larger than that during the first half of the Asian dry season (D1) when the mean AOD varied from 0.12 to 0.27. The interannual vari-ability over the HBoB is also a maximum during D2 with seasonal mean AOD varying between 0.24 and 0.39. High-est values of AOD over HBoB are observed during D2 of 1999 and 2001. Its interannual variability over HBoB during D1 is very small, with values generally ranging from 0.20 to 0.27. Except for the very small values of 0.03 encountered in 1996 and 0.07 in 2001, the interannual variation in the mean AOD is very small during the summer monsoon season over this region. Over the Coastal Arabia, the largest interannual variability is observed during the Asian summer monsoon season (mean AOD ranges from 0.34 to 0.47) and the mini-mum variability during D1 (mean AOD ranging from 0.14 to 0.18). During D2 the interannual variability in AOD over CA is from 0.11 to 0.23. Another interesting feature observed in the interannual variations of AOD over CA is the long period oscillation (with period of around two years). This aspect however, requires a detailed study and hence is not discussed here. The interannual variability in AOD over SE-BoB is maximum during D1 with values ranging from 0.04 to 0.25. The peak over SEBoB is more prominent during D1 of 1997 followed by a secondary peak in D2 of 1998, which is
NOV95-JAN96
-20 -10 0 10 20FEB96-APR96
JUN96-SEP96
NOV96-JAN97
-20 -10 0 10 20FEB97-APR97
JUN97-SEP97
NOV97-JAN98
-20 -10 0 10 20FEB98-APR98
JUN98-SEP98
NOV98-JAN99
-20 -10 0 10 20 LATITUDE (DEG.)FEB99-APR99
JUN99-SEP99
MAR01-APR01
JUN01-SEP01
NOV01-JAN02
-20 -10 0 10 20FEB02-APR02
JUN02-SEP02
NOV02-JAN03
40 50 60 70 80 90 100 -20 -10 0 10 20FEB03-APR03
40 50 60 70 80 90 100 LONGITUDE (DEG.)JUN03-SEP03
40 50 60 70 80 90 1000.10
0.20
0.30
0.40
0.50
0.60
CLOUDSeasonal mean AOD (630 nm)
Fig. 6. Regional distribution of mean AOD for the three seasons; first half of the Asian dry season, D1 (November–January), second half of the Asian Dry season D2 (February–April), Asian summer monsoon season, SM (June–September) in different years during the study period.
mainly due to the high aerosol loading caused by the Indone-sian forest fires. The interannual variability in AOD over the SHIO is almost insignificant (ranges from 0.07 to 0.12), considering the associated uncertainties in the derived AOD values.
5 Discussion
Aerosol distribution and transport over the oceanic areas around the Indian subcontinent delineated in the earlier stud-ies, using the satellite and in-situ observations along with at-mospheric circulation obtained from models (Rajeev et al., 2000; Rasch et al., 2001; Verver et al., 2001; Leon et al., 2001; Li and Ramanathan, 2002; Tahnk and Coakley, 2002; Nair et al., 2003; Rajeev et al., 2004), have shown the in-fluence of the transport of aerosols from the Indian subconti-nent, southeast Asia and Arabia into the oceanic areas around the Indian subcontinent during the Asian dry period through the lower tropospheric northerly (northeasterly or northwest-erly) winds. However, in addition to atmospheric circula-tion, the altitude of the aerosol plume and the aerosol resi-dence time in the atmosphere determines the horizontal ex-tent of the transport of aerosols from their source regions. Furthermore, the surface wind speed controls the production of sea-salt aerosols (Erickson et al., 1986). The lidar obser-vations show that the aerosol abundance is observed below about 4 km in the Southeast Arabian Sea region throughout the year (Ansmann et al., 2000; Muller et al., 2001).
The influence of atmospheric circulation on the horizontal distribution of aerosols is clearly observable in Fig. 1, which shows the monthly mean wind vector at the 850-hpa level av-eraged for the 1996–2003 period obtained from the NCEP-NCAR reanalysis (Kalnay et al., 1996), along with the spatial distribution of AOD. The general features of the atmospheric circulation pattern during the same month are similar in the lower tropospheric levels. This is clear from the comparison of the circulation pattern shown in Fig. 1 with that of Fig. 8, which shows the mean circulation pattern during 1996–2003 at 925- and 700-hpa levels in November, February, June and September. However, at the higher altitudes the wind pat-tern shows deviations. The lower tropospheric wind in the Northern Hemisphere has a prominent northerly component directed away from the continent and towards the oceanic ar-eas during the November–April period. Over the Southern Hemisphere, the flow is dominantly easterly or southeast-erly, and meets with the flow from the Northern Hemisphere at the ITCZ. Throughout the year, the surface wind speed is greater than ∼6 ms−1in a latitude band with a width of about 10◦to 15◦ in the Southern Hemisphere, between 30◦S and 5◦S. The wind speed is highest in September (∼10 ms−1) and lowest between January–February (∼7 ms−1). However, the wind direction in this region is predominantly easterly throughout the year. The actual position of the highest wind speed region undergoes an annual variation, from ∼15◦S during July–August to ∼20◦S in February. The ITCZ po-sitioned south of the equator between 5◦S and 15◦S in the
Fig. 7. Variation of seasonal (D1, D2 and SM) mean AOD in dif-ferent years in five selected regions; Coastal Arabia (CA: 15◦N to 20◦N, 58◦E to 63◦E), Southeast Arabian Sea (SEAS: 7◦N to 12◦N, 70◦E to 75◦E), Head Bay of Bengal (HBoB: 15◦N to 20◦N, 85◦E to 90◦E), South East Bay of Bengal (SEBoB: 0◦N to 5◦N, 90◦E to 95◦E) and Southern Hemisphere Indian Ocean (SHIO: 15◦S to 20◦S, 85◦E to 90◦E).
65◦E to 80◦E longitude region (Nair et al., 2003) during the Asian dry period shifts to 20◦N to 25◦N during the sum-mer monsoon season. The highest annual variation in the wind (speed and direction) is observed in the Northern Hemi-sphere, particularly in the west Arabian Sea (near Somalia) and Bay of Bengal.
During the Asian dry season, the lower tropospheric wind has a dominating northerly component. Though the over-all wind speed is less, the residence time of aerosols in the atmosphere is expected to be larger (∼10 days) in the North-ern Hemisphere during the Asian dry season (Lelieveld et al., 2001), due to the large-scale dryness prevailing in the at-mosphere, aiding the transport of continental aerosols over to the Arabian Sea and Bay of Bengal (Nair et al., 2003). However, the area occupied by the high AOD region during the Asian dry period is significantly smaller than that during
(a)
(b)
Fig. 8. The monthly mean wind vectors for four representative months November, February, June and September, at the 925-hpa level (a) and the 700-hpa level (b), averaged for different years during the study period.
(a)
(a)
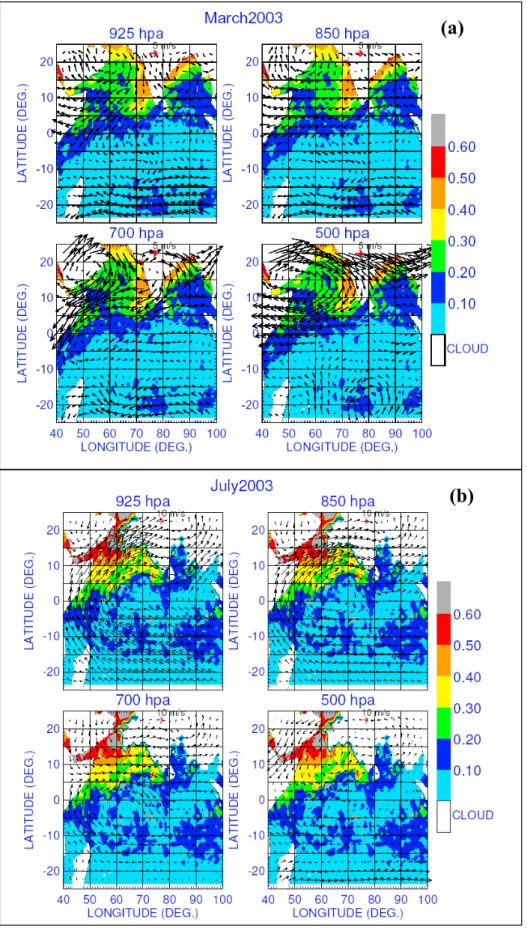
(b)
Fig. 9. Regional maps of mean AOD in March 2003, along with wind vector at different pressure levels (925 hpa , 850 hpa, 700 hpa and 500 hpa) in March 2003 (a) and in July 2003 (b).
the summer monsoon period and is mainly observed adja-cent to the continental areas in the Northern Hemisphere. The largest spatial gradients in AOD are observed over the southeast Arabian Sea sector during the Asian dry period (note the AOD distribution at Southeast Arabian Sea during February–April shown in Fig. 1 and Fig. 6) compared to the summer monsoon period. The AOD decreases away from the continent in the direction of the lower tropospheric wind in the southeast Arabian Sea. Similarly, near the Head Bay of Bengal a cyclonic circulation is observable in the wind field at the 925-hpa level and the AOD decreases away from the continent in the direction of the wind. Figure 9a shows the monthly mean AOD map of March 2003 along with the wind vectors at different pressure levels; 925, 850, 700, and 500 hpa, respectively, corresponding to approximately 0.8, 1.5, 3 and 5 km. As is seen in this figure the wind features at the 925 hpa level continues to persist up to around 700 hpa. Above this level they start departing significantly. The ob-served features in AOD would also have been influenced more by the aerosol loading in the lower troposphere, since the maximum contribution to the columnar AOD is from the altitudes below about 4 km (e.g. Ansmann et al., 2000). If we attribute advection of the continental layer for increased AOD, the maximum should occur where the wind converges and it should decrease in the direction of wind away from the convergence zone or in the direction of a divergence. Then from Fig. 9a we see that such a condition exists in the SEAS and HBoB sectors at altitudes ≤3 km.
It would be interesting to examine the possible sources of aerosols contributing to the AOD in the altitude region
≤3 km. For this the possible air-mass advections in the SEAS and HBoB during the Asian dry period are examined. Fig-ures 10a–d show the 7-day back trajectories ending at 12◦N, 70◦E over the SEAS at 4 different levels (0, 1.0, 2.0 and 4.0 km above the surface) for all days in March 2003, ob-tained from the NOAA–ARL – HYSPLIT transport disper-sion model (global reanalysis using archived CDC data set) (Draxler and Rolph, 2003; Rolph, 2003). The colors in each trajectory indicate the altitudes of the air parcel at each lo-cation along its path. Similarly, Figs. 10e–h show all the 7-day back trajectories ending at 18◦N, 90◦E over the HBoB at four altitudes 0,1,2 and 4 km. On examining the trajecto-ries near the surface over the SEAS region (Fig. 10a), most of the air parcels reaching here remain close to the surface and originate near the coastal regions of the north Arabian sea. In addition to this, for about 5–6 days in March 2003, air parcels originating from higher altitudes in the arid re-gion north of 20◦N sink near the coast and reach the obser-vation point. However, in almost all the cases, the trajecto-ries were lying below 700 m at the north Arabian sea and the ability of such trajectories to bring aerosols to the end loca-tion of SEAS is doubtful, since the aerosol residence time at
<1 km is expected to be less than 2–3 days. At 1 km there is also significant number of trajectories originating from the coastal regions of the northwest and northeast Arabian sea around 1 km, reaching the study region. A few trajectories originating from higher altitudes over the arid regions in the
northwest (Arabian regions) and from the east (crossing the south Peninsular India) also reach 1 km. Most of the trajec-tories reaching 2 km originate from the Indian subcontinent either from the same level or above. Considering the 4 km altitude, most of the trajectories reaching this point originate from higher altitudes of Arabia (>4 km) and often cross the eastern Arabian Sea and western parts of the Indian subcon-tinent before reaching SEAS. Figure 10 shows that for alti-tudes below ∼3 km most of the air parcels reaching this point originate from adjacent oceanic regions or near to the conti-nental regions of the Indian peninsula. The air trajectories reaching above this altitude originate from higher altitudes (>4 km) over the arid regions, which are expected to have smaller aerosol loading. Examining the wind field in Fig. 9a in lower altitudes there is a convergence in this region, and at altitudes above ∼1.5 km the AOD gradient in the plume is along the wind direction, up to ∼3 km (corresponding to
∼700 hpa). This pattern starts deviating at higher altitudes. Since the wind speeds near the surface are low the in-situ production of sea-salt aerosols is relatively small and hence most of the aerosols responsible for the observed high AOD over the SEAS during the Asian dry seasons would have been contributed by advection. These features indicate that the advecting aerosols from the Indian subcontinent and arid re-gions of Arabia would have significantly contributed to the observed aerosol plume near the west coast of the Indian Peninsula. It may also be noted in this context that the above analysis pertaining to March 2003 corresponds to an average feature for the Asian dry period and it repeats every year. But the AOD in this region was abnormally high in March 1999, which was due to anomalous behavior in the mean circulation pattern. Nair et al. (2003) studied this enhanced aerosol load-ing over the oceanic areas around the Indian subcontinent during the February–April period of 1999 in detail. Among the various possibilities they considered, the most probable causes for the enhanced AOD observed during 1999 were the enhanced urban air-mass flux from the Indian subconti-nent through the lower troposphere into the Arabian Sea and the northern parts of Bay of Bengal and the northward posi-tion of the extended anti-cyclonic circulaposi-tion over the Indian subcontinent (from ∼15◦N during April 1997 and 1998 to
∼18◦N during April 1999). The northward position of ITCZ (from ∼10◦S during April 1997 and 1998 to ∼7◦S during April 1999) and the elevated aerosol layer might also have contributed to the enhanced AOD in 1999 (Nair et al., 2003). On examining the region of high AOD at Head Bay of Bengal, the wind directions in Fig. 9a indicates that most of the aerosol loading responsible for the observed high would have come from the altitude ≤3 km. Seven-day back trajecto-ries in Figs. 10e to 10h indicate that near the surface, signifi-cant aerosol transport occurs from the Gangetic plane, which is a region of high AOD during the Asian dry period as re-vealed from MODIS data (Ramanathan et al., 2001b). It may also be noted that the length of the trajectories at this level (Fig. 10e) is significantly small, which indicates a rather slow feeding of aerosol-laden air from the Indian subcontinent. At 1 km aerosol laden arid air from higher altitudes also
1
Figure 10: Seven-day back trajecto
ries ending at 12° N, 70° E over
the southeast Arab
ian Sea s ecto r at 4 different levels (0, 1 .0, 2.0 and 4.0 (a) (c) (d) (g) (h) (f) (e) (i) (b) (k ) (l) (j) Fig . 10. Se v en-day bac k tra jector ies ending at 1 2 ◦N, 70 ◦E o v er the southe ast A rabia n Se a sec tor at 4 dif fer ent le v els (0, 1.0, 2.0 and 4.0 k m abo v e th e surf ace) for all day s in Marc h 20 03 (a –d) , at H ead B ay o f Ben g al sector (18 ◦N; 9 0 ◦E ) (e–h ), and in July 2003 at the N orth Ara bian S ea sec tor (1 5 ◦N and 60 ◦E) (i–l ).
contributes to the observed aerosol burden, which includes the turbid regions over Nepal as well (Ramana et al., 2004). At 2 and 4 km, the back trajectories are significantly long (indicating long range transport), originating from higher al-titudes (>4 km) of arid regions of west Arabia, as well as the same altitudes over central Arabia. The air trajectories over BoB also indicate significant transport from the South-east Asian region. A small region of high AOD observed in the east Bay of Bengal around 15◦N (Fig. 1) has been particularly investigated by examining the air trajectories in different months. This high AOD off the Myanmar coast is observed to be mainly due to transport of continental air from Southeast Asia, as well as from Central India and Bangladesh along the east coast of the Bay. This transport is predomi-nantly seen during the Asian dry season, when the AOD in this region is highest. During the monsoon period, as most of the air trajectories reaching this point originate from the oceanic region in the west, this feature is not prominent (in Fig. 1).
During the Asian summer monsoon period, wind in the lower troposphere is southwesterly over the Western Arabian Sea. The wind speeds at 850 hpa usually exceeds ∼10 ms−1 during June–September. The highest wind speeds exceeding 15 ms−1are observed during July in the geographical region between 5◦N to 15◦N at 50◦E to 60◦E (Somalia jet) longi-tude. The Somalia jet wind speed increases from ∼15 ms−1 in June to more than 20 ms−1 in July, and decreases subse-quently to ∼15 ms−1in August and ∼10 ms−1in September. Such wind speeds correspond to an eastward airmass trans-port of about 850 to 1700 km per day and hence the travel time of an air parcel from the western border of the Ara-bian Sea to the west coast of India will be about 2 to 4 days. This atmospheric circulation leads to the transport of large amount of aerosols from the dust-laden areas of Arabia and is one of the main reasons for the very high AOD values ob-served during the summer monsoon season over the Arabian Sea. Note that the westerly wind speed increases from June to July over the west Arabian Sea. Associated with this, the absolute value of the AOD over the Arabian Sea, as well as the area covered by the large aerosol plume, increase from June to July. The westerly wind speed slightly decreases in August, leading to an overall decrease in AOD over the Ara-bian Sea. The westerly winds over the west AraAra-bian Sea fur-ther weakens during September, which is clearly associated with a decrease in the observed AOD over the Arabian Sea, as seen in Fig. 1.
The prominent feature observed during the summer mon-soon period is the high AOD over the Arabian Sea sector, especially near 15◦N latitude. This feature, which is well pronounced in July, is further examined in light of prevail-ing circulation. As seen from Fig. 1, the prominent feature in the wind is the strong southwesterlies over the west Ara-bian Sea north of the equator up to ∼18◦N. Near the con-tinent the wind is mostly westerly or northwesterly. This feature becomes more pronounced at higher altitudes. In order to examine the association of AOD distribution and circulation, the AOD and wind pattern in the month of July
(typically July 2003) is examined in detail. Figure 9b shows the regional distribution of AOD in July 2003, along with a wind field at four typical pressure levels, 925, 850, 700 and 500 hpa, which correspond to approximately 0.8,1.5,3 and 5 km altitudes, respectively. The slow change in the wind pattern with height is observable in Fig. 9b. From this figure it can be seen that the wind pattern favorable for the trans-port of dust aerosols from Arabia occurs around the 850-to 700-hpa level (i.e. between 1.5 and 3.0 km) during the sum-mer monsoon season. Below this region the wind pattern (southerly winds) is not conducive for the observed AOD pattern. Thus, the observed high in AOD would have been significantly contributed by the increased aerosol loading in the altitude region 1.5 to 3 km. We have also examined the 7-day air back trajectories ending at 15◦N, 70◦E at 4 different levels (0, 1.0, 2.0 and 4.0 km above the surface) for all days in July 2003 obtained from the NOAA–ARL–HYSPLIT model. These are presented in Figs. 10i–l. The colors in each trajec-tory indicate the altitudes of the air parcel at each location along its path. Figure 10i shows that near the surface all tra-jectories are confined to near-surface and originate from the Southern Hemispheric oceanic region. The situation is more or less the same for 1 km altitude as well (Fig. 10j), except for the fact that a few trajectories from western landmasses are also being added to the cluster. The back trajectories in Fig. 10k show advection of the boundary layer aerosols (0 to 1.5 km) emanating from the arid west Asian regions (deserts), ascending to ∼2 km at 15◦N. The air trajectories at 3 km (not shown here) also mostly originate from lower altitudes over the western arid continents. This shows ad-vection of lower tropospheric (particularly with altitude ∼1– 2 km) air from the Arabian desert region and northwest of the Indian subcontinent (including Pakistan and Afghanistan). Combining features from Figs. 9 and 10, it can be inferred that the high AOD observed in this region would have been contributed by transport of mineral dust from the adjacent arid Arabian region. However, as wind speeds are large near the surface there would be a significant contribution of sea-salt aerosols through in-situ production, as well as by advec-tion from southern oceanic region.
The easterly winds from Southeast Asia also transport sig-nificant amounts of aerosols from the Southeast Asian re-gion over to the Bay of Bengal. This transport is largest during January–April. However, during the El Ni˜no years, the intense forest fires in the Indonesian region caused large transport of smoke into the equatorial Indian Ocean that was largely aided by the reversal of winds into strong easterlies in the eastern equatorial Indian Ocean during the El Ni˜no years, compared to the westerlies in this region during the normal/La Ni˜na years (Nakajima et al., 1999; Parameswaran et al., 2004). This is the reason for the high AOD values in the eastern equatorial Indian Ocean during the September– November period of 1997, as seen Fig. 6.
In addition to the transport of aerosols from the continen-tal areas, the sea-salt produced by the surface wind also con-tributes to the observed AOD over the oceanic areas. This is significant in the regions of high wind speed, such as
the Southern Hemispheric Indian Ocean between 10◦S and 20◦S throughout the year, and the Arabian Sea during the summer monsoon season. Several models are available in the literature on the dependence of sea-salt concentration with wind speed (e.g. Erickson et al., 1986; Gong et al., 1997), and most of them predict an exponential relationship be-tween the sea-salt concentration and the near-surface wind speed. However, significant differences exist between differ-ent models as far as the coefficidiffer-ents relating the wind speed and the sea-salt aerosol concentration are concerned. This as-pect may be kept in mind while calculating the sea-salt con-tribution to AOD and interpreting the results. Our aim here is mainly to identify the regions and periods when the sea-salt contribution is significant, and have an estimation of the sea-salt contribution to AOD for inferring the non-sea-salt contribution to the observed AOD. Based on the relationship proposed by Erickson et al. (1986), the sea-salt contribution to the AOD (τss) can be expressed as an exponential func-tion of near-surface wind speed, U , in ms−1of the form τss =τss0e0.16U, where τss0is the optical depth due to sea-salt
aerosols at U =0 ms−1. The value of τss0 is taken as 0.02,
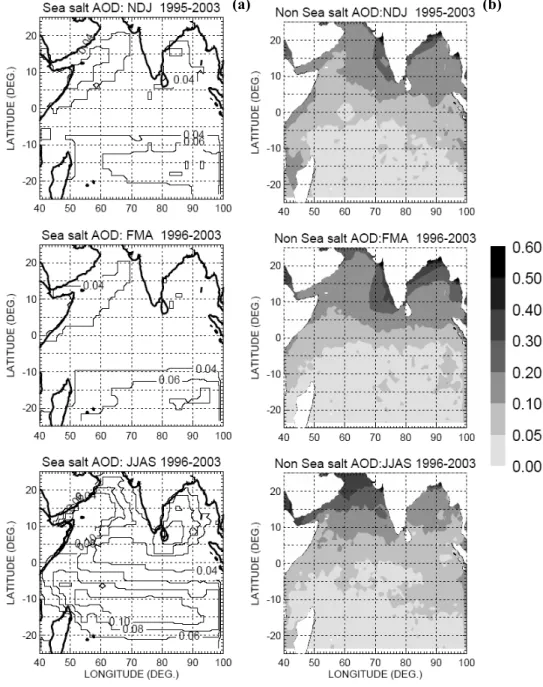
which is the minimum AOD observed over the oceanic areas in the present study. The values of U are taken from the sur-face wind data obtained from the NCEP-NCAR reanalysis (Kalnay et al., 1996). Figure 11a shows the seasonal mean contour maps of the estimated sea-salt contribution to AOD (τss) during 1996–2003.
The estimated values of τssare ≤0.04 over the Northern Hemispheric oceanic regions during the Asian dry season (November–January and February –April). However, the es-timated value of τssduring the Asian summer monsoon sea-son is greater than 0.08 over a wide region, over the western Arabian Sea and exceeds 0.10 in the region of the Somalia Jet. The value of τss during the summer monsoon is ≤0.06 over the Bay of Bengal. In most of the regions over the Southern Hemisphere Indian Ocean, τssis >0.06 throughout the year and is greater than 0.08 around 15◦S–20◦S in the central and eastern Indian Ocean during November–January and June–September periods. The minimum value of τss in the SHIO is observed during the February–April period.
The non-sea-salt contribution (τnss) to the observed AOD is inferred by subtracting the estimated values of τssfrom the observed AOD. The seasonal mean maps of the inferred τnss during the November– January, February–April and June– September periods averaged for 1996–2003 are shown in Fig. 11b. In the Northern Hemisphere, during the Asian dry period the value of τnss is considerably larger than that of
τss. Similar to the total AOD, values of τnss are also higher in the southeast Arabian Sea and North Bay of Bengal dur-ing the Asian dry period in general and durdur-ing the February– April period in particular. Even though very high values of AOD observed over the Arabian Sea during the summer monsoon are significantly contributed by the non-sea-salt aerosols (∼0.3), the contribution from sea-salt (∼0.1) is not negligible. Over the Bay of Bengal, τssis more than ∼30% of τnssduring the summer monsoon season. Over the South-ern Hemisphere Indian Ocean, τnss accounts for about half
of the observed AOD, and the zones of highest AOD in this region coincides with the zones where τss is also the high-est, except in the western equatorial Indian Ocean near In-donesia, which was significantly influenced by the forest fire related smoke plume during September–November of 1997.
6 Conclusions
The monthly and seasonal mean regional aerosol distribu-tions over the Arabian Sea, Bay of Bengal, and the Indian Ocean during the seven-year period of November 1995– December 2003 (with a break in year 2000) are studied using the AOD derived from NOAA-14 and NOAA-16 AVHRR data. The main objectives of this study are (a) to assess the interannual variability in the regional AOD distribution, and (b) to provide a longer-term average of regional mean AOD distribution (compared to the existing 3–4 year averages re-ported in the literature), so that biases in the regional mean AODs, where the interannual variability in AOD is high, can be minimized. Probable altitude regions and pathways of continental aerosol transport are studied, and the contribu-tion of the sea-salt AOD to the observed AOD is estimated. The main conclusions are:
1. The geographical pattern of the regional aerosol distri-bution is remarkably consistent from year to year over most of the areas in the Arabian Sea, Bay of Bengal and Indian Ocean. The major difference in this pattern oc-curs in the eastern equatorial Indian Ocean during the periods of the intense El Ni˜no years, which are associ-ated with intense forest fires in Indonesia.
2. The annual variation in AOD is largest in coastal Ara-bia and least in the Southern Hemisphere Indian Ocean. The regional mean AOD over the Arabian Sea, Bay of Bengal, and Indian Ocean also undergoes system-atic annual variation. In the Arabian Sea highest value of AOD (∼0.34) is encountered in July and the lowest value (∼0.17) in November. In the Bay of Bengal re-gion, the highest value (∼0.26) is observed in March and the lowest value (∼0.12) in August–September. 3. The AOD over the Southern Hemisphere Indian Ocean
is significantly low; the maximum regional mean AOD in this region is ∼0.13, occurring in October and the minimum AOD of ∼0.07 occurs during January to May. 4. A large latitude gradient in AOD is observed in the re-gion north of equator. Highest latitude gradients are ob-served in July over the Arabian Sea in the 40◦E to 70◦E longitude sector and in March over Bay of Bengal in the 90◦E to 100◦E longitude sector. The minimum latitude gradient is observed in October at both longitude sec-tors. The mean latitude gradient for the entire region 20◦S to 20◦N in the entire longitude sector (40◦E to 100◦E) considered in the present study is a minimum in September/October.
(a) (b)
Fig. 11. Contour maps of estimated sea-salt component of AOD (τss) during November–January, February–April and June–September
period of 1995–2003 (a) and contour maps of inferred non-sea-salt component of AOD (τnss) during the same period (b).
5. The absolute values of the seasonal mean AOD un-dergoes considerable interannual variations over the Northern Hemisphere. Over the Northern Hemisphere oceanic region, the interannual variability is the least during the first half of the Asian dry season (November– January period). The largest interannual variability (∼50%) is observed during the second half of the Asian dry period (February–April) over the southeastern Ara-bian Sea and North Bay of Bengal. The interannual variability in these two regions during the summer mon-soon season and in most of the other regions for all sea-sons are less than 30%. interannual variability is the
least in the Southern Hemispheric Indian Ocean for all seasons.
6. Large values of AOD observed over the Arabian Sea during the summer monsoon season are mainly due to the transport of mineral dust from the Arabian Desert. The sea-salt contribution to AOD, due to high surface wind, is also highest in the summer monsoon season over the western Arabian Sea (near the Somalia Jet re-gion, it is ≥0.1). During the Asian dry season, over the Arabian Sea and Bay of Bengal the sea-salt contribu-tion to the observed AOD is significantly less than the non-sea-salt contribution.