HAL Id: hal-00298880
https://hal.archives-ouvertes.fr/hal-00298880
Submitted on 11 Sep 2007HAL is a multi-disciplinary open access
archive for the deposit and dissemination of sci-entific research documents, whether they are pub-lished or not. The documents may come from teaching and research institutions in France or abroad, or from public or private research centers.
L’archive ouverte pluridisciplinaire HAL, est destinée au dépôt et à la diffusion de documents scientifiques de niveau recherche, publiés ou non, émanant des établissements d’enseignement et de recherche français ou étrangers, des laboratoires publics ou privés.
Recovery from episodic acidification delayed by drought
and high sea salt deposition
H. Laudon
To cite this version:
H. Laudon. Recovery from episodic acidification delayed by drought and high sea salt deposition. Hydrology and Earth System Sciences Discussions, European Geosciences Union, 2007, 4 (5), pp.2975-2996. �hal-00298880�
HESSD
4, 2975–2996, 2007 Recovery from episodic acidification H. Laudon Title Page Abstract Introduction Conclusions References Tables Figures ◭ ◮ ◭ ◮ Back Close Full Screen / EscPrinter-friendly Version Interactive Discussion
EGU
Hydrol. Earth Syst. Sci. Discuss., 4, 2975–2996, 2007 www.hydrol-earth-syst-sci-discuss.net/4/2975/2007/ © Author(s) 2007. This work is licensed
under a Creative Commons License.
Hydrology and Earth System Sciences Discussions
Papers published in Hydrology and Earth System Sciences Discussions are under open-access review for the journal Hydrology and Earth System Sciences
Recovery from episodic acidification
delayed by drought and high sea salt
deposition
H. Laudon
Department of Ecology and Environmental Sciences, Ume ˚a University, 901 87 Ume ˚a, Sweden Received: 31 October 2006 – Accepted: 5 February 2007 – Published: 11 September 2007 Correspondence to: H. Laudon ([email protected])
HESSD
4, 2975–2996, 2007 Recovery from episodic acidification H. Laudon Title Page Abstract Introduction Conclusions References Tables Figures ◭ ◮ ◭ ◮ Back Close Full Screen / EscPrinter-friendly Version Interactive Discussion
EGU
Abstract
For the prediction of episodic acidification large uncertainties are connected to climatic variability and its effect on drought conditions and sea-salt episodes. In this study data on 342 hydrological episodes in 25 Swedish streams, sampled over 10 years, have been analyzed using a recently developed episode model. The results demon-5
strate that drought is the most important factor modulating the magnitude of the an-thropogenic influence on pH and ANC during episodes. These modulating effects are especially pronounced in southern and central Sweden, where the historically high acid deposition has resulted in significant S pools in catchment soils. The results also suggest that the effects of episodic acidification are becoming less severe in many 10
streams, but this amelioration is less clear in coastal streams subject to high levels of sea-salt deposition. Concurrently with the amelioration of the effects of episodic acidification, regional climate models predict that temperatures will increase in Swe-den during the coming decades, accompanied by reductions in summer precipitation and more frequent storms during fall and winter in large areas of the country. If these 15
predictions are realized delays in streams’ recovery from episodic acidification events can be expected.
1 Introduction
A steady but slow recovery from acidification is occurring in many surface waters in Eu-rope and North America due to reduction in anthropogenic acid deposition (Skjelkv ˚ale 20
et al., 2001; Stoddard et al., 1999). These findings have been based on assessments that have focused mainly on changes in annual mean values of pH and Acid Neutral-ization Capacity (ANC). Although the documented improvements are important, the ecological significance of these trends has been difficult to assess in many places be-cause the aquatic biodiversity is as much or more affected by transient declines in pH 25
HESSD
4, 2975–2996, 2007 Recovery from episodic acidification H. Laudon Title Page Abstract Introduction Conclusions References Tables Figures ◭ ◮ ◭ ◮ Back Close Full Screen / EscPrinter-friendly Version Interactive Discussion
EGU
stream water chemistry (Baker et al., 1996; Kowalik and Ormerod, 2006; Lepori et al., 2003). While surface waters in Europe and North America are recovering from chronic acidification (Raddum et al., 2001; Yan et al., 2004), severe episodic acidification may continue to threaten sensitive biota in many regions.
Although much work has focused on identifying the causes and effects of episodic 5
acidification in recent decades, the role of confounding factors is less well understood. In order to predict the effects of future transient acidification events some of the most important uncertainties that need to be addressed are those mediated by drought and sea-salt episodes, which may in turn be strongly affected by climatic change. Summer droughts in humid glaciated regions are known to lower the water table of wetlands, 10
thereby causing conditions suitable for the re-oxidation of previously reduced com-pounds. In areas with historically high levels of acid deposition, hydrological events following these dry periods can result in pulses of acidic, SO2−4 -rich water entering streams (Christophersen et al., 1983; Devito et al., 1999; Eimers et al., 2004a). Sea-salt episodes occur due to cation exchange processes in the soil, mainly involving 15
exchange of Na+ with acidifying H+ and Al-cations, while Cl− acts as a mobile anion
and passes through the soil relatively unaltered (Heath et al., 1992; Neal and Kirchner, 2000). Sea-salt deposition associated with severe storm conditions therefore can tran-siently increase the acidification effects by mobilizing acid cations that are subsequently transported to streams. Predictions of climate-change effects in Europe suggest that 20
future conditions will be drier in some regions, and storm frequencies will increase in others (Kjellstr ¨om, 2004). Thus, anticipated climatic changes may have significant ef-fects on sea-salt episodes, drought conditions, and associated responses of stream water chemistry, but the magnitude of these likely effects, and their interactions with the ongoing decline in the effects of anthropogenic acidification, warrants further inves-25
tigation.
Because of the stochastic and transient nature of episodic acidification events, they have not received the same attention as chronic acidification. With a few exceptions (Laudon et al., 2002; Laudon and Hemond, 2002; Lawrence, 2002) long-term
assess-HESSD
4, 2975–2996, 2007 Recovery from episodic acidification H. Laudon Title Page Abstract Introduction Conclusions References Tables Figures ◭ ◮ ◭ ◮ Back Close Full Screen / EscPrinter-friendly Version Interactive Discussion
EGU
ments of episodic stream water chemistry trends have been constrained by data avail-ability. Most previous work on episodic acidification has focused on short-term time series lasting only a few years (Wigington et al., 1996). Therefore it has often been difficult to assess whether the long-term decline in acid depositions has resulted solely in improvements in annual average values, or whether it has also ameliorated the ef-5
fects of episodic acidification. The lack of long-term studies also makes it difficult to discern if temporal changes observed in the intensity of episodic pH and ANC declines are caused by inherent variability in the episodic responses, changes in rates of acid deposition or natural climatic variability.
The objective of this study was to assess whether the long-term decline in acid depo-10
sition has ameliorated the effects of episodic acidification in a number of small streams in Sweden monitored over 10 years. In total, data related to 342 hydrological episodes from 25 streams have been analyzed in an attempt to separate the responses to anthro-pogenic acidification in surface water chemistry from natural variability during summer and fall episodes using the Boreal Dilution Model (BDM; Bishop et al., 2000; Laudon 15
et al., 2001).
2 Study region and data
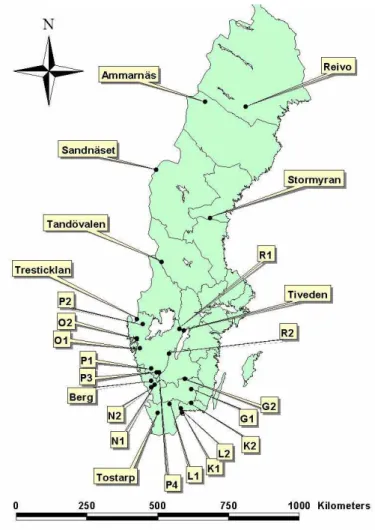
The data analyzed in the study consist of measurements acquired during the course of 342 hydrological episodes in 25 Swedish streams (Fig. 1; Table 1). The catchments of these streams are located along a climate and deposition gradient, across which mean 20
annual temperatures and precipitation vary from +7 and >1000 mm, respectively, in the southern parts of the country, to –3◦C and 600 mm in the northern parts of the
country. Of the 25 streams, 16 are located in southern Sweden, four in central Swe-den and five in northern SweSwe-den. The separation of the catchments into regions is based on both geography and acid deposition history. Open-field rates of deposition of 25
sulfur and nitrogen compounds in Sweden ranged from 2 to 15 kg S ha−1 year−1 and
HESSD
4, 2975–2996, 2007 Recovery from episodic acidification H. Laudon Title Page Abstract Introduction Conclusions References Tables Figures ◭ ◮ ◭ ◮ Back Close Full Screen / EscPrinter-friendly Version Interactive Discussion
EGU
decreasing from both west to east and from south to north. Hence, the highest deposi-tion loads of acidifying compounds occurred in southern Sweden (>7 kg S ha−1year−1)
followed by central Sweden (3–5 kg S a−1 year−1) and northern Sweden (<3 kg S ha−1
year−1) (Table 1). Sulfur deposition has been decreasing at a steady rate since 1970
(Mylona, 1996), while nitrogen deposition has remained constant since the beginning 5
of the 1990’s (Warfvinge and Bertills, 2000).
The streams, all drain forested catchments varying from 2 to 1090 ha in size, and have been included in two national sampling programs: the PMK network program funded by the Swedish EPA, and the Skokal network program funded by the Swedish Forest Agency. No major forestry activities have been undertaken in any of the catch-10
ments in recent decades (Folster and Wilander, 2002).
All the streams have been sampled weekly to monthly, with varying sampling fre-quency over time. The samples obtained have been analyzed at the Department of Environmental Assessment, Swedish University of Agricultural Sciences, Sweden. All streams have been sampled during at least a 10-year period, starting between 1985 15
and 1990. Rather than analyzing the same time period for all streams, the time series were kept as long as possible to enable trend assessments of episodic acidification in the individual streams. Chemical analyses were performed by certified laboratories according to EN or ISO standards where applicable (Wilander et al., 1998). Un-aerated samples were used for the pH measurements, immediately after sampling. Analyses of 20
Ca, Mg, Na and K were measured using inductively coupled plasma-optical emission spectrometry (ICP–OES), while Cl− and SO2−
4 were measured using ion
chromatogra-phy. NO3 was analyzed using the cadmium reduction method with a segmented flow analyzer.
3 Data analysis
25
An episode is defined here as a 10-fold (or more) increase in discharge rate. Thus, the definition is based entirely on hydrology. Each hydrological episode was analyzed
HESSD
4, 2975–2996, 2007 Recovery from episodic acidification H. Laudon Title Page Abstract Introduction Conclusions References Tables Figures ◭ ◮ ◭ ◮ Back Close Full Screen / EscPrinter-friendly Version Interactive Discussion
EGU
using the Boreal Dilution Model (BDM; (Bishop et al., 2000; Laudon et al., 2001). This model has been used to quantitatively distinguish between natural and anthropogenic mechanisms underlying episodic declines of acid neutralising capacity (ANC) during both snow melt-driven hydrological episodes (Laudon and Hemond, 2002) and rain-driven episodes (Laudon and Bishop, 2002) in northern Sweden and during rain events 5
in Canada (Laudon et al., 2002; Laudon et al., 2004). The BDM identifies the anthro-pogenic component of episodic ANC decline (∆ANC(poll)) from relative differences in
the runoff dynamics of base cations and anthropogenic acid anions during hydrological events.
The BDM is based on the concept that the natural, pre-industrial acid-base chemistry 10
dynamics during episodes result primarily from dilution of the buffering capacity by low ionic strength precipitation (Bishop et al., 2000). The BDM is driven by the observed ANC (ANC(obs,t)) at any time “t” during the flow event (Eq. 1) and a dilution index (DI(t); Eq. 2), which is an estimate of the natural dilution of both BC and the anthropogenically significant anions of strong mineral acids (ANSA = (SO2−4 ) + (NO−
3)). The sum of
15
base cations (BC = (Ca2+) + (Mg2+) + (Na+) + (K+)) is used in the determination of the DI (Eq. 2). The natural, pre-industrial ANC (ANC(preind,t)) is calculated from the dilution of baseflow ANC (ANC(base), Eq. 3). The difference between ANC(preind,t)
and the observed ANC(obs,t) represents the human influence on the ANC (∆ANC(poll,t),
Eq. 4) during the episode. All concentrations are inµeq L−1of charge.
20
ANC(obs,t) = (Ca2+)(t)+ (Mg2+)(t)+ (Na2+)(t)+ (K+)(t)− (SO2−4 )(t)− (NO−3)(t)− (Cl−)(t)
= BC(t)− ANSA(t)− (Cl−)(t) (1)
DI(t)= BC(t)/BC(base) (2)
ANC(preind,t) = DI(t)∗ (BC(base)− ANSA(base)) − (Cl−)(t) (3)
∆ANC(poll,t) = ANC(preind,t)− ANC(obs,t) (4)
HESSD
4, 2975–2996, 2007 Recovery from episodic acidification H. Laudon Title Page Abstract Introduction Conclusions References Tables Figures ◭ ◮ ◭ ◮ Back Close Full Screen / EscPrinter-friendly Version Interactive Discussion
EGU
Organic acidity is not included in the ANC calculation as DOC has not been analyzed during the entire sampling period used in this study. The exclusion of the strong or-ganic acid component from the ANC expression is the common procedure in interna-tional negotiation work in Europe (Posch et al., 1997). Furthermore, as the analyses of ∆ANC(poll,t) is based on the relative difference between ANC(preind,t)and ANC(obs,t)
5
(Eq. 4) this simplification should not bias the results.
The assumptions and sensitivity of the model have been tested by Bishop, et al. (2000) and Laudon, et al. (2001). Since the purpose of modeling in this study was limited to determining the changes in ∆ANC(poll,t) during runoff episodes, it was
not necessary to satisfy all of the assumptions made when modeling natural pH de-10
clines in the original BDM (Bishop et al., 2000). However, one assumption that must be fulfilled in this use of BDM is that the sum of base cations can be used as a surrogate for the natural dilution of ANC, as discussed in more detail by Laudon et al. (2001).
Trends in the anthropogenic component of episodic ANC declines were analysed using the non-parametric Kendall tau (Systat version 14) to identify monotonic long-15
term trends (Yue et al., 2002). The significance level of the statistical analyses was set to be significant when the p-value was<0.05.
4 Results
In total 342 episodes were identified using the hydrological definition of a 10-fold in-crease in discharge from baseflow to peak flow. The number of identified episodes 20
affecting each stream varied between ten and 28. Of the 25 sampled streams, ten displayed a decreasing trend in ∆ANC(poll) (p<0.05) over the study period (Table 1),
hereafter termed “recovering” streams. Nine of these ten recovering streams are lo-cated in southern Sweden and one in central Sweden; no stream in northern Swe-den showed a decreasing trend. Of the recovering streams in southern SweSwe-den most 25
were located relatively far from the Atlantic coast. The mean annual Cl− stream water
signifi-HESSD
4, 2975–2996, 2007 Recovery from episodic acidification H. Laudon Title Page Abstract Introduction Conclusions References Tables Figures ◭ ◮ ◭ ◮ Back Close Full Screen / EscPrinter-friendly Version Interactive Discussion
EGU
cantly lower (p<0.01; one way ANOVA) than in the non-recovering streams (average
271µeq L−1; standard deviation 43µeq L−1Table 2, Fig. 2). No correlation (p>0.1; one
way ANOVA) was found between recovering streams and any other stream chemical parameter tested including all other major an- and base cations. Furthermore, no cor-relations (p>0.1; one way ANOVA) were found between the recovering streams and
5
either sulfur or nitrogen deposition in any of the regions.
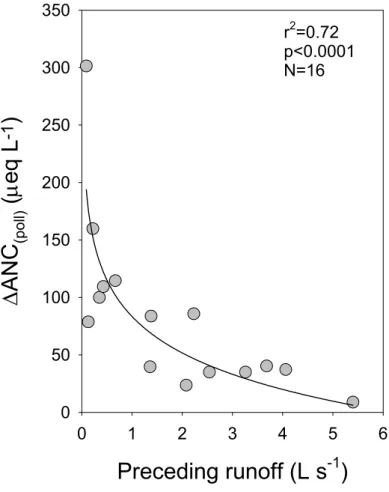
Most streams displayed a clear relationship between episodic response and an-tecedent runoff (Fig. 3). In southern Sweden ∆ANC(poll)was logarithmically correlated
(p<0.05) to antecedent discharge in 11 of the 16 studied streams (Table 1). The lowest
antecedent discharge resulted in ANC declines of over 500µeq L−1in some instances
10
driven mainly by increases in SO2−4 concentration. In central Sweden all of the stud-ied streams showed a significant relationship, but the two variables were significantly correlated for only one of the five studied streams in northern Sweden. In all streams SO2−4 was the most important driving variable for changes in ∆ANC(poll)although both
BC dilution and NO−
3 influenced the ANC decline during occasional episodes. The role
15
of SO2−4 concentration driving the ANC decline was especially prominent when drought conditions where preceding the episode. At wetter conditions BC dilution played a larger role in depressing ANC, whereas NO−
3 showed a more stochastic influence on
the ANC decline during episodes.
5 Discussion
20
Generally most surface waters in Sweden have shown a significant decline in stream water SO2−4 concentrations, associated with the long-term decline in anthropogenic acid deposition, during the last decades (F ¨olster et al., 2003; F ¨olster and Wilander, 2002). However, these reductions in stream water SO2−4 concentrations are often off-set during high runoff by pulses of SO2−4 from episodically activated flow pathways. 25
preced-HESSD
4, 2975–2996, 2007 Recovery from episodic acidification H. Laudon Title Page Abstract Introduction Conclusions References Tables Figures ◭ ◮ ◭ ◮ Back Close Full Screen / EscPrinter-friendly Version Interactive Discussion
EGU
ing drought conditions, which cause transient increases in anthropogenically derived H+ and labile inorganic aluminum (Ali) concentrations, with associated effects on the stream water ANC and pH.
Deposition of marine base cations can cause transient sea-salt related acidification episodes (Heath et al., 1992). Such episodes have been reported to cause severe fish 5
kills in coastal rivers (Hindar et al., 1994). The clear difference in recovery of ∆ANC(poll)
found in this study between inland and coastal streams (with low Cl− and high Cl−
concentrations, respectively) in southern Sweden indicates that sea-salt deposition has an influence not only on the effects of individual episodes, but also on the cumulative effects of episodic acidification in the longer-term. Sea-salt deposition is generally 10
regarded as being highly stochastic, primarily occurring in short, intense events that cause transient, episodic declines in both and pH and ANC. However, the deposition of marine ions in coastal sites can also be described as a continuum of high sea-salt deposition that continuously affect soil and stream water chemistry in some regions (Evans et al., 2001). This suggests that sea-salt does not solely have transient, short-15
term influences, but could also have more long-term effects on surface water chemistry due to the continuous addition of marine base cations in some coastal regions.
The main influence of sea-salt on stream water ANC is due to the exchange of ma-rine base cations, primarily sodium (Na+), with adsorbed acid cations, hydrogen (H+) and labile inorganic aluminum (Ali), in the soil. Hence, continuous low doses of marine 20
base cations, spiked with occasional high doses, could retard the episodic recovery. Sea-salt induced hydrochemical episodes have also been linked to decadal cycles of storm intensities driven by the North Atlantic Oscillation (NAO) (Hindar et al., 2004). This pattern of short-term variability in sea-salt deposition superimposed on more long-term cycles makes it difficult to disentangle trends in episodic response from natural 25
variability. Indeed, the strong but intermittent marine influence in many coastal regions could explain why coastal catchments with relatively high stream water Cl−
concentra-tions are not recovering to the same degree as streams further inland.
HESSD
4, 2975–2996, 2007 Recovery from episodic acidification H. Laudon Title Page Abstract Introduction Conclusions References Tables Figures ◭ ◮ ◭ ◮ Back Close Full Screen / EscPrinter-friendly Version Interactive Discussion
EGU
may be considered a surrogate for soil wetness) suggests that re-oxidation of sul-fur in catchment soils is an important factor affecting hydrochemical responses dur-ing episodes. Reports from acidified regions in both Europe and North America have shown that re-oxidation of previously water-logged organic soil leads to pulses of acidic, SO2−4 -rich water that may have a dramatic influence on stream ANC and pH during 5
episodes (Schiff et al., 2005; Laudon et al., 2004). The strong correlation between ∆ANC(poll) and antecedent discharge found for most of the streams included in this
study also suggests that the largest anthropogenic component of the episodic acidifi-cation is associated with preceding drought conditions. These results have important implications for predictions of acidification recovery in the future, especially in regions 10
where climate scenarios forecast that conditions are likely to become warmer and drier. The rapid release of sulfate associated with drought is clearly not primarily caused by the most recent deposition of atmospheric sulfur. Recent trend analyses in Canada have demonstrated that long-term or multi-season drought-induced SO4 mobilization retards general recovery from acidification (Eimers et al., 2004b; Jeffries et al., 2002). 15
Hence, a possible explanation for the strong correlation between low antecedent runoff and the anthropogenically driven ∆ANC(poll) found in this study is that a temporary
lowering of the ground water level can result in a transformation of immobile sulfides to readily mobile sulfates that can be washed out during subsequent hydrological episodes. In support of this hypothesis, it has been found that mineralization of or-20
ganic sulfur compounds in organic soils can be an important mechanism in generating sulfate-rich pulses which, temporarily at least, transform some catchments from sinks to sources of stream water sulfate (Alewell et al., 1999). In a recent study by Laudon et al. (2004) in central Canada the areal coverage of wetlands also showed to be a good predictor of the size of the anthropogenic acidity pulse following drought. However, 25
no information of the amount of organic soils or wetland coverage is available for the streams reported on here.
In many of the streams included in this study, especially those in the inland sites, the negative effects of episodic acidification events on ANC are correlated with stream
HESSD
4, 2975–2996, 2007 Recovery from episodic acidification H. Laudon Title Page Abstract Introduction Conclusions References Tables Figures ◭ ◮ ◭ ◮ Back Close Full Screen / EscPrinter-friendly Version Interactive Discussion
EGU
water sulfate concentrations in the region (F ¨olster et al., 2003; F ¨olster and Wilander, 2002), indicating that the magnitude of sulfate pulses during droughts depend on the size and lability of the sulfur pools remaining in the catchments’ soils. This suggests that the magnitude of drought-induced sulfate pulses in the future will primarily be determined by the source depletion rate together with the rate of sulfate pool reloading 5
by future deposition. Therefore, despite a likely continuation of emission reductions in Europe drought-induced sulfate episodes may continue to cause extreme values of ∆ANC(poll)in some streams in the future.
Regional climate models predict that further increases in temperature will occur in Sweden during the coming decades, accompanied by reductions in summer precipita-10
tion and more frequent storms during the fall and winter in large areas of the country (Kjellstr ¨om, 2004). If these predictions are realized, the effects of episodic acidifica-tion in many Swedish streams may be prolonged and aggravated by increases in the frequency and intensity of droughts and sea-salt episodes.
In summary, the anthropogenic contribution to the declines in ANC observed during 15
rain episodes in Sweden often follow periods of drought. This phenomenon is espe-cially prominent in southern and central Sweden; regions that have been subject to high levels of acid deposition historically. However, these streams are generally found in inland regions, where the long-term effects of the decline in anthropogenic acidifica-tion are ameliorating the effects. In coastal areas, high deposiacidifica-tion of sea-salt appears 20
to be retarding the episodic recovery in many streams.
Acknowledgements. Funding for this research was provided by a grant from the Swedish
Environmental Protection Agency. Many thanks are due to the late Olle Westling, who was involved in an early stage of this project.
25
HESSD
4, 2975–2996, 2007 Recovery from episodic acidification H. Laudon Title Page Abstract Introduction Conclusions References Tables Figures ◭ ◮ ◭ ◮ Back Close Full Screen / EscPrinter-friendly Version Interactive Discussion
EGU
References
Alewell, C., Mitchell, M. J., Likens, G. E., and Krouse, H. R.: Sources of stream sulfate at the Hubbard Brook Experimental Forest: Long-term analyses using stable isotopes, Biogeo-chemistry, 44, 281–299, 1999.
Baker, J. P., VanSickle, J., Gagen, C. J., DeWalle, D. R., Sharpe, W. E., Carline, R. F., Baldigo,
5
B. P., Murdoch, P. S., Bath, D. W., Kretser, W. A., Simonin, H. A., and Wigington, P. J.: Episodic acidification of small streams in the northeastern United States: Effects on fish populations, Ecol. Appl., 6, 422–437, 1996.
Bishop, K. H., Laudon, H., and K ¨ohler, S.: Separating the natural and anthropogenic compo-nents of spring flood pH decline: A method for areas that are not chronically acidified, Water
10
Resour. Res., 30, 1873–1889, 2000.
Christophersen, N., Dymbe, L. H., Johannssen, M., and Seip, H. M.: A Model for Sulphate in Streamwater at Stogama, Southern Norway, Ecol. Modell., 21, 35–61, 1983.
Devito, K. J., Hill, A. R., and Dillon, P. J.: Episodic sulphate export from wetlands in acidified headwater catchments: prediction at the landscape scale, Biogeochemistry, 44, 187–203,
15
1999.
Eimers, M. C., Dillon, P. J., and Schiff, S. L.: Sulphate flux from an upland forested catchment in South-Central Ontario, Canada, Water Air and Soil Pollution, 152, 3–21, 2004a.
Eimers, M. C., Dillon, P. J., and Watmough, S. A.: Long-term (18-year) changes in sulphate concentrations in two Ontario headwater lakes and their inflows in response to decreasing
20
deposition and climate variations, Hydrol. Processes, 18, 2617–2630, 2004b.
Evans, C. D., Monteith, D. T., and Harriman, R.: Long-term variability in the deposition of marine ions at west coast sites in the UK Acid Waters Monitoring Network: impacts on surface water chemistry and significance for trend determination, Sci. Total Environ., 265, 115–129, 2001. F ¨olster, J., Bishop, K., Kram, P., Kvarnas, H., and Wilander, A.: Time series of long-term
25
annual fluxes in the streamwater of nine forest catchments from the Swedish environmental monitoring program (PMK 5), Sci. Total Environ., 310, 113–120, 2003.
F ¨olster, J. and Wilander, A.: Recovery from acidification in Swedish forest streams, Environ. Pollut., 117, 379–389, 2002.
Heath, R. H., Kahl, J. S., Norton, S. A., and Fernandez, I. J.: Episodic stream acidification
30
caused by atmospheric deposition of sea salts at Acadia National Park, Maine, United States, Water Resour. Res., 28, 1081–1088, 1992.
HESSD
4, 2975–2996, 2007 Recovery from episodic acidification H. Laudon Title Page Abstract Introduction Conclusions References Tables Figures ◭ ◮ ◭ ◮ Back Close Full Screen / EscPrinter-friendly Version Interactive Discussion
EGU
Hindar, A., Henrikssen, A., Torseth, K., and Semb, A.: Acid water and fish death, Nature, 372, 327–328, 1994.
Hindar, A., Torseth, K., Henriksen, A., and Orsolini, Y.: The significance of the North Atlantic Oscillation (NAO) for sea-salt episodes and acidification-related effects in Norwegian rivers, Environ. Sci. Technol., 38, 26–33, 2004.
5
Jeffries, D. S., Semkin, R. G., Beall, F. D., and Franklyn, J.: Temporal trends in water chemistry in the Turkey Lakes watershed, Ontario, Canada, 1982–1999, Water Air Soil Pollut.: Focus, 2, 5–22, 2002.
Kindbom, K., Sj ¨oberg, K., Munthe, J., Peterson, K., Persson, C., Roos, E., and Bergstr ¨om, R.: Nationell milj ¨o ¨overvakning av nederb ¨ordskemi. (In Swedish) IVL (Swedish Environmental
10
Research Institute). 35 pp, 1998.
Kjellstr ¨om, E.: Recent and future signatures of climate change in Europe. Ambio, 33, 193–198, 2004.
Kowalik, R. A. and Ormerod, S. J.: Intensive sampling and transplantation experiments re-veal continued effects of episodic acidification on sensitive stream invertebrates, Freshwater
15
Biology, 51, 180–191, 2006.
Laudon, H. and Bishop, K.: Episodic stream water decline during autumn storms following a summer drought, Hydrol. Processes, 16, 1725–1733, 2002.
Laudon, H., Clair, T. A., and Hemond, H. F.: Long-term response in episodic acidification to declining SO42- deposition in two streams in Nova Scotia, Hydrol. Earth Syst. Sci., 6, 773–
20
781, 2002,
http://www.hydrol-earth-syst-sci.net/6/773/2002/.
Laudon, H., Dillon, P. J., Eimers, M. C., Semkin, R. G., and Jeffries, D. S.: Climate-induced episodic acidification of streams in central Ontario, Environ. Sci. Technol., 38, 6009–6015, 2004.
25
Laudon, H. and Hemond, H. F.: Recovery of streams from episodic acidification in northern Sweden, Environ. Sci. Technol., 36, 921–928, 2002.
Laudon, H., Westling, O., Lofgren, S., and Bishop, K.: Modeling preindustrial ANC and pH during the spring flood in northern Sweden, Biogeochemistry, 54, 171–195, 2001.
Lawrence, G. B.: Persistent episodic acidification of streams linked to acid rain effects on soil,
30
Atmos. Environ., 36, 1589–1598, 2002.
Lepori, F., Barbieri, A., and Ormerod, S. J.: Effects of episodic acidification on macroinverte-brate assemblages in Swiss Alpine streams, Freshwater Biology, 48, 1873–1885, 2003.
HESSD
4, 2975–2996, 2007 Recovery from episodic acidification H. Laudon Title Page Abstract Introduction Conclusions References Tables Figures ◭ ◮ ◭ ◮ Back Close Full Screen / EscPrinter-friendly Version Interactive Discussion
EGU
Mylona, S.: Sulphur dioxide emissions in Europe 1880–1991 and their effect on sulphur con-centrations and depositions, Tellus Ser. B-Chem. Phys. Meteorol., 48, 662–689, 1996. Neal, C. and Kirchner, J. W.: Sodium and chloride levels in rainfall, mist, streamwater and
groundwater at the Plynlimon catchments, mid-Wales: inferences on hydrological and chem-ical controls, Hydrol. Earth Sys. Sci., 4, 295–310, 2000.
5
Posch, M., Hettelingh, J.-P., de Smet, P. A. M., and Downing, R. T.: Calculation and mapping of critical thresholds in Europe: Status Report 1997, 259101007, RIVM, 1997.
Raddum, G. G., Fjellheim, A., and Skjelkvale, B. L.: Improvements in water quality and aquatic ecosystems due to reduction in sulphur deposition in Norway, Water, Air Soil Pollut., 130, 87–98, 2001.
10
Schiff, S. L., Spoelstra, J., Semkin, R. G., and Jeffries, D. S.: Drought induced pulses of SO42-from a Canadian shield wetland: use of delta S-34 and delta O-18 in SO42- to determine sources of sulfur, Appl. Geochem., 20, 691–700, 2005.
Skjelkv ˚ale, B. L., Mannio, J., Wilander, A., and Andersen, T.: Recovery from acidification of lakes in Finland, Norway and Sweden 1990–1999, Hydrol. Earth Syst. Sci., 5, 327–337,
15
2001,
http://www.hydrol-earth-syst-sci.net/5/327/2001/.
Stoddard, J. L., Jeffries, D. S., Lukewille, A., Clair, T. A., Dillon, P. J., Driscoll, C. T., Forsius, M., Johannessen, M., Kahl, J. S., Kellogg, J. H., Kemp, A., Mannio, J., Monteith, D.T., Murdoch, P. S., Patrick, S., Rebsdorf, A., Skjelkv ˚ale, B. L., Stainton, M. P., Traaen, T., van Dam, H.,
20
Webster, K. E., Wieting, J., and Wilander, A.: Regional trends in aquatic recovery from acidification in North America and Europe, Nature, 401, 575–578, 1999.
Warfvinge, P. and Bertills, U.: Recovery from Acidification. Swedish Environmental Protection Agency report 5034, Stockholm, 96 pp, 2000.
Wigington, P. J., Baker, J. P., DeWalle, D. R., Kretser, W. A., Murdoch, P. S., Simonin, H. A.,
25
VanSickle, J., McDowell, M. K., Peck, D. V., and Barchet, W. R.: Episodic acidification of small streams in the northeastern United States: Episodic Response Project, Ecol. Appl. Issn, 6, 374–388, 1996.
Wilander, A., Johnson, R. K., Goedkoop, W., and Lundin, L.: Riksinventeringen 1995 (In Swedish with English summary). Swedish Environmental Protection Agency report 4813,
30
Stockholm, 210 pp,1998.
Yan, N. D., Girard, R., Heneberry, J. H., Keller, W. B., Gunn, J. M., and Dillon, P. J.: Recovery of copepod, but not cladoceran, zooplankton from severe and chronic effects of multiple
HESSD
4, 2975–2996, 2007 Recovery from episodic acidification H. Laudon Title Page Abstract Introduction Conclusions References Tables Figures ◭ ◮ ◭ ◮ Back Close Full Screen / EscPrinter-friendly Version Interactive Discussion
EGU
stressors, Ecol. Lett., 7, 452–460, 2004.
Yue, S., Pilon, P., and Cavadias, G.: Power of the Mann-Kendall and Spearman’s rho tests for detecting monotonic trends in hydrological series, J. Hydrol., 259, 254–271, 2002.
HESSD
4, 2975–2996, 2007 Recovery from episodic acidification H. Laudon Title Page Abstract Introduction Conclusions References Tables Figures ◭ ◮ ◭ ◮ Back Close Full Screen / EscPrinter-friendly Version Interactive Discussion
EGU Table 1.Summary of catchment characteristics.
Stream Year Catchment size (ha) N Episodes Deposition (Kg S ha−1 yr−1) ∆ANC(poll)vs Q (p-value) ∆ANC(poll) vs year (p-value) Southern Sweden G1 (4) 1991–2001 275 13 5–7 0.001 0.04 G2 (4) 1991–2001 125 13 5–7 0.04 0.05 G2 (4R) 1991–2001 179 14 5–7 0.01 0.04 K2 (4) 1991–2001 157 11 5–7 0.02 N.S. L1 (4) 1990–2000 41 12 8–9 0.02 0.05 L2 (4) 1990–2000 92 11 5–7 N.S. 0.03 O2 (4) 1990–2000 16 10 5–7 N.S. N.S. N1 (4) 1990–1999 12 10 10–15 0.0007 N.S. P1 (4) 1991–2000 14 16 10–15 0.0001 N.S. P2 (4) 1991–2001 20 16 7–9 N.S. 0.05 P3 (4A) 1991–2000 2.2 10 10–15 0.002 0.05 P3 (4B) 1991–2000 4.0 11 10–15 0.0008 0.02 R2 (4) 1991–2000 32 12 5–7 N.S. 0.03 Berg (Pipb ¨acken N) 1986–1995 90 8 10–15 N.S. N.S. Berg (Pipb ¨acken ¨O) 1986–1995 73 13 10–15 0.04 N.S. Tostarp 1985–2000 170 13 10–15 0.02 N.S. Central Sweden
Tresticklan 1985–2002 140 25 3–5 0.002 N.S. Tiveden (Br ˚at ¨ang) 1985–2002 750 23 3–5 0.01 0.02 Tiveden (Lomma N) 1985–2002 100 28 3-5 0.03 N.S. Tiveden (Lomma ¨O) 1985–1996 30 13 3-5 0.08 N.S. Northern Sweden Tand ¨ovalen 1986–2000 580 17 2–3 N.S. N.S. Stormyran 1986–2002 320 13 2-3 0.03 N.S. Sandn ¨aset 1985–2002 50 10 1-2 N.S. N.S. Ammarn ¨as 1985–2002 220 9 1-2 N.S. N.S. Reivo 1985–2002 1090 11 1-2 N.S. N.S.
HESSD
4, 2975–2996, 2007 Recovery from episodic acidification H. Laudon Title Page Abstract Introduction Conclusions References Tables Figures ◭ ◮ ◭ ◮ Back Close Full Screen / EscPrinter-friendly Version Interactive Discussion
EGU Table 2.Summary of average stream chemistry.
Stream pH SO4 Cl NO3 Ca Mg Na K
µeq/l µeq/l µeq/l µeq/l µeq/l µeq/l µeq/l
Southern Sweden G1 (4) 4.99 170 169 1 151 101 200 10 G2 (4) 4.70 175 176 0 166 106 189 7 G2 (4R) 4.48 176 179 1 103 88 196 9 K2 (4) 4.44 354 205 12 272 124 246 23 L1 (4) 4.74 320 346 7 202 155 385 15 L2 (4) 4.32 350 264 5 169 105 271 7 O2 (4) 4.35 157 302 3 60 77 295 8 N1 (4) 5.18 214 312 11 181 128 286 13 P1 (4) 4.99 166 275 4 122 73 266 7 P2 (4) 4.99 163 202 2 113 80 210 7 P3 (4A) 4.61 229 146 41 88 62 123 28 P3 (4B) 4.73 191 167 25 158 62 141 24 R2 (4) 5.40 182 208 2 269 101 225 11
Berg (Pipb ¨acken N) 4.58 158 294 1 87 98 274 8
Berg (Pipb ¨acken ¨O) 4.42 132 286 1 67 83 259 8
Tostarp 6.00 374 295 14 352 213 322 17
Central Sweden
Tresticklan 4.44 89 161 1 50 45 163 9
Tiveden (Br ˚at ¨ang) 4.60 124 96 1 90 51 117 9
Tiveden (Lomma N) 4.30 124 89 0 56 41 111 7 Tiveden (Lomma ¨O) 4.28 156 98 1 69 50 118 7 Northern Sweden Tand ¨ovalen 4.67 52 18 1 28 15 39 4 Stormyran 6.31 36 21 2 120 116 48 7 Sandn ¨aset 6.64 293 81 2 175 53 83 9 Ammarn ¨as 6.92 49 42 1 284 67 58 25 Reivo 6.78 29 14 2 112 34 58 8
HESSD
4, 2975–2996, 2007 Recovery from episodic acidification H. Laudon Title Page Abstract Introduction Conclusions References Tables Figures ◭ ◮ ◭ ◮ Back Close Full Screen / EscPrinter-friendly Version Interactive Discussion
EGU Fig. 1.Map showing the locations of the studied streams in Sweden.
HESSD
4, 2975–2996, 2007 Recovery from episodic acidification H. Laudon Title Page Abstract Introduction Conclusions References Tables Figures ◭ ◮ ◭ ◮ Back Close Full Screen / EscPrinter-friendly Version Interactive Discussion EGU Year 1986 1991 1996 2001 ∆ AN C(p o ll) (µ e q L -1 ) 0 40 80 120 Year 1986 1991 1996 2001 ∆ AN C(p o ll) (µ e q L -1 ) 0 40 80 120 r2=0.24 p=0.05 N=16 N.S. N=14
Fig. 2. Trend in anthropogenic response ∆ANC(poll) during episodes in one inland stream (Br ˚at ¨ang) with declining ∆ANC(poll) (left) and one coastal stream (Tostarp) with no trend in
HESSD
4, 2975–2996, 2007 Recovery from episodic acidification H. Laudon Title Page Abstract Introduction Conclusions References Tables Figures ◭ ◮ ◭ ◮ Back Close Full Screen / EscPrinter-friendly Version Interactive Discussion
EGU Fig. 3a.Time series of ANC variability from 1985–2002 in Tresticklan (above) with examples of
episodic ANC response with dry antecedent conditions (below left) and wet antecedent condi-tions (below right).
HESSD
4, 2975–2996, 2007 Recovery from episodic acidification H. Laudon Title Page Abstract Introduction Conclusions References Tables Figures ◭ ◮ ◭ ◮ Back Close Full Screen / EscPrinter-friendly Version Interactive Discussion EGU 0 50 100 150 200 R u n o ff L s -1 0 50 100 150 200 SO 4 2 - (µ e q L -1 ) 0 50 100 150 200 0 50 100 150 200 SO4 2-Q l/s
Fig. 3b. The accompanied SO4 response to the dry antecedent conditions (left) and wet an-tecedent conditions (right).
HESSD
4, 2975–2996, 2007 Recovery from episodic acidification H. Laudon Title Page Abstract Introduction Conclusions References Tables Figures ◭ ◮ ◭ ◮ Back Close Full Screen / EscPrinter-friendly Version Interactive Discussion EGU
Preceding runoff (L s
-1)
0 1 2 3 4 5 6∆
AN
C
(p o ll)(µ
e
q
L
-1)
0 50 100 150 200 250 300 350 r2=0.72 p<0.0001 N=16Fig. 4.Correlation between antecedent runoff and anthropogenic response (∆ANC(poll)) during episodes in one of the study streams (P1 (4)). The remaining p-values of the correlation are given in Table 1.


![[PDF] Apprendre la programmation Android avec base de données - Free PDF Download](data:image/gif;base64,R0lGODlhAQABAIAAAP///wAAACH5BAEAAAAALAAAAAABAAEAAAICRAEAOw==)