HAL Id: insu-03097842
https://hal-insu.archives-ouvertes.fr/insu-03097842
Submitted on 5 Jan 2021
HAL is a multi-disciplinary open access
archive for the deposit and dissemination of
sci-entific research documents, whether they are
pub-lished or not. The documents may come from
teaching and research institutions in France or
abroad, or from public or private research centers.
L’archive ouverte pluridisciplinaire HAL, est
destinée au dépôt et à la diffusion de documents
scientifiques de niveau recherche, publiés ou non,
émanant des établissements d’enseignement et de
recherche français ou étrangers, des laboratoires
publics ou privés.
Towards stratigraphic-thermo-mechanical numerical
modelling: Integrated analysis of asymmetric
extensional basins
Attila Balázs, Liviu Matenco, Didier Granjeon, Katharina Alms, François
Thomas, Orsolya Sztanó
To cite this version:
Attila Balázs, Liviu Matenco, Didier Granjeon, Katharina Alms, François Thomas, et al..
Towards stratigraphic-thermo-mechanical numerical modelling:
Integrated analysis of
asym-metric extensional basins.
Global and Planetary Change, Elsevier, 2021, 196, pp.103386.
Global and Planetary Change 196 (2021) 103386
Available online 18 November 2020
0921-8181/© 2020 The Author(s). Published by Elsevier B.V. This is an open access article under the CC BY-NC-ND license (http://creativecommons.org/licenses/by-nc-nd/4.0/).
Research Article
Towards stratigraphic-thermo-mechanical numerical modelling: Integrated
analysis of asymmetric extensional basins
Attila Bal´azs
a,*, Liviu Mat¸enco
b, Didier Granjeon
c, Katharina Alms
d, Thomas François
e,
Orsolya Sztan´o
faETH Zürich, Geophysical Fluid Dynamics Group, Institute of Geophysics, Zürich, Switzerland bDepartment of Earth Sciences, Faculty of Geosciences, Utrecht University, Utrecht, the Netherlands cGeosciences Division, IFPEN, IFP Energies Nouvelles, Rueil-Malmaison, France
dFraunhofer IEG, Institution for Energy Infrastructures and Geothermal Systems IEG, Bochum Location, Lennershofstrasse 140, 44801 Bochum, Germany eUniversit´e Paris-Saclay, CNRS, GEOPS, Orsay 91405, France
fE¨otv¨os Lor´and University, Department of Geology, Budapest, Hungary
A R T I C L E I N F O
Keywords:
Asymmetric extension Sedimentation Heat flow evolution Subsidence history Depositional systems Pannonian Basin
A B S T R A C T
Subsidence and uplift patterns and thermal history of sedimentary basins are controlled by tectonics, mantle dynamics and surface processes, such as erosion, sediment transport and deposition and their links to climatic variations. We use combined thermo-mechanical and stratigraphic numerical modelling techniques to quantify the links between tectonic and surface processes. We aim to assess the thermal evolution and subsidence rates of asymmetric extensional basins during the syn- and post-rift times by simulating different erosion and sedi-mentation rates. We analyse the 3D sedimentary architecture and facies distribution of the depocenters. Model results are validated by observations in the Pannonian Basin of Central Europe. Extensional reactivation of inherited suture zones creates asymmetric basin systems controlled by large-scale detachments or low-angle normal faults, where crustal and lithospheric mantle thinning are often rheologically decoupled. Subsidence rates and basement heat flow in the depocenters show large variabilities during asymmetric extension and post- rift evolution controlled by their initial position from the suture zone and migration of deformation. Transient heat flow anomalies mirror crustal exhumation of footwalls, sediment blanketing and erosion effects in the basins. Enhanced erosion and sedimentation facilitate lower crustal deformation and elastic flexure of the weak, extended lithosphere leading to accentuated differential uplift and subsidence during the syn- and post-rift basin evolution. Tectonics, climate and autogenic processes control transgressive-regressive cycles at different time-scales together with the overall sedimentary facies distribution. In our models assuming wet climate the high subsidence rate often outpaces moments of eustatic water-level fall preventing relative base-level fall and en-hances the effects of autogenic processes, such as lobe switching processes.
1. Introduction
The inherent links between tectonics, mantle dynamics and surface processes such as erosion and sedimentation coupled to climatic varia-tions, have been long recognized as the main drivers for the evolution of
orogens (e.g., Whipple, 2009; Erdos et al., 2014; Ueda et al., 2015) and
sedimentary basin systems (e.g., Burov and Poliakov, 2003; Bialas and
Buck, 2009; Olive et al., 2014; Hart et al., 2017; Ballato et al., 2019).
Understanding the complex interplay between tectonic and surface processes requires the joint application of thermo-mechanical and
stratigraphic modelling techniques (e.g., Wu et al., 2018;
Andr´es-Mar-tínez et al., 2019; Theunissen and Huismans, 2019). Simulations of
erosion, sediment transport and deposition together with modelling of the basin evolution are amongst the most challenging objectives, because tectonic and sedimentary processes, such as floods or sediment gravity flows act on a wide range of spatial and temporal scales (e.g.,
Armitage et al., 2011; Postma et al., 2014). Furthermore, quantitative
understanding of the thermal evolution and burial history of the sedi-mentary basins help for the assessment of geo-resources, such as geothermal energy, hydrocarbons or freshwater. Basement heat flow
* Corresponding author at: ETH Zurich, Geophysical Fluid Dynamics Group, Institute of Geophysics, Sonneggstrasse 5, CH8092 Zürich, Switzerland. E-mail address: [email protected] (A. Bal´azs).
Contents lists available at ScienceDirect
Global and Planetary Change
journal homepage: www.elsevier.com/locate/gloplacha
https://doi.org/10.1016/j.gloplacha.2020.103386
evolution is one of the prime parameters for basin analysis (Theissen and
Rüpke, 2010). Its quantification is challenging due to its links and
feedbacks between tectonics, surface processes and climate (Ter Voorde
and Bertotti, 1994), and therefore its modelling requires an integrated
approach.
The spatial and temporal variation of differential vertical movements and the associated evolution of sedimentary environments in exten-sional sedimentary basins are primarily controlled by the relationship between crustal and lithospheric thinning, influenced by the rheological
layering and by the evolution of the underlying asthenosphere (Burov
and Yamato, 2008; Dressel et al., 2017; Naliboff et al., 2017). Owing to
inherited orogenic cycles, extension generally affects a heterogenous
continental lithosphere (Duretz et al., 2016). These heterogeneities,
such as nappe contacts or former suture zones are considered rheological
weak zones and localizes deformation (Heron et al., 2016; Petersen and
Schiffer, 2016) controlling the evolution of asymmetric extensional
basins (Bal´azs et al., 2017a).
The architecture of sedimentary basins is the result of the interplay
between relative sea-level changes and sediment supply (Schlager,
1993) combined with sediment transport processes (e.g., Burgess et al.,
2019). Relative water-level changes are controlled by eustatic sea-level
variations and tectonics, their relative importance varies during basin
evolution from extension to post-rift times (Martins-Neto and
Catu-neanu, 2010; Bal´azs et al., 2018a; Matenco and Haq, 2020). In active
extensional settings the migration of deformation and differential ver-tical movements play an important role in the 3D sedimentary
archi-tecture (Andri´c et al., 2017; Bal´azs et al., 2017a; Hou et al., 2020), while
during post-rift times eustatic variations often outpace the slower sub-sidence and together with autogenic processes they control sedimentary
sequences (Csat´o et al., 2014; Harris et al., 2020). Separating and
un-derstanding the distinct basin-wide or global scale allogenic processes, such as environmental, climatic and tectonic forcing factors and the internally generated, local, short-term autogenic forcing in the
sedi-mentary record is fundamental for pertinent basin analysis (e.g., Yang
et al., 1998; Kim et al., 2013).
In this study, we aim to investigate the interactions between tec-tonics and surface processes in asymmetric extensional sedimentary basins by applying a joint method of thermo-mechanical and strati-graphic numerical modelling. In a series of experiments, we test the influence of erosion and sedimentation rates and different values of initial crustal and lithospheric thickness during extension and subse-quent post-rift evolution. A wet and dry climatic scenario is computed by using different erosion and sedimentation rates in both the thermo- mechanical and stratigraphic models. We compare the heat flow and temperature evolution of the sedimentary basins under these conditions. The wet scenario simulates long-term climatic optimums, such as the Mid-Miocene Climatic Optimum (ca. 17–14 Ma) and the period of late Miocene increased precipitation and erosion inferred for the evolution
in Central Europe (B¨ohme, 2003). This integrated approach yields
quantitative understanding of the interplay between tectonics and sur-face processes, heat flow and burial history, lithological distribution and the formation of unconformities and their connection with different forcing factors.
2. Numerical methods
We combined lithospheric-scale numerical simulations of asym-metric extension by applying the thermo-mechanical code Flamar v12
(Burov and Yamato, 2008) and the basin-scale stratigraphic forward
modelling code DionisosFlow (Granjeon, 2019). Our modelling
approach enables the one-way joint run of Flamar and DionisosFlow
(Fig. 1; Appendix A, B). The thermo-mechanical code is particularly well
suited to study the dynamics of lithospheric extension and topographic evolution.
Depocenter geometries and total sediment loaded basement vertical motions were extracted from the thermo-mechanical model in 2D along
a 2D dip line (X,Y) at each timestep. In two subsequent 3D stratigraphic simulations, these calculated basement subsidence and uplift values were uniformly extended in the third, Z dimension (models M1wet,
M1dry) in the absence of any along-strike variations (Fig. 1). In two
further 3D stratigraphic experiments (M2wet, M2dry) we defined finite fault segments in the third (Z) dimension and thus imposed along-strike
variations of the calculated subsidence values (Fig. 1b and Fig. B2 in
Appendix B). In these two latter models we assumed an average fault
displacement to fault length ratio of 1:30 (Childs et al., 2009). The
hanging wall subsidence and footwall uplift values decrease towards the sides of the 3D stratigraphic model domain mirroring a relay zone and
asymmetric footwall geometries (geometry II. in Fig. 1b). We choose this
imposed segmented fault geometry and subsidence pattern to simulate
the observed normal fault pattern of the Pannonian Basin (Horv´ath
et al., 2015). The resulted basement subsidence history was then
im-ported into the high-resolution stratigraphic simulations at each
time-step where erosion, sediment transport (Fig. 2) and deposition and the
overall basin-scale sedimentary architecture and 3D facies distribution were simulated at high resolution (i.e. meter-scale vertical resolution). Both Flamar and DionisosFlow models use a dynamic timestep scheme, DionisosFlow uses a finer temporal resolution (i.e. hundreds of years) and, therefore, linear interpolation was made between the time steps (thousands of years) of the thermo-mechanical modelling results. Further model description and model limitations are shown in the sup-plementary information file (Appendix A, B).
Despite the different numerical approach of the two software, the calculated syn- and post-rift sedimentary thicknesses are similar in the thermo-mechanical and in the subsequent stratigraphic numerical models. Nevertheless, the much finer temporal and vertical resolution of DionisosFlow enable a more detailed simulation and sedimentary interpretation for the stratigraphic architecture. Furthermore, Dio-nisosFlow simulates multiple sediment classes and thus the sedimentary facies distribution can be analysed.
2.1. Thermo-mechanical numerical modelling method
Lithospheric-scale models were performed by the 2D thermo-
mechanically coupled finite element code Flamar v12 (Burov and
Yamato, 2008) based on the earlier Flac-Para(o)voz algorithm (Poliakov
et al., 1993). In the Lagrangian method, incremental displacements are
added to the grid coordinates allowing the mesh to move and deform with the material. This allows for the solution of large-strain problems while using locally the small-strain formulation. The code locally solves full Newtonian equations of motion in a continuum mechanics approx-imation in 2D. The equations are coupled with the heat transfer and further constitutive equations using temperature and pressure depen-dent densities and including linear elasticity, Mohr–Coulomb failure criterion for brittle deformation (faults) and pressure–temperature and
strain-rate dependent viscous deformation (Burov and Yamato, 2008).
Linear cohesion softening is used for effective localisation of plastic
deformation (Huismans and Beaumont, 2003).
This method handles a free upper surface affected by simplified surface processes. Erosion and sedimentation were simulated by a linear
diffusion law, where different diffusion coefficients (ke) correspond to
different erosion and sedimentation rates.
dh dt=ke
∂2h
∂x2 (1)
where h is topography, t is time, x is the horizontal dimension. Our modelling setup involves a 1000 km wide and 450 km deep 2D section. The horizontal grid resolution is 2 km and the vertical grid resolution varies from 1.2 to 3 km. The accuracy of the vertical displacement is in the order of 10 m. We applied a sum of 2 cm/yr constant divergence velocity condition at the sides of the model simulating the Pannonian Basin extension rate during its syn-rift phase. This velocity is set to zero
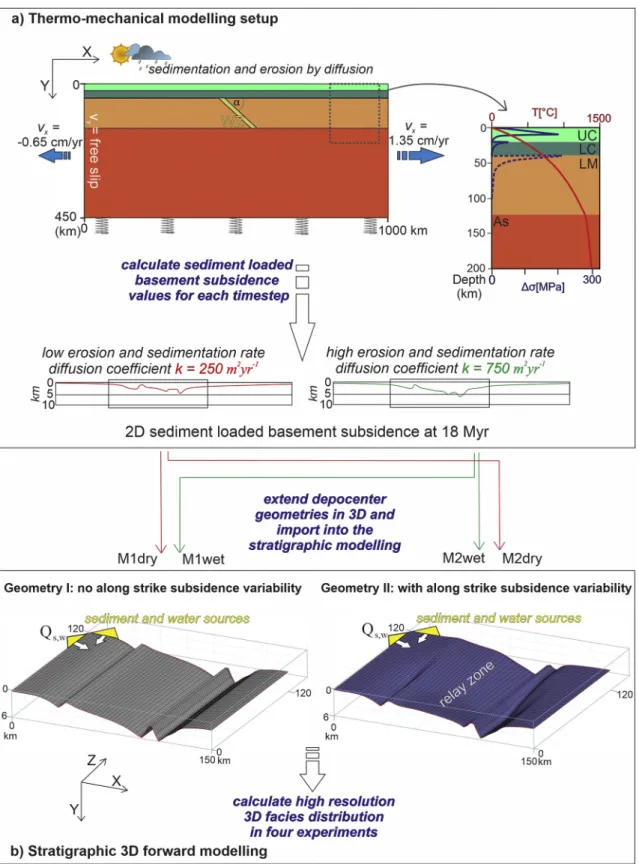
Fig. 1. Workflow of the thermo-mechanical and stratigraphic numerical models. The tectonic vertical movements imposed in the stratigraphic model were extracted
from the thermo-mechanical models. (a) UC: upper crust, LC: lower crust, LM: lithospheric mantle, As: asthenosphere. Springs indicate lithostatic pressure (Winkler basement) applied at the base of the thermo-mechanical model. An initial tilted rheological weakness zone (WZ) is implemented in the lithosphere simulating a former suture zone. (b) Basement geometries in sediment transport and deposition forward modelling of three half-grabens with (right) and without (left) along-strike subsidence variability. Water discharge and sediment flux sources in the model are defined parallel with and perpendicular to the strike of the half-grabens close to the corner of the model by a km-scale channel.
during the subsequent post-rift phase. The Winkler’s hydrostatic pliable
condition is set for the bottom boundary. We set 10 ◦C at the surface,
1300 ◦C at the base of the lithosphere and 1650 ◦C at the base of the
model. The lateral thermal boundary condition includes zero heat flow. Detailed description of this numerical approach is further described in
prior studies (Burov and Poliakov, 2003; Burov and Yamato, 2008;
Francois et al., 2013).
2.2. Thermo-mechanical model setup
The three thermo-mechanical simulations (Figs. 3–4, 6) presented in
this study (Table 1, for further model results see Appendix A) are based
on previous parametric studies on lithospheric extension (Bal´azs et al.,
2017a). The models show the extensional reactivation of a lithospheric-
scale suture zone, which results in the formation and evolution of asymmetric extensional sedimentary basins.
We have defined a reference model (Fig. 3), which consists of a
135 km thick lithosphere including 20 km thick upper crust and 20 km thick lower crust and 95 km thick dry olivine lithospheric mantle overlying further 315 km asthenosphere of wet olivine rheology. The syn-rift phase is simulated by divergent velocities for 7.2 Myr followed by post-rift phase until 18 Myr numerical time. This model is compared
to another experiment with a lower diffusion coefficient (250 m2yr−1)
simulating a more arid climatic condition. Furthermore, one additional experiment is conducted in the absence of surface processes (i.e.,
0 diffusion coefficient). The initial Moho temperature is 725 ◦C. The
crust is thinned by a factor of 2.5 in the basin centre. All these values resemble the syn- and post-rift evolution of the Pannonian back-arc
basin (Horv´ath et al., 2015). Furthermore, in all models we defined a
tilted rheological weak zone in the mantle lithosphere representing a suture inherited from a former subduction and orogenic episode. It is assumed that such former subduction and collision phase have resulted in a thickened crust and have released fluids during subduction creating
the weak zone of wet olivine rheology in the lithosphere (Fig. 1). Such a
heterogenous mantle is also described by geochemical studies from the
Pannonian Basin (e.g., Harangi et al., 2001; Liptai et al., 2018). Further
rheological, kinematic and geometrical parameters were tested in a
similar previous study (Bal´azs et al., 2017a). These initial rheological
and thermal parameters are designed to simulate a young orogenic structure preceding its extensional collapse. Rheological decoupling of the crustal and lithospheric layers takes place in most cases and results
in horizontal ductile flow in the intermediate or lower crust (Burov and
Poliakov, 2003).
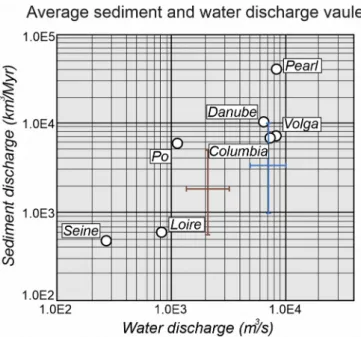
Fig. 2. Relation between sediment and water discharge based on observations
from major rivers (modified after Csat´o et al., 2014). Brown and blue signs indicate values used in our stratigraphic forward modelling in dry and wet climatic scenarios, respectively. (For interpretation of the references to colour in this figure legend, the reader is referred to the web version of this article.)
Table 1
Basic parameters of the thermo-mechanical numerical experiments. Rheological parameters are adapted from similar numerical experiments (quartz-rich upper crust; diabase lower crust; dry and wet olivine mantle: e.g., Burov and Poliakov, 2003).
Length of model xL 1000 km
Amount of extension 150 km Extension velocity 2 cm/yr Vertical resolution in the upper crust 1.2 km Horizontal resolution 2 km Temperature at the base of the lithosphere 1300 ◦C
Radioactive heat production, Hs 1.5 × 10⁻⁹ W kg−1
Radiogenic production decay length, hr 10 km
Upper crustal thermal conductivity, kc 2.5 W K−1 m−1
Lower crustal thermal conductivity, kc 2 W K−1 m−1
Mantle thermal conductivity, km 3.3 W K−1 m−1
Thermal diffusivity of mantle, χ 10−6 m2 s−1
Specific heat, Cp 1000 J K−1 kg−1
Cohesion 20 MPa
Byerlee’s law friction angle 30 ◦
Initial surface heat flow 70 mW/m2
Lam´e elastic constants 30 GPa
2D erosion coefficient in dry and wet climatic scenarios, kero 0 & 250 & 750 m2 yr−1
Upper
crust Lower crust Mantle lithosphere Weak zone Asthenosphere Thickness (km) 20 20 95 – 315 Density, ρ0 (kg m−3) 2750 2900 3330 3270 3330
Power law constant, A (MPa-n
s−1) 6.7 × 10
−6 6.3 × 10⁻² 7 × 10³ 6.8 × 10³ 7 × 10³
Creep activation energy, E
(kJ mol−1) 156 276 520 276 510
2.3. Stratigraphic numerical modelling method
DionisosFlow (Granjeon and Joseph, 1999; Granjeon, 2019) is a 3D
deterministic diffusion-based model that accounts for the spatial and temporal variation of accommodation, water discharge, sediment sup-ply composed of different sediment classes, compaction, eustasy and different erosion and sediment transport processes. Building on the tectonic subsidence history computed by the thermo-mechanical models the subsequent stratigraphic forward numerical modelling enables the analysis of sedimentary facies distribution, the evolution of the overall sedimentary transport routes and the basin-scale sedimentary architec-ture during the syn- and post-rift phases of basin evolution.
The physical equations are solved using a finite-volume implicit
numerical scheme (Gervais and Masson, 2008). The set of nonlinear
sediment production and transport equations is solved using a Newton algorithm. The model combines empirical water and gravity-driven diffusion equations, which include a slow long-term gravity-driven creeping law and a faster water-driven and slope-driven diffusion
equation (Granjeon, 2019) leading to the following non-linear sediment
transport equation: Qsi=KsiS + KwiQ̂ m wS n,where ̂Q w=Qw / Qw0 (2)
where Qsi is the flux of the i-th sediment class [m2s
−1], K
si is a creeping
diffusion coefficient, S is the local slope gradient, Kwi is a water-driven
diffusion coefficient, ̂Qw is a local normalized water discharge with
Qw0 =1 m3s
−1, m and n are power coefficient constants with values
between 1 and 2 (Tucker and Slingerland, 1994).
This transport equation reflects the overall sedimentary processes
during erosion, transport and deposition at basin scale (Burgess et al.,
2019). In classical landscape evolution numerical models, fluvial water
flow is modelled using a single-direction routing method, where water
flows towards the steepest slope (Tucker and Slingerland, 1994). The
approach of DionisosFlow is different by simulating the behaviour of the entire sedimentary basin system at a larger scale. This regional approach
uses a multi-direction method (Granjeon, 2019), where water is routed
to all local lower neighbours of a given cell following slope ratios, which
handles better diverging flow pattern (Tucker and Hancock, 2010) and is
well adapted to simulate overland sheet flow as well as braided systems. Sedimentation and erosion rates for each sediment fraction at each cell are computed from the mass conservation equation and the actual sediment flux.
Accommodation space is controlled by the basement subsidence and eustatic sea-level variations. DionisosFlow can handle different syn-thetic or published eustatic curves. Further seasonal variability and climatic events are simulated by a statistical approach. Sediment transport is divided into short-term high-energy (HEST) and long-term low energy (LELT) intervals. This modelling approach assumes that during each time step a specific percent of the sediments are discharged by a much higher water flow rate simulating scarce, but extreme floods
events (Granjeon, 2019). Building on a previous parametric study we set
33% of the sediments with 18 times higher water discharge value for
HEST events resulting the most realistic facies distribution (Bal´azs et al.,
2017b).
2.4. Stratigraphic model setup
The model setups are designed with and without along strike subsi-dence variability (geometry I and II in Model M1wet and M1dy
respectively) and during wet and dry climatic conditions (Table 2).
Basement geometries and subsidence rates derive from the thermo- mechanical simulations, where sediment transport is characterized by lower and higher diffusion coefficients simulating dry and wet climatic
conditions (Fig. 4). Note that the different diffusion coefficients in the
thermo-mechanical models resulted in different subsidence and uplift
histories (Fig. 4) due to differences in strain localization, different
sediment loading and unloading effects and different thermal evolution
(Bal´azs et al., 2017a). The stratigraphic models simulating wet climatic
conditions (Models M1wet and M2wet) are characterized by higher erosion rates, higher water and sediment discharge values and higher
HEST/LELT discharge ratios (Table 2).
We defined an area of 150 × 120 km2 representing the most extended
parts of the western Pannonian Basin, i.e., the Danube Basin (Sztan´o
et al., 2016) hosting the deepest (half)grabens with 2.5 km horizontal
grid spacing (Fig. 1b). The external sediment and water sources are
defined at the sides of the model close to the model corner, representing
a kilometre-scale channel (Fig. 1b). External sediment supply and water
discharge (Table 2) values laterally decreases from the centre of this
channel towards its side. These sediment and water discharge values are derived from observations from natural examples, such as the Danube or
Volga river deltas (Fig. 2). Simulations handle three sediment classes,
such as mud, sand and basement derived cobbles, characterized with
distinct diffusion coefficients (Table 2). The sediments are then
trans-ported towards the depocenters based on Eq. (2). Each model voxel is
Table 2
Main parameters of the four presented 3D stratigraphic forward numerical experiments. For further details see Granjeon (2019).
Horizontal model dimension 150 km × 120 km Horizontal model resolution 2.5 km
Vertical resolution variable ~1–100 m
Water flow exponential, m 1.5
Slope exponential, n 1.3
External source sand/mud ratio 3/7 Sediment class Basement Sand Mud
Grain size [mm] 4 0.25 0.0035
Gravity-driven coefficient [km2/kyr] 0.01 0.03 0.03
Water-driven continental coefficient [km2/kyr] 80 80 160
Water-driven marine coefficient [km2/kyr] 0.08 0.08 0.8
Experiment Max. syn- and post- rift basement subsidence
Maximum
erosion rate Maximum sediment supply Maximum long- term water discharge Short-term / long- term discharge ratio Along-strike Geometrical variability M1wet 4.25 km, 2 km 300 m/Myr 9000 km3/Myr 2000 m3/s 18 no
M1dry 3.25 km, 1 km 200 m/Myr 6000 km3/Myr 1000 m3/s 12 no
M2wet 4.25 km, 2 km 300 m/Myr 6000 km3/Myr 2000 m3/s 18 yes
built up by the mixture of these classes that are visualized by their proportion. Compaction of sediments is computed following generic lithology-dependent porosity-depth curves (Appendix B). Additional internal sediment sources are the eroding basement rocks. Low ampli-tude climate-driven water-level variations are implemented by a sinu-soidal function of 36 m half-amplitude and 300 kyr time period.
2.5. Model visualization
Thermo-mechanical model results are illustrated by phase compo-sition, i.e., sediments deposited in the half-grabens, upper and lower
crustal and lithospheric layers (Figs. 3–4). Finite strain and strain rate
results illustrate brittle faults in the upper crust and ductile shear zones
Fig. 3. The tectonic (a) and stratigraphic (b) evolution of the reference model simulating wet climatic condition, i.e., with high erosion and sediment flux values.
Results during the syn-rift (3 Myr), at the transition from syn- to post-rift times (7.2 Myr) and after further 10.8 Myr post-rift evolution. Numbers above the phase configuration results show the gradual opening of the sedimentary subbasins. Depocenters are filled by sediments (red colour). UC – Upper crust, LC – Lower crust, LM – Lithospheric mantle, As – Asthenosphere, WZ – mantle weak zone. The basement subsidence pattern extracted from the thermo-mechanical experiment is used as input in the stratigraphic model. Bathymetry and sand ratio results are shown in cross sections through the centre of the 3D model. Note that thick sand bodies deposit in the topsets and in the uppermost part of the foresets of the prograding shelf-margin slopes and further sand portions are also transported at ~40 km distance from the shore. (For interpretation of the references to colour in this figure legend, the reader is referred to the web version of this article.)
in the middle and lower crust and in the mantle (Figs. 3–4). Basement
subsidence curves (Fig. 4a) are calculated based on markers in the upper
crust beneath three distinct half-grabens.
Stratigraphic models are illustrated by distinct output attributes.
First, bathymetry images (Figs. 3–5, 7–9) represent the water depth of
the sediments at the times of deposition. Sedimentation and erosion
rates are extracted (Fig. 4) and the high energy water flux indicates the
main sedimentary transport routes (Fig. 5). Furthermore, each model
voxel is built up by the mixture of mud, sand and basement derived
cobble classes that are visualized by their proportion (Figs. 3b, 9). Based
on these attributes, we differentiated between small-scale coarse- grained deltas on the shelf, sandy lobes in the basin, footwall derived fans in the footwall proximity, and large-scale dominantly muddy shelf- margin slope sedimentation connecting the sandy-muddy shelf and the deep basin. The evolution of basement subsidence was obtained from backstripped well data from various sub-basins of the Pannonian Basin
(Fig. 10), which are compared to our simulated basement subsidence
data (Fig. 11).
Synthetic seismic sections are calculated by DionisosFlow based on
the stratigraphic model results (Fig. 9) and compared with industrial
reflection seismic profiles (Figs. 12–13). Densities and seismic velocities
are assigned to each sediment classes. Sediment properties are refined by a maximum thickness of 60 m. Seismic impedance and reflection coefficient grids are calculated based on the calculated lithology grid (Appendix B). Each seismic trace is computed following the 1D convo-lution model between the reflection coefficients and a zero-phase Ricker seismic wavelet with 40 Hz dominant frequency and 2 msec sampling rate.
3. Model results
3.1. Thermo-mechanical reference model results
The reference model (Fig. 3) during the first 2 Myr of extension
shows distributed low offset upper crustal faulting and rapid litho-spheric mantle thinning due to strain localisation along the litholitho-spheric weak zone. Further extension results in strain localisation in the crust above the weak zone leading to the formation and subsidence of distinct half-graben depocenters and uplift of their footwalls. The first two half grabens form near the margin of the underlying suture zone, while younger structures form towards the centre of the basin system. Subsi-dence rates of the syn-rift depocenters show notable spatial and
tem-poral variation (Fig. 4). The first depocenter records 1 km/Myr initial
subsidence rate for 1 Myr, followed by 0.3 km/Myr for 3 Myr and a final 0.6 km/Myr rate for additional 2.5 Myr. The second depocenter records an initial 0.5 km/Myr subsidence rate for 2.5 Myr and a faster 1.5 km/ Myr subsidence for 2.5 Myr. The third, youngest depocenter also shows a three-stage subsidence pattern of 1.25 km/Myr rate for 1.2 Myr followed by a slower subsidence of 1 km/Myr for 1 Myr and a final 1.8 km/Myr subsidence rate. The upper crustal thinning is accompanied by ductile lower crustal horizontal shearing. Because localized brittle faults are accompanied by doming of the underlying ductile crust, domains of high
upper crustal thinning have a thick lower crust (Fig. 3). The rapid
asymmetric rise of the asthenosphere is associated with advective redistribution of the weak suture zone beneath the crust, which localizes deformation and controls the migration of extensional deformation from the margins towards the basin centre. This asymmetric rifting thins the crust from the initial 40 km to 17 km and the lithospheric mantle from 95 km to 30 km. After 7.2 Myr the extensional velocity is set to zero simulating the termination of syn-rift extension.
After the cessation of extension, the asthenospheric upwelling is attenuated to a more symmetrical geometry controlled by an overall post-rift cooling in the centre and by the development of small-scale convective cells beneath the basin margins. The lateral heat transport from the asthenosphere anomaly contributes to the uplift and erosion of the basin margins. Sediments are gradually re-distributed in the basin
centre resulting in elastic bending of the extended weak lithosphere
(Figs. 3, 4). This mechanism enhances differential vertical movements
during the “post-rift” phase. In fact, the oldest depocenter during the post-rift phase records slow uplift. In contrast, the basin centre records thermal subsidence with a rate gradually decreasing from 0.3 km/Myr at the onset of post-rift subsidence to 0.15 km/Myr at 18 Myr.
3.2. Thermo-mechanical parameter tests
The model with lower erosion and sedimentation coefficient (250
m2yr−1) shows an overall similar tectonic evolution to the reference
model, however, strain localization occurs at different times and
loca-tions (Fig. 4). The first half-graben forms from ca. 1.75 Myr in both
experiments, but the second and third half-grabens forms 0.5–1 Myr later in the experiment with lower erosion coefficient than in the reference model. A lower erosion coefficient implies lower erosion values of the basin margins that decreases the width of the depocenter
by ca. 25 km, which is in agreement with previous studies (Burov and
Poliakov, 2003). The lower erosion and sedimentation coefficients
create more distributed deformation and a greater distance between the
second and third half-grabens depocenters (40 km, Fig. 4). In this setup
ductile shearing of the lower crust is suppressed beneath the main
depocenters, thus brittle deformation is more dominant (Figs. 4b,c).
Furthermore, the depocenters record lower subsidence rates during both
syn- and post-rift times (Fig. 4). The first depocenter records subsidence
rates of 0.8 km/Myr, 0.2 km/Myr and 0.4 km/Myr for 1 Myr, 3 Myrs and 2.5 Myrs, respectively. The second half-graben indicates an initial slow subsidence rate of 0.5 km/Myr for 2.5 Myrs, followed by 1.1 km/Myr subsidence rate for 3 Myrs. Finally, the third depocenter shows 1 km subsidence for 1 Myr, 0.6 Myr for 1 Myr and a final subsidence rate of 1.5 km/Myr until the end of the syn-rift extension. Post-rift times show slow uplift of the oldest depocenter, while half-grabens in the basin centre record post-rift subsidence with an initial rate of 0.2 km/Myr (Fig. 4).
3.3. Basin thermal history
The evolution of the basement heat flow is extracted from the up-permost upper crustal (basement) nodes based on the product of thermal
conductivities and thermal gradients (Figs. 3, 6).The basement heat flow
evolution of the reference experiment is shown 3 Myr after the onset of extension, at the end of the syn-rift extension at 7.2 Myr and during the
post-rift phase at 18 Myr (Fig. 3a). The initial 70 mW/m2 heat flow
in-creases to 79 and 83 mW/m2 in the close vicinity of the exhumed
foot-walls of the first two half-grabens by 3 Myr. By the end of the syn-rift phase maximum basement heat flow is recorded in the half-grabens above the elevated asthenosphere reaching maximum values of 126
and 139 mW/m2. In the first half-graben the heat flow value is only
77 mW/m2. During the post-rift phase the basement heat flow is
grad-ually decreasing in the entire model domain, by 18 Myr, one large wavelength (ca. 125 km wide) elevated heat flow anomaly is shown, its
maximum is 91 mW/m2 (Fig. 3).
3.4. Stratigraphic reference model results
The reference stratigraphic model (model M1wet) shows the large accommodation space created in the first half-graben during early syn-
rift evolution (Figs. 3, 5). This subbasin is fed by the external
sedi-ment source defined at the model boundary creating alluvial to shallow
delta deposits of 1 km thickness (Fig. 3b). Footwall derived fans are
deposited at the proximity of its boundary fault with decreasing sedi-mentation rate through time. From 3Myr the second half-graben records greater subsidence rates leading to rapid transgression and greater water depth of 800 m. The water depth in the first half-graben increases to 400 m and subsequently decreases to a few tens of meters due to fast
between the first two (Figs. 3, 5b), which traps sediment arriving from the external source. This trapping basin and the uplifted footwall pre-vent sediment bypass to the third depocenter creating a starved basin that is solely sourced by its eroding footwall from this time. By the end of syn-rift times at 7.2 Myr the first half-graben is filled mostly by shallow water deltas. Deep water sediments are deposited for a short interval between ca. 6–7 Myr, when subsidence rate culminated in this area. In the most distal position from the source the second subbasin shows open-water sedimentation during the late syn-rift phase reaching a
maximum water depth of 2 km (Fig. 3). The separating footwall in the
middle of the model area has gradually subsided beneath water-level already during the syn-rift phase and from 6 Myr high energy currents simulating turbiditic currents have reached the second depocenter
(Fig. 5c). Our imposed eustatic water-level variation was mostly
over-written by tectonics during the syn-rift phase.
At the beginning of post-rift evolution ca. 1–1.75 km water depth has been inherited from the preceding syn-rift subsidence for the second and
third depocenters (Fig. 3), while the first half-graben area only records
alluvial deposition (Fig. 5). This water depth has gradually decreased
due to progradation of a large delta and shelf-margin slope system
(Fig. 5). Coarse-grained sediments are deposited on the shelf and at the
toe of the slope, while the shelf-margin slope remains mainly fine-
grained (Fig. 3). Sand lobes are transported at larger distances during
periods of wet climate, when water discharge values are increased
(Fig. 4d). During the post-rift progradation eustatic variations control
the width of the shallow water shelf and the location of the active delta system. During water-level rise and high stand conditions the shoreline retrogrades, while during sea-level fall the delta system reaches the
shelf-break (Fig. 7). Width of the shelf varies between ca. 5–40 km
(Figs. 7, 8). Finally, between 7.2 and 12 Myr the shelf-margin slope
system progrades ca. 100 km leading to alluvial sedimentation in the
entire model domain (Figs. 3, 5).
3.5. Stratigraphic model results simulating different basement geometries and climatic conditions
In the dry scenario, the overall basin evolution is similar to the reference experiment, however a few noteworthy differences need to be highlighted. During the arid climate the shallow water shelf is much narrower, in this experiment it is only 5–25 km wide, and therefore the
active delta on the shelf reach the shelf-break faster (Figs. 4d, 8).
Furthermore, due to the lower water discharge and HEST values in this dry scenario the sediments are deposited in a closer proximity to the shelf edge, turbidity currents cannot source the more distal parts of the
basin (Fig. 4d). The overall stacking pattern shows a simpler pattern of
progradation and aggradation, lobe switching, autogenic processes and
their resulted unconformities are much less frequent (Fig. 8).
In two further simulations (models M2wet and M2dry) basement subsidence and uplift rates varied along the strike of the structures
during wet and dry climatic conditions, respectively (Fig. 1c). During
the syn-rift phase the subsiding hanging walls and uplifting footwalls only cover 66% of the model width, the throw of the boundary normal fault decreases towards the model sides representing segmented struc-tures. In this setup the sedimentary transport routes are more divided
between the three depocenters (Fig. 5). During the first 3Myr coeval
sedimentation occurred in the first and second half-graben, while in the reference model high sedimentation rate has been only recorded in the second subbasin after the more proximal first subbasin was entirely
filled. (Fig. 5a,b). The youngest depocenter in the middle of the model
area also represents a trapping basin, but high energy currents reach the distal model area earlier due to the overspill point developed due to the segmented fault geometry, where deep-water currents can bypass
(Fig. 5c). This results in lower water depth values by the end of syn rift
times, reaching ca. 1.5 km. Post-rift evolution is influenced by inherited seafloor morphologies, which are balanced by open-water
sedimenta-tion and high energy currents by 11 Myr (Fig. 5d).
4. Discussion
4.1. Migration of deformation during asymmetric extension
The inherited lithospheric weak suture zone localizes extensional deformation in the form of a long living migrating detachment fault, creating dominantly asymmetric structures. During the asymmetric extension a spatial shift between the active crustal thinning and
litho-spheric thinning occurs (Lister et al., 1986; Le Pourhiet et al., 2004; Dias
et al., 2015; Lescoutre et al., 2019). The rapid lithospheric mantle
thinning facilitated by the inherited weak zone leads to none or mod-erate syn-rift subsidence during the first few million years of extension
(Fig. 4). Subsequent localization of extension in the crust leads to the
successive opening of half-grabens and syn-rift sedimentation in their
hanging walls (Figs. 3–4). Migration of deformation is controlled by the
asymmetric lithospheric thinning connected to the redistribution of the weak zone beneath the crust. The subsidence rate variations in the depocenters are controlled by the activity of the specific normal faults, migration of deformation and strain localization in a next depocenter and ductile shearing of the lower crust beneath the basins. Furthermore, a large wavelength slow subsidence is caused by crustal-scale flexure
(Lankreijer et al., 1995) of the basin from the late syn-rift time. This
subsides the previously uplifted footwall beneath water-level (Fig. 3).
In agreement with previous studies (Burov and Poliakov, 2003;
Bialas and Buck, 2009; Olive et al., 2014; Hart et al., 2017; Andr´es-
Martínez et al., 2019), our models show that higher erosion and
sedi-mentation rates lead to earlier localization of deformation from the
preceding distributed faulting and stretching phase (Figs. 4, 6). Larger
sedimentation rates lead to higher subsidence rates in the depocenters. The hanging walls and the lower crust records higher temperatures due to sediment blanketing. The hot and weak crust is more prone to lower crustal flow, enhancing the localization of deeper subbasins and modi-fying the fault spacing pattern and faulting duration in the specific half-
grabens (Figs. 4, 6).
4.2. Post-rift lithosphere and basin evolution
A short-lived uplift at the onset of the post-rift evolution is created by the rapid cessation of extension. Subsequent post-rift basin subsidence rates are dependent on the inherited crustal and lithospheric thinning and the rate of erosion and sedimentation. The highest post-rift subsi-dence rate is recorded in the experiment with an initial thicker crust and during the highest erosion and sedimentation rates, reaching an initial 0.3 km/Myr value.
The basin margins including the oldest half-graben record slow uplift
during post-rift times (Fig. 4). This is controlled by the interactions
between active asthenosphere convection, erosional unloading of the basin margins, sediment loading and lower crustal flow beneath the depocenter and by the elastic flexure of the weak extended lithosphere. Our previous parameter test on this process inferred that higher erosion rates lead to higher marginal uplift rates between 30 and 90 m/Myr. Fig. 4. Comparison of model results simulating dry (model M1dry) and wet (model M1wet) climatic conditions by implementing different erosion and sedimentation
rates in both the thermo-mechanical and stratigraphic models. (a) Basement subsidence curves are extracted from the thermo-mechanical simulation from the three depocenters. (b-c) Phase configuration and finite strain results of the thermo-mechanical models. Note that higher diffusion coefficient and thus higher erosion rate creates an overall wider basin system and larger basement subsidence in the depocenters and higher exhumation rates of its margins. White lines are isotherms. (d) Bathymetric and sedimentation rate results during the post-rift phase (at 10 Myr) in the two climatic scenarios of the stratigraphic models.
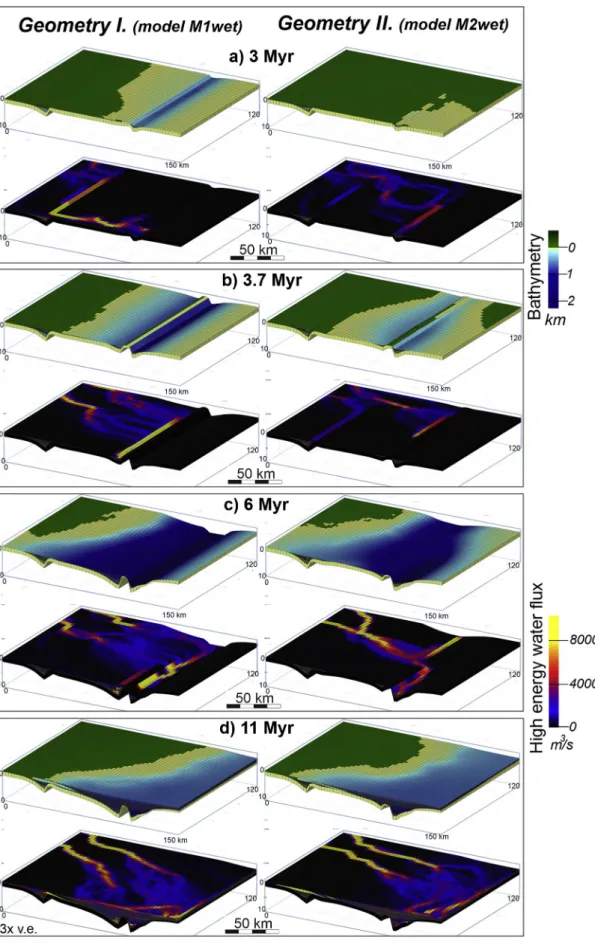
Fig. 5. Bathymetric and water flux evolution in the stratigraphic models without (Geometry I.) and with (Geometry II.) along-strike subsidence variability during wet
climatic condition (models M1wet and M2wet, respectively). Note the sediment trapping in the middle depocenter at 3.7 Myr and the subsequent bypass though an overspill point from 6 Myr.
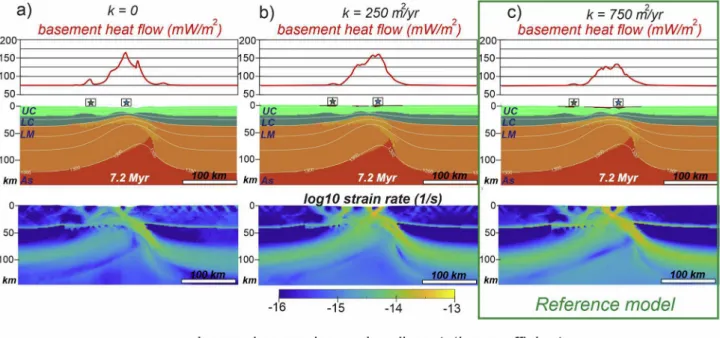
Fig. 6. The influence of surface processes on thermo-mechanical evolution. (a-c) Thermo-mechanical models with different diffusion coefficients shown after 7.2 Myr
of extension. Higher rates of erosion and sedimentation result in a more efficient localization of deformation as shown by strain rate plots. Green and blue heat flow curves are extracted from the distinct half grabens as indicated in the phase configuration figures. Sediment blanketing causes smaller peaks of the heat flow values. UC – Upper crust, LC – Lower crust, LM – Lithospheric mantle, As – Asthenosphere, WZ – mantle weak zone. (d) Modelled temperature-depth profiles are compared with averaged temperature data from boreholes in the Danube Basin part of the Pannonian Basin (modified after Lenkey et al., 2017). (For interpretation of the references to colour in this figure legend, the reader is referred to the web version of this article.)
(Bal´azs et al., 2017a). By the end of syn-rift extension small-scale mantle convection cells are induced due to the high lateral temperature gradient between the elevated asthenosphere and the colder lithospheric mantle. Such convective cells effectively heat up laterally the litho-sphere during the post-rift times, while the litholitho-sphere beneath the depocenter cools down and subside. Through time such convective cells
can be even more pronounced leading to basaltic magmatism (Ballmer
et al., 2010). In back-arc settings, due to the high extension rates
(2–4 cm/Myr; Faccenna et al., 2014), the lateral temperature gradient
and thus the convection is especially amplified. Similar small-scale
convective cells are proposed for the case of passive margins (Buck,
1986; Ramsay and Pysklywec, 2011) or in different oceanic intraplate
settings (Ballmer et al., 2010).
4.3. Thermal evolution of sedimentary basins during the syn- and post-rift phases
The thermal gradient and thus basement heat flow increases due to the gradual upwelling of the underlying asthenosphere and conductive
heat transport within the thinned lithosphere (Royden and Keen, 1980).
This well studied mechanism is mainly affected by the initial crustal and lithospheric thicknesses and the rate and duration of extension (e.g.,
Theissen and Rüpke, 2010). This mechanism creates a large wavelength
thermal anomaly and thus it decays within tens of millions of years Fig. 7. Bathymetry figures inferring stratal stacking pattern during the overall late post-rift regression. Note the shoreline advance and retreat. (a) Oblique top-view
figures show coeval transgression and regression due to laterally variable sedimentation rate. Green and orange colours indicate the shoreline and the shelf-edge at 7.5 Myr (left) and 8.1 Myr (right), respectively. Dashed lines in the right figure indicate the older lines correspond to 7.5 Myr (numerical time). (b) Zoomed figures indicate the stacking pattern and reflection terminations at different eustatic conditions. Note the difference between the shelf and the deep basin sedimentation during highstand and lowstand conditions. Thick clinoforms are built when the shelf is narrow and thus the delta system can feed the deep basin. (For interpretation of the references to colour in this figure legend, the reader is referred to the web version of this article.)
during post-rift times (e.g., Royden and Keen, 1980).
Localized crustal thinning and extensional exhumation of the foot-walls of normal faults significantly increase locally the thermal gradient
and the basement heat flow (Ter Voorde and Bertotti, 1994). The
migration of active deformation and normal faulting from the periphery of the basin towards its centre controls the variation of the highest heat
flow values within the basin system (Bal´azs et al., 2017a; Hart et al.,
2017; Lescoutre et al., 2019). The resulted thermal anomalies have a
much smaller extent and thus thermal equilibrium can be achieved within a few millions of years.
Surface processes in terms of footwall erosion and hanging-wall sedimentation also play a major role in the temporal and spatial
evo-lution of basement heat flow (e.g., Hutchison, 1985). Erosion and
sedimentation localize deformation (Burov and Poliakov, 2003; Bialas
and Buck, 2009) and thus enhance crustal exhumation and lithospheric
thinning and increase the heat flow. On the other hand, deposition of cold sediments and sediment thermal blanketing depresses the syn-rift
and steady-state heat flow (Ter Voorde and Bertotti, 1994; Theissen
and Rüpke, 2010).
In our reference experiment with a higher sedimentation rate, the top
of the basement in the most extended domain records ca. 175 ◦C, while
in the experiment with lower sedimentation rate the top basement
re-cords only ca. 110 ◦C by 18 Myr (Fig. 6). Note that the higher
sedi-mentation rate leads to greater basement subsidence and more localized thinning and thus causes a higher temperature at the top of the base-ment, but the thermal gradient and thus the heat flow is lower. The interactions between all the above-mentioned processes lead to a non- monotonous evolution and major deviations from the classical basin
modelling predictions (Royden and Keen, 1980). The basement heat
flow decreases in the subbasins located at the margins, where defor-mation has ceased, while in the basin centres, the heat flow still
in-creases until the end of the syn-rift period (Fig. 6).
Our numerical modelling results indicate a spatial and temporal shift
between the onset of extension, the onset of syn-rift sedimentation in specific half-grabens, the onset of increasing basement heat flow and the time of maximum heat flow values reached during basin evolution
(Figs. 3, 4). Basement heat flow increases first in the oldest half-grabens
that are often at the basin margins by the end of extension. Instead of a monotonous heat flow rise during the syn-rift and gradual decrease during the post-rift times, heat flow values record rapid increase periods during normal faulting superimposed on a large wavelength stagnation, fall or gradual rise depending on the location of lithospheric thinning
(Fig. 4). Heat flow values start to decrease already during the syn-rift
phase in subbasins, where normal faulting ceases and are in a distal position from the location of final lithospheric thinning. Sedimentation in depocenters also enhances lateral heat transport in the crust and thus our modelled heat flow curves are smoother. Sediment blanketing slows down the rate of post-rift cooling. During the post-rift phase the exper-iment without surface processes records the fastest cooling, the
200 mW/m2 high heat flow value decreases to 110 mW/m2 within
10Myrs, while the experiment with the highest sedimentation rate
re-cords a much lower cooling rate from a maximum 145 mW/m2 to
96 mW/m2 (Fig. 6).
4.4. Tectonic and climatic controls on syn- and post-rift sedimentary architecture
Joint tectonic and stratigraphic modelling highlights the develop-ment of prograding-retrograding sedidevelop-mentary cycles with different wavelength and temporal scales. The largest spatial scale characterizes the overall re-organization of the sedimentary system during the tran-sition from syn- to post-rift evolution. The associated short-lived basin uplift creates a pronounced unconformity marked by erosional trunca-tions of the underlying syn-rift strata and onlap and downlap termina-tions of the early post-rift sediments in the shallow water parts of the
basins (Fig. 8). However, the second and third depocenters, located at
Fig. 8. Paleobathymetric evolution of the four presented stratigraphic numerical experiments shown at 11Myr during the late post-rift period. Note the contrasting
syn- and post-rift sedimentary thicknesses in the depocenters. Red unconformity indicates the termination of the syn-rift extensional boundary velocities applied in the thermo-mechanical models. Black unconformities bounded by coastal and marine onlaps indicate autogenic lobe switching events. Red arrows indicate marine onlaps caused by toe of slope turbidite lobes. Black arrows are reflection terminations caused by lobe switching. Note that in the wet scenarios due to the rapid subsidence, the rate of accommodation creation is much larger than the rate of sedimentation during water-level rise and thus 35 km wide transgression is recorded, while in the dry scenarios, where the subsidence rate is lower mainly normal regression and aggradation is recorded. (For interpretation of the references to colour in this figure legend, the reader is referred to the web version of this article.)
larger distances from the shoreline and thus recording high water depth, only record condensed pelagic sedimentation and inherit kilometre- scale bathymetry.
The basin-fill of the first depocenter indicates two tectonically-driven
retrograding-prograding cycles during its syn-rift evolution (Fig. 3b),
which corresponds to intervals of higher and lower subsidence rates
coupled with a larger depositional rate during extension (Fig. 5a). This
cyclicity is not visible in the second and third depocenters that were underfilled during their syn-rift evolution. Similar tectonically driven
cyclicity has been reported from many extensional basins (Martins-Neto
and Catuneanu, 2010; Andri´c et al., 2017; Bal´azs et al., 2017b; Hou
et al., 2020) connected to the peak activity of normal faults. Our
modelling furthermore highlights, that depocenters located in a distal position from the sediment source can be underfilled for millions of years. This results that the tectonically driven transgressive-regressive cycles cannot be always detected in such starving syn-rift half-gra-bens. Nevertheless, opening of new sedimentary pathways by filling of an intervening trapping basin or opening of new gateways, can rapidly bring kilometre thick sediments following the preceding condensed
sedimentary record (Fig. 6c).
In classical passive margin settings, the rate of eustatic variations usually outpaces the rate of tectonically induced motion, and therefore the balance between sedimentation rate and sea-level variations control
basin architecture (Schlager, 1993; Henriksen et al., 2011). However, in
rift basins or during the early post-rift phase of extensional back-arcs the
high subsidence rates (Fig. 5) are often in the same order of magnitude
as the climatically induced lake- or sea-level variations. This means that moments of base-level fall are hidden by the ongoing high subsidence and thus the spatial and temporal variation of subsidence still controls the stratal stacking pattern and shelf-edge trajectory, like in our wet
scenario (Fig. 8). The superposition of the imposed base-level variation
of ±36 m and the modelled post-rift subsidence creates episodes of progradation and aggradation leading to stagnating and rising shelf- edge trajectories in our wet models, while in the dry models, where subsidence is lower, moments of forced regression are more visible
(Fig. 8). This is further analysed in our reference model by showing
different stages of the eustatic curve (Fig. 7). The joint effect of the post-
rift subsidence and eustatic water-level rise creates longer periods with high increase rate of accommodation, thus transgression likely develops, while relative water-level fall and forced regression is supressed or has shorter time intervals. Our experiments simulate the evolution of small- scale deltas prograding on the shelf and the progradation of the
kilometre-scale shelf margin slope clinoforms (Fig. 11; Porebski and
Steel, 2003; Sztan´o et al., 2013). During highstands, there is a wider
shallow water shelf area, where the active delta system has shifted landward, and deep-water lobes onlap the older shelf margin slope
cli-noforms (Fig. 8). A falling sea-level lead to regression, the active delta
progrades basin-wards and creates thick clinothem foresets connecting the shelf and the deep basin. During lowstands, thicker foresets and bottomsets are deposited. Rising sea-level causes rapid aggradation and retrogradation of the clinoforms, while the delta is shifted landwards again over the shelf. A similar cyclicity was previously proposed for
different passive margins or deep lacustrine shelves (Henriksen et al.,
2011; Sztan´o et al., 2013). Our experiments simulating more arid
con-ditions infer a generally narrower shelf due to lower subsidence rates. Therefore, the rate of accommodation increase is lower. This condition enables the delta system located on the shelf to reaches the shelf edge faster (Fig. 8).
Unconformities are also generated by autogenic processes (Fig. 8).
Lateral migration of the active delta system on the shelf and lobe switching creates onlap surfaces without changing the subsidence rate
or changing the externally defined water and sediment discharge (Bal´azs
et al., 2017b; Burgess et al., 2019; Harris et al., 2020; Kov´acs et al.,
2021). Our modelling also shows coeval transgression and regression
controlled by the lateral variability of sedimentation rate along the shelf
due to the migration of the delta system (Fig. 7a).
4.5. Comparison with observations from asymmetric extensional basins
The numerical models presented in this study can be compared with observations from highly extended asymmetric extensional basins dominantly sourced from one main direction, like in the case of many Mediterranean back-arc basins. The Pannonian, Aegean, Alboran and Liguro-Provencal–Thyrrenian extensional back-arc basins accommo-dated the retreat of the Vrancea, Aegean, Gibraltar and Calabrian slabs during the formation of the Carpathians, Hellenides, Betics-Rif and
Apennines orogens, respectively (e.g., Faccenna et al., 2014). Fast back-
arc extension created a series of genetically linked half-graben geome-tries in the crust, and the thin lithosphere is associated with high heat
flow values of ca. 80–145 mW/m2 (Faccenna et al., 2014; Horv´ath et al.,
2015).
Our modelled sedimentary architecture and unconformities can be
compared to high resolution seismic images (e.g., Sztan´o et al., 2013;
Leroux et al., 2014; Milia et al., 2018; Bal´azs et al., 2018a). Our
computed synthetic seismic sections (Fig. 9) show the characteristic
seismic facies of the syn-rift depocenters and post-rift deep-water marls and turbidites, clinoforms and overlying delta and alluvial environ-ments. The different marine or lacustrine sedimentary basins are char-acterized by different sediment and water discharge and different
eustatic and water-level variations (Kov´ac et al., 2007; Gong et al.,
2019), but our models provide insights into the formation of the
observed sedimentary cycles and unconformities in these basins.
4.5.1. The evolution of the Pannonian Basin
The Pannonian Basin of Central Europe (Fig. 10) is a continental
extensional back-arc basin, where the Miocene extension was mainly
controlled by slab roll-back along the Carpathians (Horv´ath and Royden,
1981). Extension followed the Mesozoic opening and subsequent closure
of the Alpine Tethys and the northern branch of the Neotethys oceanic
realms (e.g., Csontos and V¨or¨os, 2004). By the end of Paleogene times
continental collision resulted in an orogenic area with thickened crust. The pre-Neogene basement of the present Pannonian Basin is composed of two distinct mega-units, i.e., the ALCAPA and Tisza-Dacia, with different paleogeographic positions, derived from the Alpine and
Dinaridic orogenic systems (e.g., Csontos and V¨or¨os, 2004). The two
mega-units were affected by different extensional kinematics and coeval counter clockwise and clockwise rotations in ALCAPA and Tisza-Dacia,
respectively, during their syn-rift evolution (Balla, 1987; Fodor et al.,
1999; Kov´ac et al., 2007). Available estimates on the amount of
exten-sion are in the order of 150–250 km (Ustaszewski et al., 2010; Matenco
et al., 2016; Bal´azs et al., 2018b). Both mega-units show the migration of
extensional deformation from the basin margins and the formation of a
series of half-grabens with variable subsidence rates (Fig.1). The gradual
Miocene subsidence of hanging-walls and the exhumation of footwalls in individual structures created an initial archipelago paleogeography in
the larger Pannonian area (Nagymarosy and H´amor, 2012; Pavelic and
Kovacic, 2018). The last stages of major deformation and highest
sub-sidence rates were recorded in the Danube Basin (Sztan´o et al., 2016;
ˇ
Sujan et al., 2018) in the ALCAPA mega-unit, and in the central Great
Hungarian Plain part of the Tisza-Dacia mega-units (Fig. 1; Tari et al.,
1999; Bal´azs et al., 2018b).
Following a short-lived regional uplift event between the middle and late Miocene the Pannonian Basin was paleo-geographically isolated from the larger Paratethys realm that created a major environmental
change and the birth of the endemic Lake Pannon (Magyar et al., 2013).
The basin fill recorded an initial transgression followed by large-scale progradation over 400 km between 10 and 4 Ma from the NW and NE
in a S-SE direction (Magyar et al., 2013). This progradation created a
diachronous lithostratigraphy (Juh´asz, 1991; Sztan´o et al., 2013)
vary-ing from alluvial and delta plain to open-water deposition, well
con-strained by reflection seismic data (Juh´asz, 1991; Pigott and
4.5.2. Model implications for the evolution of the Pannonian Basin
In the Pannonian Basin, in agreement with our modelling results, oldest early and middle Miocene depocenters are presently located at the periphery of the larger Pannonian Basin system, while the youngest and deepest half-graben geometries, such as the Mak´o Trough formed during early Late Miocene times in the centre of the Great Hungarian
Plain (Fig. 1). The older subbasins at the basin margins (Fig. 1), such as
the Styrian Basin (Ebner and Saschenhofer, 1995), westernmost Danube
Basin (Fig. 10) or the Miocene basins along the Transdanubian Range
and North Hungarian Mountains, East Slovakian Basin or depocenters in the vicinity of the Apuseni Mountains all record present-day uplift
(Dunkl and Frisch, 2002; Fodor et al., 2005; Ruszkiczay-Rüdiger et al.,
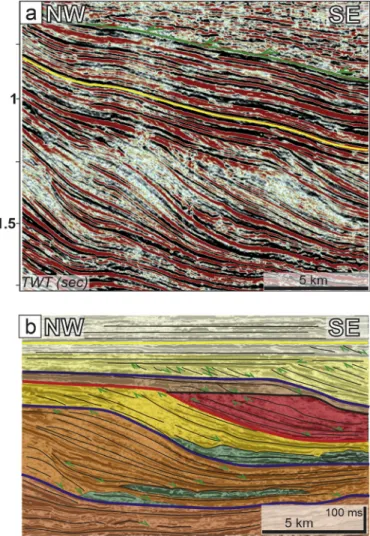
Fig. 9. Stratigraphic model results imposing wet climatic conditions and along-strike subsidence variations (model m2wet) during early post-rift times and at the end
of the simulation. Compare the characteristic seismic facies units of the synthetic seismic data with the seismic section (Figs. 12–13) from the western part of the Pannonian Basin. Red line in the bathymetric figures indicate a shelf margin slope clinoform deposited at 8 Myr and subsequently deeply buried and compacted. Top right image shows the simulated well location of Fig. 11. (For interpretation of the references to colour in this figure legend, the reader is referred to the web version of this article.)
2005; Bada et al., 2007; Bal´azs et al., 2018a). The long-term post-rift uplift of the basin margins is caused in our models by the lateral heat transport from the asthenosphere upwelling and by lithospheric flexure due to sediment unloading from the margins and deposition in the basin
centre (Bal´azs et al., 2017a). Sediment re-distribution also contributes to
ductile deformation of the weak lower crust, locally accentuating
dif-ferential vertical movements (Burov and Poliakov, 2003). This process is
especially effective during wet climate (Fig. 5c). Uplift and erosional
truncation of the late Miocene sediments at the basin margins (Fig. 10)
and increased subsidence and sedimentation in the local depocenters
(Sztan´o et al., 2013; Horv´ath et al., 2015) are in good agreement with
this proposed post-rift mechanism. In the case of the Pannonian Basin neotectonic inversion and positive reactivation of Miocene normal faults
accentuates the uplift of the southwestern margins of the basin (Fodor
et al., 2005; Bada et al., 2007).
Our modelled heat flow evolution (Fig. 4) takes into account the
large-scale lithospheric thinning and crustal scale thermal anomalies due to local normal faults and detachments during the syn-rift phase inferring a highly variable pattern in the different depocenters. Our reference model infers an exponential decrease from a maximum
150–140 mW/m2 to the present-day values of ca. 80–110 mW/m2
following post-rift cooling and the deposition of thick post-rift sediment. These values are in agreement with present-day temperature measure-ments from the Danube Basin part of the larger Pannonian Basin system
(Fig. 4; Horv´ath et al., 2015; Lenkey et al., 2017).
Our stratigraphic model results of genetically linked half-graben depocenters and their sedimentation from one dominant direction shows a similar tectono-stratigraphic architecture to the Danube Basin area in the ALCAPA mega-unit in the West and with the Great Hungarian
Plain in the Southeast parts of the Tisza-Dacia mega-unit (Fig. 10). Syn-
rift depocenters that were located in the proximity of their source
re-gions recorded high sedimentation, like the Zsira Trough (Fig. 12),
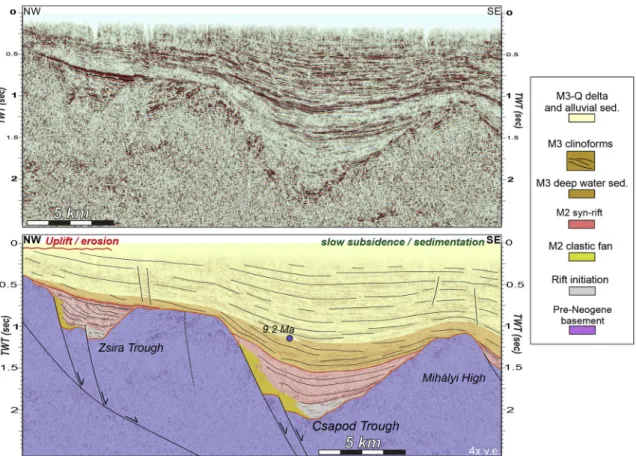
Fig. 10. (a) Tectonic map of the Pannonian Basin system, indicating the main Miocene extensional structures. Db = Danube Basin, TDR = Transdanubian Range,
NHM – North Hungarian Mountains, Vb = Vienna Basin, Sa = Sava Subbasin, Dr. = Dr´ava Subbasin, Ki = Kiskuhalas Subbasin, Ma = Mak´o Subbasin, Be = B´ek´es Subbasin, J´aszsag Subbasin, Sb = Styrian Subbasin, Sze = Szeged Subbasin. Note the suture zones at the Dinaridic and Carpathian margins of the basin. Pre-Neogene basement map is modified after Schmid et al. (2008). (b) Interpreted composite section through the southern parts of the basin. Upper crustal geometry is based on seismic interpretation (cf. Bal´azs et al., 2017a). The Sava suture zone in mapped at the Dinaridic margin.
Kiskunhalas Trough or subbasins along the Dinaridic margin (Fig. 10). These depocenters show similar tectonics controlled transgressive- regressive cycles (Bal´azs et al., 2017b; Andri´c et al., 2017) like our
modelled cyclicity in the half-graben (no. 1 in Fig. 3). However,
depo-centers located at large distances from the main sediment sources during
their syn-rift evolution, such as the late Miocene Mak´o Trough (Fig. 1) or
the central Danube Basin were likely characterized by ca. 1.5 km paleo- bathymetry as sedimentation did not take pace with the fast subsidence
during its rift climax (Sztan´o et al., 2013; Bal´azs et al., 2017b).
Never-theless, cyclicity of the sedimentation rate is also predicted in all these
situations (Fig. 11). In all these basins the exhumed footwall sources the
neighbouring depocenters by coarse breccias during or after the activity
of the boundary faults (Sztan´o et al., 2013; Sebe et al., 2019). As the
topographic high is progressively eroded, the sediments ultimately bypass and are deposited over the footwall. The models predict that the diachronous transition from syn- to post-rift times were associated with great water depth up to 1600 m in the depocenters, while the more proximal areas experienced exposure and erosion.
Our modelled progradation of large-scale shelf-margin slope clino-forms connecting the shelf and the deep basin and small prograding
deltas on the shelf is in agreement with observations from the Pannonian
Basin (Csat´o et al., 2013; Magyar et al., 2013; Sztan´o et al., 2013). The
decompacted height of these clinoforms is ca. 600–1000 m with a dip
angle of ca. 3–8 degrees (Fig. 11; Bal´azs et al., 2018a) which is similar to
our model result (Figs. 8–9). The maximum water depth was probably
even higher in the most distal and continuously subsiding areas, such as the Danube Basin or Mak´o Trough, where deep water marl and turbidite deposition decreased the water depth from a maximum 1500 m below
1000 m (Sztan´o et al., 2013; Bal´azs et al., 2017b). Sediment overburden
and compaction of the slope sediment decreases their thickness from the
maximum 1000 m to ca. 600 m (Figs. 9, 11). In the Danube Basin, the
differential compaction decreased the clinoform height from 650 m to
340 m and created a folded geometry (Fig. 9). Our simulated periods of
increased and decreased sedimentation rates resemble the initial pelagic or profundal environment, the subsequent events of turbidite lobes deposition and shelf-slope sedimentation and the final slowing of
sedi-mentation in an alluvial environment (Fig. 11). Higher order
sedimen-tation rate variation (Fig. 11) is connected to lobe switching events (see
also Uhrin and Sztan´o, 2011).
Finally, our modelled basin architecture shows the large-scale
Fig. 11. (a) Backstripped well data, i.e., sediment loaded basement subsidence curves from different Pannonian Basin depocenters. (b) Sediment loaded basement
subsidence curves from the numerical model m2wet from the centremost half-graben. For the simulated well location see Fig. 9. Note the original and compacted thickness of the stratigraphic units shown by the bars in the sedimentation rate figure.