HAL Id: hal-00327959
https://hal.archives-ouvertes.fr/hal-00327959
Submitted on 30 Aug 2005HAL is a multi-disciplinary open access
archive for the deposit and dissemination of sci-entific research documents, whether they are pub-lished or not. The documents may come from teaching and research institutions in France or abroad, or from public or private research centers.
L’archive ouverte pluridisciplinaire HAL, est destinée au dépôt et à la diffusion de documents scientifiques de niveau recherche, publiés ou non, émanant des établissements d’enseignement et de recherche français ou étrangers, des laboratoires publics ou privés.
A review of measurement-based assessment of aerosol
direct radiative effect and forcing
H. Yu, Y. J. Kaufman, M. Chin, G. Feingold, L. A. Remer, T. L. Anderson,
Yves Balkanski, N. Bellouin, O. Boucher, S. Christopher, et al.
To cite this version:
H. Yu, Y. J. Kaufman, M. Chin, G. Feingold, L. A. Remer, et al.. A review of measurement-based assessment of aerosol direct radiative effect and forcing. Atmospheric Chemistry and Physics Discus-sions, European Geosciences Union, 2005, 5 (4), pp.7647-7768. �hal-00327959�
ACPD
5, 7647–7768, 2005
Measurement-based aerosol direct forcing
H. Yu et al. Title Page Abstract Introduction Conclusions References Tables Figures J I J I Back Close
Full Screen / Esc
Print Version Interactive Discussion
EGU
Atmos. Chem. Phys. Discuss., 5, 7647–7768, 2005 www.atmos-chem-phys.org/acpd/5/7647/
SRef-ID: 1680-7375/acpd/2005-5-7647 European Geosciences Union
Atmospheric Chemistry and Physics Discussions
A review of measurement-based
assessment of aerosol direct radiative
e
ffect and forcing
H. Yu1,2, Y. J. Kaufman1, M. Chin1, G. Feingold3, L. A. Remer1, T. L. Anderson4, Y. Balkanski5, N. Bellouin6, O. Boucher6,12, S. Christopher7, P. DeCola8,
R. Kahn9, D. Koch10, N. Loeb11, M. S. Reddy12,13, M. Schulz5, T. Takemura14, and M. Zhou15
1
Laboratory for Atmospheres, NASA Goddard Space Flight Center (GSFC), Greenbelt, USA
2
Goddard Earth Science and Technology Center, University of Maryland, Baltimore County, Baltimore, USA
3
NOAA Environmental Technology Laboratory (ETL), Boulder, USA
4
University of Washington, Seattle, USA
5
Laboratoire des Sciences du Climat et de l’Environnement, CEA/CNRS – LSCE, L’Orme des Merisiers, France
6Met Office, Exeter, UK 7
University of Alabama, Huntsville, USA
8
NASA Headquarters, Washington, D.C., USA
9
NASA Jet Propulsion Laboratory (JPL), Pasadena, USA
10
NASA Goddard Institute for Space Studies (GISS), New York, USA
11
NASA Langley Atmospheric Research Center (LaRC), Hampton, USA © 2005 Author(s). This work is licensed under a Creative Commons License.
ACPD
5, 7647–7768, 2005
Measurement-based aerosol direct forcing
H. Yu et al. Title Page Abstract Introduction Conclusions References Tables Figures J I J I Back Close
Full Screen / Esc
Print Version Interactive Discussion
EGU
12
Laboratoire d’Optique Atmosph ´erique (LOA), Villeneuve d’Ascq, France
13
NOAA Geophysical Fluid Dynamics Laboratory (GFDL), Princeton, USA
14
Kyushu University, Fukuoka, Japan
15
Georgia Institute of Technology, Atlanta, USA
Received: 27 May 2005 – Accepted: 27 June 2005 – Published: 30 August 2005 Correspondence to: H. Yu (hyu@climate.gsfc.nasa.gov)
ACPD
5, 7647–7768, 2005
Measurement-based aerosol direct forcing
H. Yu et al. Title Page Abstract Introduction Conclusions References Tables Figures J I J I Back Close
Full Screen / Esc
Print Version Interactive Discussion
EGU Abstract
Aerosols affect the Earth’s energy budget “directly” by scattering and absorbing ra-diation and “indirectly” by acting as cloud condensation nuclei and, thereby, affecting cloud properties. However, large uncertainties exist in current estimates of aerosol forc-ing because of incomplete knowledge concernforc-ing the distribution and the physical and
5
chemical properties of aerosols as well as aerosol-cloud interactions. In recent years, a great deal of effort has gone into improving measurements and datasets. It is thus fea-sible to shift the estimates of aerosol forcing from largely model-based to increasingly measurement-based. Here we assess the aerosol optical depth, direct radiative ef-fect (DRE) by natural and anthropogenic aerosols, and direct climate forcing (DCF) by
10
anthropogenic aerosols, focusing on satellite and ground-based measurements sup-plemented by global chemical transport model (CTM) simulations. The multi-spectral MODIS measures global distributions of aerosol optical thickness (τ) on a daily scale, with a high accuracy of ±0.03±0.05τ over ocean. The annual average τ is about 0.14 over global ocean, of which about 21% is contributed by human activities, as
deter-15
mined by MODIS fine-mode fraction. The multi-angle MISR derives an annual average AOT of 0.23 over global land with an uncertainty of ∼20% or ±0.05. These high-accuracy aerosol products and broadband flux measurements from CERES make it feasible to obtain observational constraints for the aerosol direct effect, especially over global ocean. A number of measurement-based approaches estimate the clear-sky
20
DRE (on solar radiation) at the top-of-atmosphere (TOA) to be about −5.5±0.2 Wm−2 (median ± standard error) over global ocean. Accounting for thin cirrus contamina-tion of the satellite derived aerosol field will reduce the TOA DRE to −5.0 Wm−2. Be-cause of a lack of measurements of aerosol absorption and difficulty in characterizing land surface reflection, estimates of DRE over land and at the ocean surface are
cur-25
rently realized through a combination of satellite retrievals, surface measurements, and model simulations, and are less constrained. Over the ocean surface, the DRE is esti-mated to be −8.8±0.4 Wm−2. Over land, an integration of satellite retrievals and model
ACPD
5, 7647–7768, 2005
Measurement-based aerosol direct forcing
H. Yu et al. Title Page Abstract Introduction Conclusions References Tables Figures J I J I Back Close
Full Screen / Esc
Print Version Interactive Discussion
EGU
simulations derives a DRE of −4.9±0.7 Wm−2and −11.8±1.9 Wm−2 at the TOA and surface, respectively. CTM simulations derive a wide range of DRE estimates that on average are smaller than the measurement-based DRE by about 30–40%, even after accounting for thin cirrus and cloud contamination.
Despite these achievements, a number of issues remain open and more efforts are
5
required to address them. Current estimates of the aerosol direct effect over land are poorly constrained. Uncertainties of DRE estimates are also larger on regional scales than on a global scale and large discrepancies exist between different approaches. The characterization of aerosol absorption and vertical distribution remains challeng-ing. The aerosol direct effect in the thermal infrared range and under cloudy condition
10
remains relatively unexplored and quite uncertain, because of a lack of global system-atic aerosol vertical profile measurements. A coordinated research strategy needs to be developed for integration and assimilation of satellite measurements into models to constrain model simulations. Hopefully, enhanced measurement capabilities in the next few years and high-level scientific cooperation, will further advance our knowledge.
15
1. Introduction
Aerosols participate in the Earth’s energy budget “directly” by scattering and absorb-ing radiation (McCormick and Ludwig, 1967; Charlson and Pilat, 1969; Atwater, 1970; Mitchell Jr., 1971; Coakley et al., 1983) and “indirectly” by acting as cloud condensation nuclei and, thereby, affecting cloud properties (Twomey, 1977; Albrecht, 1989;
Rosen-20
feld and Lensky, 1998). Moreover, the direct absorption of radiant energy by aerosols can influence the atmospheric temperature structure and, thereby, cloud formation -a phenomenon th-at h-as been l-abeled the “semi-direct effect” (Hansen et al., 1997; Ackerman et al., 2000; Koren et al., 2004). The addition of anthropogenic aerosols to the atmosphere may change the radiative fluxes at the top-of-atmosphere (TOA),
25
at the surface, and within the atmospheric column. A positive radiative effect at the TOA indicates addition of the energy to the earth-atmosphere system (i.e., a warming
ACPD
5, 7647–7768, 2005
Measurement-based aerosol direct forcing
H. Yu et al. Title Page Abstract Introduction Conclusions References Tables Figures J I J I Back Close
Full Screen / Esc
Print Version Interactive Discussion
EGU
effect) whereas a negative effect indicates a net loss of energy (i.e., a cooling effect). Herein, we designate radiative perturbations by anthropogenic aerosols (both directly and indirectly) as “aerosol climate forcing (ACF)” and distinguish this from the “aerosol radiative effect (ARE) of the total aerosol (natural plus anthropogenic)”. This review will focus on aerosol direct radiative effect (DRE) by the total aerosol and aerosol direct
5
climate forcing (DCF) by the anthropogenic aerosol.
Recent reports summarize that the overall forcing by anthropogenic aerosols (ACF) is likely to be negative and may be comparable in magnitude to the positive forc-ing of about 2.4 Wm−2 by anthropogenic greenhouse gases (IPCC, 2001; Haywood and Boucher, 2001).Aerosol forcing assessments to date have been based largely on
10
model calculations, although these models have been initialized and evaluated to some degree with satellite and surface measurements. Large uncertainties exist in current estimates of aerosol forcing because of incomplete knowledge concerning the distri-bution and the physical and chemical properties of aerosols as well as aerosol-cloud interactions. The uncertainty for the aerosol direct climate forcing (DCF) is about a
fac-15
tor of 2 to 3 whereas that for the indirect forcing is much larger and difficult to quantify (IPCC, 2001; Haywood and Boucher, 2001). These uncertainties raise questions about the interpretation of the 20th century temperature record (Anderson et al., 2003a) and complicate the assessment of aerosol impacts on surface-atmosphere interactions, the atmospheric boundary layer (Yu et al., 2002), global surface air temperatures
(Charl-20
son et al., 1992; Penner et al., 1992; Kiehl and Briegleb, 1993; Hansen et al., 1997), the hydrological cycle (Ramanathan et al., 2001a), photochemistry (Dickerson et al., 1997), and ecosystems (Chameides et al., 1999). Accordingly, the US Climate Change Research Initiative (CCRI) has specifically identified research on atmospheric concen-trations and effects of aerosols as a top priority (NRC, 2001).
25
Reduction in these uncertainties requires a coordinated research strategy that will successfully integrate data from multiple platforms (e.g., ground-based networks, satel-lite, ship, and aircraft) and techniques (e.g., in-situ measurement, remote sensing, nu-merical modeling, and data assimilation) (Penner et al., 1994; Heintzenberg et al.,
ACPD
5, 7647–7768, 2005
Measurement-based aerosol direct forcing
H. Yu et al. Title Page Abstract Introduction Conclusions References Tables Figures J I J I Back Close
Full Screen / Esc
Print Version Interactive Discussion
EGU
1996; Kaufman et al., 2002a; Diner et al., 2004; Anderson et al., 2005). In recent years, a great deal of effort has gone into improving measurements and data sets, including the establishment of ground-based networks, the development and imple-mentation of new and enhanced satellite sensors, and the execution of intensive field experiments in various aerosol regimes around the globe (e.g., Kahn et al., 2004a).
5
As a result of these efforts it is now feasible to shift the estimates of DRE and DCF from largely model-based to increasingly measurement-based. In this new approach, satellite measurements provide the basis for the regional- to global-scale assessments and chemical transport models are used to interpolate and supplement the data in regions/conditions where observational data are not available. Measurements from
10
ground-based networks and intensive field experiments are required for evaluating both the satellite retrievals and the model simulations. Model simulation is an indispensable tool for estimating past aerosol forcing and projecting future climate due to changes in atmospheric aerosols and observations can be used to improve and constrain model simulations of aerosol impacts through synthesis and integration (e.g., Collins et al.,
15
2001; Yu et al., 2003). AEROCOM, an international initiative of scientists interested in aerosols and climate (http://nansen.ipsl.jussieu.fr/AEROCOM/), is documenting and intercomparing more than a dozen models and a large number of observations to iden-tify and reduce the uncertainty in current global aerosol assessments (Kinne et al., 2005; Textor et al., 2005).
20
The US Climate Change Science Program (CCSP) is developing and extending its research activities to support policymaking and adaptive management. The present review is one of three aerosol-related reports being prepared for CCSP. The pur-poses of this review are (1) to review measurement-based understanding of tropo-spheric aerosol and their direct effects; (2) to estimate uncertainty associated with
25
them through examining the differences among various estimates; and (3) to explore the use of recent measurements to improve the performance of model simulations. Specifically, we will:
ACPD
5, 7647–7768, 2005
Measurement-based aerosol direct forcing
H. Yu et al. Title Page Abstract Introduction Conclusions References Tables Figures J I J I Back Close
Full Screen / Esc
Print Version Interactive Discussion
EGU
chemical transport models.
– Assess the anthropogenic component, using satellite data and models.
– Evaluate these assessments against surface network data and field experiments
and compare them to model estimates.
Section 2 is an overview of factors determining DRE and DCF and of recent progress
5
characterizing these factors. Global and regional comparisons among different mea-surements/simulations are presented in Sect. 3 for aerosol optical depth, DRE and DCF (solar and clear-sky). We discuss outstanding issues in Sect. 4. Our findings are summarized in Sect. 5.
2. Recent progress in characterizing tropospheric aerosols and assessing the
10
aerosol direct effect
The aerosol direct radiative effect and its potential influences on climate were pro-posed and debated during the late 1960s and early 1970s (e.g., McCormick and Lud-wig, 1967; Charlson and Pilat, 1969; Atwater, 1970; Mitchell Jr., 1971). The interac-tions between aerosols and solar radiation are determined by a combination of aerosol
15
properties (loading, chemical composition, size distribution, shape), surface properties (e.g., spectral and angular variations of surface albedo), clouds (cloud fraction, optical depth, and vertical distribution), and geographical parameters (latitude, season). As-sumptions associated with radiative transfer (RT) modeling also influence the assess-ment of the aerosol direct effect. For lack of data and computational resources, even
20
the sign of the aerosol effect on global radiation (warming or cooling) was uncertain. Nevertheless, these pioneering studies highlighted the importance of acquiring better information concerning aerosols, and thereby inspired substantial research efforts in the intervening decades. Below is an overview of how a variety of factors determine the aerosol direct effect and how recent observations have advanced our knowledge.
ACPD
5, 7647–7768, 2005
Measurement-based aerosol direct forcing
H. Yu et al. Title Page Abstract Introduction Conclusions References Tables Figures J I J I Back Close
Full Screen / Esc
Print Version Interactive Discussion
EGU
2.1. Aerosol optical properties
The complex interaction of aerosols with radiation is usually understood using three op-tical parameters: aerosol opop-tical thickness or depth (AOT, AOD, τ), the single-scattering albedo (SSA, ω0), and the phase function. Aerosol optical thickness measures the magnitude of aerosol extinction (due to scattering and absorption) integrated in the
5
vertical column. It is an e-folding length of the decrease of direct beam when trav-eling through the aerosol layer. Single-scattering albedo (SSA or ω0) is the ratio of the scattering coefficient to the extinction coefficient, measuring the relative impor-tance of scattering and absorption. The aerosol effect on the TOA radiative budget switches from net cooling to net warming at a certain value of SSA, depending on
sur-10
face albedo (e.g., Charlson and Pilat, 1969; Atwater, 1970; Mitchell Jr., 1971; Hansen et al., 1997). The angular distribution of scattering radiation is described by the phase function, i.e., a ratio of the scattered intensity at a specific direction to the integral of the scattered intensity at all directions. In principle, given the size distribution of an assumed spherical aerosol, the phase function can be calculated from Mie theory (van
15
de Hulst, 1981; Bohren and Huffman, 1983). In practice, approximations such as the Henyey-Greenstein (HG) phase function (Henyey and Greenstein, 1941) have been used in most radiative transfer models (e.g., Fu and Liou, 1993). The HG phase func-tion is defined in terms of a single parameter – the asymmetry factor (g) – with g=1 for completely forward scattering and g=0 for symmetric (e.g. Rayleigh) scattering. Typical
20
values of g range from 0.5 to 0.8.
These aerosol optical properties vary with the wavelength of radiation. The wavelength-dependence of optical depth is usually represented by the ˚Angstr ¨om expo-nent ( ˚Angstr ¨om, 1929, 1930), with high values of ˚Angstr ¨om exponent indicative of small particles and low values representative of large particles. Generally, at visible
wave-25
lengths, the single-scattering albedo decreases with wavelength for non-dust aerosols and increases for dust aerosols (Dubovik et al., 2002). The asymmetry factor g de-creases with wavelength because of the decrease in the scattering-effective particle
ACPD
5, 7647–7768, 2005
Measurement-based aerosol direct forcing
H. Yu et al. Title Page Abstract Introduction Conclusions References Tables Figures J I J I Back Close
Full Screen / Esc
Print Version Interactive Discussion
EGU
size (e.g., Hansen and Travis, 1974).
Aerosol optical properties also depend strongly on the size distribution. Therefore any factors affecting the size distribution will impact the optical properties. One criti-cal factor is the relative humidity (RH). Some aerosol types are hygroscopic, meaning that they grow as they take up water vapor. As a result, their size increases and their
5
refractive indices change, in turn leading to changes in their optical properties. This effect is non-linear and varies with aerosol composition. For example, as RH increases from 40% to 80%, the scattering cross section of sulfate-dominated aerosol doubles, whereas it increases by only 10–40% for smoke over the same RH range (Hobbs et al., 1997; Kaufman et al., 1998). The response of the absorption coefficient to increasing
10
RH is uncertain, although theoretical studies indicate it should be much smaller than that for the scattering coefficient (Redemann et al., 2001). Consequently, for hygro-scopic aerosol, SSA increases with RH. In addition, g increases with increasing RH and particle size.
In contrast to greenhouse gases, aerosol loading and optical properties exhibit large
15
spatial and temporal variability. Due to variability in sources and sinks, different aerosol components are associated with different geographical areas, and the residence time in the troposphere is relatively short (about 1 week). The vertical distribution of aerosol varies substantially, which is determined by injection height and a variety of atmo-spheric processes. Such variations complicate the estimate of aerosol direct effect
20
under cloudy skies and in the thermal infrared region. The way of mixing of different species in aerosols can have a significant effect on aerosol optical properties. In real-ity, different chemical species can be in the same particles (internal mixing) or different particles (external mixing). While mixture state has little effect on the scattering and/or asymmetry factor (e.g., Chylek et al., 1995; Pilinis et al., 1995; McMurry et al., 1996;
25
Malm and Kreidenweis, 1997), it can have a great effect on the absorption efficiency. Light absorption of a mixture of black carbon and transparent particles is significantly higher for internal mixing than for external mixing, resulting in a smaller SSA (Horvath, 1993; Chylek et al., 1995; Jacobson, 2000, 2001) and higher absorption efficiency
ACPD
5, 7647–7768, 2005
Measurement-based aerosol direct forcing
H. Yu et al. Title Page Abstract Introduction Conclusions References Tables Figures J I J I Back Close
Full Screen / Esc
Print Version Interactive Discussion
EGU
(Martins et al., 1998).
Errors in the estimation of aerosol optical properties can have a tremendous impact on the estimate of aerosol direct radiative effect. In recent years, the characterization of aerosols has been significantly improved through intensive field experiments, ground-based network, satellite remote sensing and its integration with model simulations, as
5
summarized in the following. 2.1.1. Ground-based networks
AERONET: The AEROsol Robotic Network (AERONET) program is a federated
re-mote sensing network of well-calibrated sun photometers and radiometers. AERONET includes about 200 sites around the world, covering all major tropospheric aerosol
10
regimes (Holben et al., 1998, 2001). Spectral measurements of sun and sky radiance are calibrated and screened for cloud-free conditions (Smirnov et al., 2000). AERONET stations provide direct, calibrated measurements of spectral AOD (normally at wave-lengths of 440, 670, 870, and 1020 nm) and provide inversion-based retrievals of a variety of effective, column-mean properties such as single-scattering albedo, and size
15
distributions, phase function and asymmetry factor (Holben et al., 1998, 2001; Dubovik et al., 2000, 2002; Dubovik and King, 2001). Because of uniform calibration, cloud-screening, and retrieval methods, uniform data are available for all stations, some of which have operated for over 10 years. These data constitute a high-quality, ground-based aerosol climatology and, as such, have been widely used for aerosol process
20
studies, as well as for evaluation and validation of model simulation and satellite remote sensing applications (e.g., Chin et al., 2002; Yu et al., 2003; Remer et al., 2005; Kahn et al., 2005a). It should be noted, however, that the inversion-based retrieval products have yet to be systematically validated by comparison to in situ measurements.
IMPROVE: The Interagency Monitoring of Protected Visual Environments
(IM-25
PROVE) network was established by the federal land management agencies and the Environmental Protection Agency in 1985 (Malm et al., 1994). The network has been expanded to 165 sites by 2003 and tracks spatial and temporal trends of visibility and
ACPD
5, 7647–7768, 2005
Measurement-based aerosol direct forcing
H. Yu et al. Title Page Abstract Introduction Conclusions References Tables Figures J I J I Back Close
Full Screen / Esc
Print Version Interactive Discussion
EGU
aerosols in rural areas and National Parks (Malm et al., 2004). Each site collects 24-h PM2.5 (particulate matter wit24-h aerodynamic diameter less t24-han 2.5 µm) and PM10 (particulate matter with diameter less than 10 µm) samples every three days. The PM2.5 samples are analyzed for mass, elemental composition, ions, and organic and elemental carbon. These data are used to reconstruct the major aerosol species of
5
fine particles, identifying sulfate, nitrate, organic mass by carbon, light-absorbing car-bon, and fine soil. By assuming species-dependent mass extinction efficiencies and hygroscopic growth curves, the extinction coefficients can be calculated. While such near-surface extinction data can be readily compared with model simulations, assump-tions of aerosol vertical profiles are needed to derive the columnar optical properties
10
that lead to estimates of aerosol direct effects and forcings.
MFRSR: The multifilter rotating shadowband radiometer (MFRSR) has been widely
used in recent years because of its automated operation and relatively low cost (Har-rison et al., 1994). Several networks operate about a hundred instruments providing good geographical coverage of the United States. The MFRSR measures the direct
15
solar beam extinction and horizontal diffuse flux at six visible and near-infrared wave-lengths (nominally 415, 500, 615, 670, 870, and 940 nm) at 1-min intervals throughout the day. It uses an automated, objective, and computationally efficient cloud screening algorithm (Alexandrov et al., 2004a). The calibration-retrieval method has been devel-oped to derive aerosol optical depth and particle size (Alexandrov et al., 2002a, b).
20
Again, the retrieved size distributions have not been validated by comparison to in situ measurements.
NOAA/CMDL aerosol network: Aerosol measurements began at the NOAA
Cli-mate Modeling and Diagnostic Laboratory (CMDL) baseline observatories in the mid-1970’s. In the 1990’s, the research program expanded to establish regional stations
25
for monitoring the influence of regional sources on the statistics and trends of aerosol optical properties (e.g., Sheridan and Ogren, 1999). Starting in March 2000, a similar instrument package has been operated from a light aircraft, obtaining in-situ aerosol profiles (IAP). Since then it has flown over the Southern Great Plain at altitudes
be-ACPD
5, 7647–7768, 2005
Measurement-based aerosol direct forcing
H. Yu et al. Title Page Abstract Introduction Conclusions References Tables Figures J I J I Back Close
Full Screen / Esc
Print Version Interactive Discussion
EGU
tween 500 m and 3500 m several times per week. In addition to the routine mea-surements at the long-term baseline and regional stations, short-term meamea-surements have also been conducted in conjunction with several aerosol field experiments. The NOAA/CMDL network directly measures light absorption, total scattering and backscat-tering, particle number concentration and chemical composition (Quinn et al., 2000),
5
making it feasible to link chemical measurements to physical measurements. These measurements are used to derive parameters required for aerosol forcing calculation (Delene and Ogren, 2002) and also to provide ground-truth for satellite remote sensing and input for global models.
Meteorological stations: Broadband direct solar radiation is measured at
mete-10
orological stations around the world. These long-term observations can be used to derive average aerosol optical depth over the solar spectrum, thus having the potential to detect changing atmospheric conditions on a decadal scale. For example, Luo et al. (2001) have applied a retrieval method to derive aerosol optical depth at 46 Class A solar radiation stations over China and analyzed the trend of aerosol optical depth
15
from 1961 to 1990. The accuracy of such retrieved aerosol optical depth depends on the quality of the observations, including cloud-screening procedures and parame-terizations of Rayleigh scattering, gaseous absorption, and aerosol extinction. These aerosol optical depth retrievals from meteorological stations still need to be evaluated using independent measurements from other surface observations, such as AERONET
20
and MFRSR.
Lidar networks: In recent years, Raman Lidar and micro-pulse lidar (MPL) have
been increasingly used to automatically and routinely retrieve profiles of aerosol backscattering and extinction during both day and night (e.g., Turner et al., 2001, 2002; Ferrare et al., 2001). The aerosol extinction profiles so-derived are pivotal to a better
25
assessment of aerosol direct solar forcing under cloudy sky conditions, aerosol thermal infrared forcing and aerosol-cloud interactions (Feingold et al., 2003). Several regional aerosol lidar networks are emerging, including EARLINET, MPLNET, REALM, and AD-Net.
ACPD
5, 7647–7768, 2005
Measurement-based aerosol direct forcing
H. Yu et al. Title Page Abstract Introduction Conclusions References Tables Figures J I J I Back Close
Full Screen / Esc
Print Version Interactive Discussion
EGU a. EARLINET: The European Aerosol Research Lidar Network (EARLINET) was
es-tablished in 2002 to build a quantitative, comprehensive, and statistical database of the horizontal, vertical, and temporal distribution of aerosols on a continental scale. The observations are used in conjunction with back-trajectory analysis to characterize the transport and evolution of air pollution events (Matthias et al., 2004). The dataset
col-5
lected over the past three years is being used to validate and improve model simula-tions under the framework of AEROCOM.
b. MPLNET: The NASA Micro Pulse Lidar Network (MPLNET) consists of
ground-based micro-pulse lidar systems, co-located with sun/sky photometer sites of AERONET. Such a compact lidar is capable of acquiring long-term observations of
10
aerosol and cloud vertical structures continuously and in an autonomous fashion (Wel-ton et al., 2001, 2002). In conjunction with AERONET sunphotometer measurements, they are able to produce quantitative aerosol and cloud products, such as optical depth, sky radiance, vertical structure, and extinction profiles. The data have contributed to studies of aerosol properties of key aerosol types and have been used to validate and
15
help interpret results from satellite sensors. MPLNET also serves as a ground calibra-tion network for space-based lidars such as GLAS and CALIPSO.
c. REALM: The Regional East Atmospheric Lidar Mesonet (REALM) is a lidar
net-work designed to monitor regional air pollution and transport from multiple locations (currently 12) in the eastern United States (Hoff and McCann, 2002).
20
d. AD-Net: The Asian Dust Network (AD-Net) was established to monitor the
trans-port of Asian dust through distributed lidar systems in Japan, China and Korea. The network has been expanded to include observations of radiation and chemical and physical properties of near-surface aerosols (Murayama et al., 2001).
2.1.2. Satellite remote sensing
25
A measurement-based characterization of aerosols on a global scale can only be real-ized through satellite remote sensing, due to aerosols’ short lifetime, complex chemi-cal composition and interaction in the atmosphere. Monitoring aerosols from space has
ACPD
5, 7647–7768, 2005
Measurement-based aerosol direct forcing
H. Yu et al. Title Page Abstract Introduction Conclusions References Tables Figures J I J I Back Close
Full Screen / Esc
Print Version Interactive Discussion
EGU
been performed for over two decades (King et al., 1999). Early aerosol monitoring from space used data from sensors that were designed for other purposes, e.g., Advanced Very High Resolution Radiometer (AVHRR), and Total Ozone Mapping Spectrometer (TOMS), among others. However, they have provided multi-decadal climatology of aerosol optical thickness that has significantly advanced the understanding of aerosol
5
distributions (e.g., Husar et al., 1997; Mishchenko et al., 1999, 2003; Geogdzhayev et al., 2002; Herman et al., 1997; Torres et al., 1998, 2002). The AVHRR, intended as a weather satellite, provides radiance observations in the visible and near infrared wave-lengths that are sensitive to aerosol properties over the ocean. Originally intended for ozone monitoring, the UV channels used for TOMS are sensitive to aerosol
ab-10
sorption and not too sensitive to surface interferences, even over land (Torres et al., 1998). TOMS has proved to be extremely successful in monitoring biomass burning smoke and dust (Herman et al., 1997) and retrieving aerosol single-scattering albedo from space (Torres et al., 2005). A new sensor, OMI aboard Aura, has improved on such advantages. In recent years, satellite aerosol retrievals have become
increas-15
ingly sophisticated. Now, satellites measure the angular dependence of polarization and radiance in multiple wavelengths in the UV through the IR, at fine temporal and spatial resolution. From these observations, retrieved aerosol products now include not only optical depth at one wavelength, but spectral optical depth and particle size both over ocean and land, as well as more direct measurements of polarization and
20
phase function. In addition, cloud screening is much more robust than before. Exam-ples of such new and enhanced sensors include POLDER, MODIS, and MISR, among others. Aerosol profiling from space is also making promising progress. In the follow-ing, a brief description of such new sensors is given. Readers are encouraged to refer to King et al. (1999) for details.
25
POLDER: The Polarization and Directionality of the Earth’s Reflectance (POLDER)
is a unique aerosol sensor that consists of a wide field-of-view imaging spectro-radiometer capable of measuring multi-spectral, multi-directional, and polarized radi-ances. The observed multi-angle polarized radiances can be exploited to better
sep-ACPD
5, 7647–7768, 2005
Measurement-based aerosol direct forcing
H. Yu et al. Title Page Abstract Introduction Conclusions References Tables Figures J I J I Back Close
Full Screen / Esc
Print Version Interactive Discussion
EGU
arate the atmospheric contribution from the surface contribution over both land and ocean (D ´euz ´e et al., 2001). The POLDER onboard the Japanese Advanced Earth Ob-servation Satellite (ADEOS-1 and -2) has collected aerosol data over both land and ocean (e.g., Boucher and Tanr ´e, 2000). A similar POLDER instrument flies on the PARASOL satellite launched in December 2004. A limitation of POLDER is the rather
5
coarse spatial resolution of about 6 km, which affects the ability to account for scene heterogeneity. In addition, larger aerosol particles, such as desert dust, do not polarize sunlight and therefore can not be retrieved quantitatively.
MODIS: The MODerate resolution Imaging Spectroradiometer (MODIS) aboard
NASA’s twin satellites, namely Terra and Aqua (crossing the equator in opposite
di-10
rections at about 10:30 and 13:30 local time, respectively), performs near global daily observations of atmospheric aerosols. MODIS has 36 channels ranging from 0.44 to 15 µm. Seven of these channels between 0.47 and 2.13 µm are used to retrieve aerosol properties over cloud and surface-screened areas (identified by using other channels and examining spatial variability (Martins et al., 2002; Li et al., 2004). The
15
MODIS retrieval uses separate algorithms over land and ocean (Kaufman et al., 1997; Tanr ´e et al., 1997; Remer et al., 2005). Over vegetated land, MODIS retrieves aerosol optical thickness at three visible channels with high accuracy, i.e., ±0.05±0.2τ (Chu et al., 2002; Remer et al., 2005). It also derives a fraction of small particles in terms of aerosol extinction (the so-called fine-mode fraction). This parameter over land should
20
be treated as a qualitative measure only. Because of its wide spectral range over ocean and the greater simplicity of the ocean surface, MODIS has the unique capability of re-trieving not only aerosol optical thickness with greater accuracy, i.e., ±0.03±0.05τ (Re-mer et al., 2002, 2005), but also quantitative aerosol size parameters (e.g., effective radius, fine-mode fraction) (Kaufman et al., 2002a; Remer et al., 2005).
25
MISR: The Multi-angle Imaging SpectroRadiometer (MISR) aboard the
sun-synchronous polar orbiting satellite Terra measures upwelling solar radiance in four spectral bands (centered at 446, 558, 672, and 866 nm) and at nine view angles spread out in the forward and aft directions along the flight path (at nadir, ±70.5◦, ±60.0◦,
ACPD
5, 7647–7768, 2005
Measurement-based aerosol direct forcing
H. Yu et al. Title Page Abstract Introduction Conclusions References Tables Figures J I J I Back Close
Full Screen / Esc
Print Version Interactive Discussion
EGU
±45.6◦, and ±26.1◦ of nadir) (Diner et al., 2002). It acquires global coverage about once per week. A wide range of along-track view angles makes it feasible to more accurately evaluate the surface contribution to the TOA radiances and hence retrieve aerosols over all kinds of ocean surfaces and especially over land surfaces, including bright desert aerosol source regions (Diner et al., 1998; Martonchik et al., 1998a, 2002;
5
Kahn et al., 2005a). Evaluation studies show that for the early post-launch algorithm (Version 12) overall, about two thirds of MISR AOTs are within 20% or ±0.05 of coin-cident AERONET measurements. Over dark ocean, the MISR early post-launch AOTs overall have a high bias of 0.038 (Kahn et al., 2005a; Abdou et al., 2005). New low-light level calibration, applied to aerosol product Versions 16 and higher, improve the
accu-10
racy of the dark water MISR AOT retrievals compared to sun photometer results (Kahn et al., 2005b; Bruegge et al., 2004). (Re-runs of the multi-year MISR data records with the Version 16 algorithm were not available in time for this assessment, but should be complete by early 2006.)
The MISR multi-angle data also sample scattering angles ranging from about 60◦ to
15
160◦ in midlatitudes, yielding information about particle size (Kahn et al., 1998, 2001, 2005a) and shape (Kalashnikova et al., 2005a, b1). These quantities are of interest in– and-of themselves for identifying aerosol airmass types, and should also help further refine the accuracy of space-based AOT retrievals and particle property determina-tions.
20
CERES: The Clouds and the Earth’s Energy System (CERES) measures broadband
solar and terrestrial radiances at three channels with a large footprint (e.g., 20 km for CERES/Terra) (Wielicki et al., 1996). It is collocated with MODIS and MISR aboard Terra and with MODIS on Aqua. The observed radiances are converted to the TOA irradiances or fluxes using the Angular Distribution Models (ADMs) as a function of
25
viewing angle, sun angle, and scene type (Loeb and Kato, 2002; Zhang et al., 2005a).
1
Kalashnikova, O. V., Kahn, R. A., and Li, W.-H.: The ability of multi-angle remote sensing observations to identify and distinguish mineral dust types: Part 2. Sensitivity data analysis, J. Geophys. Res., submitted, 2005b.
ACPD
5, 7647–7768, 2005
Measurement-based aerosol direct forcing
H. Yu et al. Title Page Abstract Introduction Conclusions References Tables Figures J I J I Back Close
Full Screen / Esc
Print Version Interactive Discussion
EGU
Such estimates of TOA solar flux under clear-sky conditions can be compared to the expected flux for an aerosol-free atmosphere, in conjunction with aerosol measure-ments from other sensors (e.g., MODIS and MISR) to derive the aerosol direct effect (Christopher and Zhang, 2002a, 2004; Loeb and Kato, 2002; Loeb and Manalo-Smith, 2005; Zhang and Christopher, 2003; Zhang et al., 2005b). The derived instantaneous
5
value is then scaled to obtain a daily average. Broadband flux measurements from the Earth Radiation Budget Experiment (ERBE) have also been used in a similar way (e.g., Hsu et al., 2000). Note that a direct use of the coarse spatial resolution CERES measurements would exclude aerosol distributions in partly cloudy CERES scenes and some approaches should be employed to overcome this limitation.
10
Aerosol profiling: Profiling global aerosols using satellite-borne lidar is another
emerging capability. Following a demonstration of U.S. Space Shuttle mission in 1994 (Winker et al., 1996), the Geoscience Laser Altimeter System (GLAS) was launched in early 2003 to become the first polar orbiting satellite lidar (Schutz, 1998; Zwally et al., 2002). It provides global aerosol extinction (at 532 nm) profiling for a one-month period
15
out of every three to six months. Some scientific results are going to be published soon (e.g., Spinhirne et al., 2005; Hart et al., 2005; Hlavka, et al., 2005). The Cloud-Aerosol Lidar and Infrared Pathfinder Satellite Observations (CALIPSO), scheduled to launch in July 2005, will carry a lidar instrument (CALIOP) that will collect profiles of the attenuated backscatter at visible and near-infrared wavelengths along with
polar-20
ized backscatter in the visible channel (Winker et al., 2003). Flying in formation with the Aqua, AURA, POLDER, and CloudSat satellites, this vertically resolved information is expected to greatly improve passive aerosol and cloud retrievals as well as allow the development of new retrieval products (see, e.g. Kaufman et al., 2003; L ´eon et al., 2003).
25
The high accuracy of aerosol products (mainly aerosol optical depth) from these new-generation sensors, together with improvements in characterizing the surface and cloud (see Sect. 2.2), can help reduce the uncertainties associated with the aerosol di-rect radiative effect, as discussed in several recent studies (Boucher and Tanr´e, 2000;
ACPD
5, 7647–7768, 2005
Measurement-based aerosol direct forcing
H. Yu et al. Title Page Abstract Introduction Conclusions References Tables Figures J I J I Back Close
Full Screen / Esc
Print Version Interactive Discussion
EGU
Christopher and Zhang, 2002, 2004; Loeb and Kato, 2002; Bellouin et al., 2003; Yu et al., 2004; Remer and Kaufman, 2005; Loeb and Manalo-Smith, 2005; Zhang et al., 2005a, b). The retrieved aerosol size parameters can help distinguish anthropogenic aerosols from natural aerosols and hence help assess the anthropogenic aerosol ra-diative forcing (Kaufman et al., 2002a, 2005a; Christopher and Zhang, 2004). As
dis-5
cussed earlier, individual sensors have their own strengths and weakness. No single sensor is adequate for characterizing the complex aerosol system and they are usually complementary to each other. Therefore, the best strategy for characterizing global aerosols is to integrate measurements from different sensors. Furthermore, some sen-sors will fly in formation with other aerosol and cloud sensen-sors (including OMI on Aura,
10
CALIOP on CALIPSO) in the coming years. The constellation of these new-generation sensors, also called the A-Train (Stephens et al., 2002) provides an unprecedented opportunity to improve the characterization of global aerosols, clouds, and surface properties and hence the quantification of aerosol radiative forcing (Anderson et al., 2005). These global measurements of aerosols can also be used to improve the
per-15
formance of aerosol model simulations and hence the assessment of the aerosol direct radiative effect through assimilation or integration process (e.g., Collins et al., 2001; Yu et al., 2003, 2004; Matsui et al., 2004; Liu et al., 2005). Finally, algorithms are be-ing developed to retrieve aerosol absorption or sbe-ingle-scatterbe-ing albedo from satellite observations (e.g., Kaufman et al., 2001; Torres et al., 2005).
20
2.1.3. Intensive field campaigns
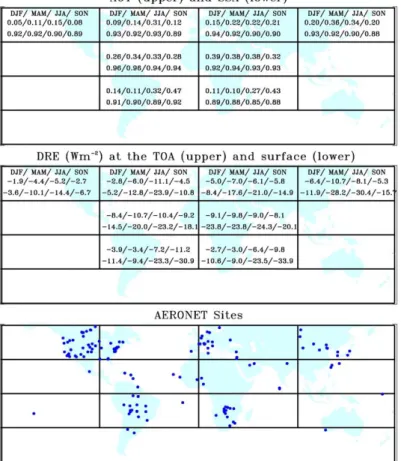
Over the past decade, more than a dozen intensive field experiments have been con-ducted to study physical, chemical, and optical properties and radiative effects of aerosols in a variety of aerosol regimes around the world, as depicted in Fig. 1. These experiments have either been designed mainly for aerosol research or have included
25
aerosol characterization as one of their major themes as part of interdisciplinary re-search efforts. A brief description of them is given in Table 1.
ACPD
5, 7647–7768, 2005
Measurement-based aerosol direct forcing
H. Yu et al. Title Page Abstract Introduction Conclusions References Tables Figures J I J I Back Close
Full Screen / Esc
Print Version Interactive Discussion
EGU
North Atlantic is influenced by pollution outflows from North America and West Europe during the summer season (Russell et al., 1999; Raes et al., 2000). Aerosol processes and properties have also been a major theme in air quality and atmospheric chemistry experiments, such as NEAQS in New England (Quinn and Bates, 2003), MINOS in the Mediterranean region (Lelieveld et al., 2002), INTEX-NA (2004), and ICARTT (2004).
5
South and East Asia have been of great interest to the atmospheric chemistry com-munity because of the rapid and persistent increase in emissions in recent decades and complexity of aerosol composition and properties in the region. As observed by INDOEX, brown hazes blanketing large areas of northern Indian Ocean in the pre-monsoon season can significantly influence the atmospheric radiative budget, climate,
10
and hydrological cycles (Ramanathan et al., 2001b). Such research is being extended to the broader Asia regions under the framework of ABC (Ramanathan and Crutzen, 2003). In East Asia, a mixture of industrial pollution and mineral dust influences large areas of the North Pacific and may even reach the North American continent, espe-cially during the spring season. In the 1990s, several missions, under the framework of
15
NASA’s global tropospheric experiment (GTE), have been conducted, including PEM-West A and B (Hoell et al., 1996, 1997). A decade of data describing Pacific aerosols is summarized in Clarke and Kapustin (2002). More recently, TRACE-P and ACE-Asia were conducted in the spring of 2001 to document and characterize such intercon-tinental transport and its regional and hemispheric impacts. In particular, ACE-Asia
20
was designed specifically for comprehensive aerosol research (Huebert et al., 2003; Seinfeld et al., 2004).
In the tropics, biomass burning comprises a major source of atmospheric aerosols and several international missions have been conducted to investigate how the emis-sions of gases and particles from biomass burning influence atmospheric chemistry,
25
radiative budget, and climate, including BASE-A (Kaufman et al., 1992), SCAR-B (Kaufman et al., 1998) and LBA-SMOCC (Andreae et al., 2004) over South America, SAFARI2000 (King et al., 2003a), SAFARI92 (Lindesay et al., 1996), and TRACE-A (Fishman et al., 1996) over South Africa and the South Atlantic Ocean.
ACPD
5, 7647–7768, 2005
Measurement-based aerosol direct forcing
H. Yu et al. Title Page Abstract Introduction Conclusions References Tables Figures J I J I Back Close
Full Screen / Esc
Print Version Interactive Discussion
EGU
The largest sources of mineral dust come from North Africa and the Arabian Penin-sula. They impose pronounced impacts over the tropical and subtropical Atlantic Ocean, Arabian Sea and as far as Southeastern US, as documented by observa-tions during SHADE (Tanr ´e et al., 2003), PRIDE (Reid et al., 2003), and UAE2 (http://uae2.gsfc.nasa.gov/). The ACE-1experiment was conducted over remote
south-5
ern oceans to characterize the aerosols over the remote region least influenced by human activities (Quinn and Coffman, 1998).
During each of these comprehensive missions, aerosols were studied in great detail, using combinations of in-situ and remote sensing observations of physical and chem-ical properties from various platforms (e.g., aircraft, ship, satellite, ground-network),
10
and numerical modeling (e.g., Seinfeld et al., 2004). In spite of their relatively short duration, these missions have acquired comprehensive data sets of regional aerosol properties that can be compared and compiled to understand the complex interac-tions of aerosols within the earth and atmosphere system. For such data comparison and compilation, it is required that different observations are sampling the same air
15
mass. Nevertheless, where aerosol properties are “over-determined” by coordinated deployment of multiple platforms and instruments, they can be used to identify incon-sistencies and quantify uncertainties. Column closure studies are an example of using this approach to improve knowledge of aerosol radiative forcing (e.g., Russell et al., 1997).
20
2.2. Surface albedo and clouds 2.2.1. Surface albedo
Surface albedo and reflectance properties are key factors in the solar energy budget, and accurate portrayal of the surface is important for determining how aerosols perturb this budget (Atwater, 1970; Mitchell Jr., 1971; Coakley et al., 1983). Multiple reflections
25
between the surface and aerosols cause a non-linear surface influence in addition to the aerosol radiative effect. In general, the larger the surface albedo, the smaller the
ACPD
5, 7647–7768, 2005
Measurement-based aerosol direct forcing
H. Yu et al. Title Page Abstract Introduction Conclusions References Tables Figures J I J I Back Close
Full Screen / Esc
Print Version Interactive Discussion
EGU
aerosol radiative effects are (for the same non-absorbing aerosol). However, even weak aerosol absorption above a highly reflective surface (deserts or snow) would cause warming at the TOA. As such, inadequate characterization of surface reflection will introduce additional uncertainties in the estimate of the aerosol direct radiative effect.
5
The characterization of surface albedo is challenging. Over ocean, the surface albedo depends primarily on wavelength, but also on solar and viewing angles, wind-speed, and chlorophyll concentration. The oceanic surface reflectance can be ad-equately calculated using an adequate coupled atmosphere-ocean radiative transfer model (Jin et al., 2002, 2004). However, reflectance by a land surface is much more
10
complicated. Often the land surface is highly heterogeneous, having highly anisotropic and wavelength-dependent optical properties (e.g., Dickinson, 1984). Therefore its characterization is even more difficult, leading to additional uncertainty in the aerosol direct effect. Until recently, aerosol radiative forcing calculations have assumed surface albedos that have been determined based on empirical parameterizations of vegetation
15
and soils (Dickinson et al., 1993; Sellers et al., 1996). New satellite-borne instruments, such as MODIS and MISR, can much better characterize surface optical properties because they measure at multiple wavelengths and angles at spatial resolutions as fine as 1 km (Moody et al., 2005; Schaaf et al., 2002; Martonchik et al., 1998b). Their albedo products include both global black- and white-sky albedos, which represent
re-20
spectively the directional hemispheric reflectance contributed by the direct beam and the bihemispherical reflectance contributed from reflection of diffuse light. These and other new datasets can provide better lower boundary conditions to the radiative trans-fer model and reduce the uncertainty in the estimate of aerosol direct effect (e.g., Yu et al., 2004).
25
The MODIS/MISR retrieved angular dependence of the surface albedo, i.e., a sep-aration of direct beam and diffuse light contribution, also provides an unprecedented dataset for examining the complex interaction of aerosol extinction with surface re-flectance (Yu et al., 2004). In principle, the determination of global albedo requires
ACPD
5, 7647–7768, 2005
Measurement-based aerosol direct forcing
H. Yu et al. Title Page Abstract Introduction Conclusions References Tables Figures J I J I Back Close
Full Screen / Esc
Print Version Interactive Discussion
EGU
integrating the angular dependence of the surface reflectance, over a diurnal cycle of solar zenith angles with appropriate fractions of spectral direct and diffuse solar beam radiances. Because aerosols modify the directional composition of incident solar ra-diation (by increasing the diffuse light and decreasing the direct beam), they alter the surface albedo as well. As a result of the spectral dependence of aerosol extinction,
5
the spectral dependence of the surface albedo changes as well. In other words the interaction of aerosol and the surface complicates the calculation of the aerosol TOA forcing (Yu et al., 2004).
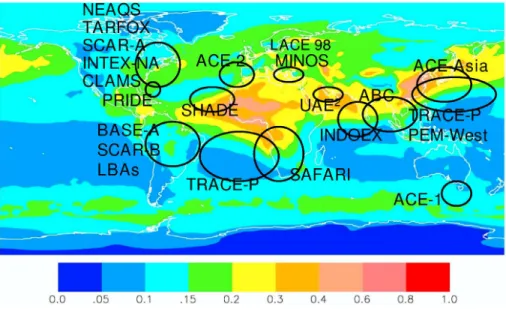
The left panel of Fig. 2 shows that the white-sky albedo is larger than the black-sky albedo at high solar zenith angles and smaller at low angles. A reduction of direct
10
beam fraction (as would be caused by aerosols) increases the effective reflection at high Sun but decreases it at low Sun. The right panel of Fig. 2 shows this effect over grassland. Although this aerosol effect is negligible when considering monthly or daily averages, the inclusion of land surface anisotropy is necessary for capturing diurnal aerosol effects. Magnitudes of aerosol effects strongly depend on both the aerosol
15
properties and land classifications (Yu et al., 2004). Bellouin et al. (2004) showed that the inclusion of anisotropy is also necessary over the ocean.
2.2.2. Clouds
Clouds can profoundly modify the aerosol radiative effects. The extent of their modifica-tion depends on both the aerosol and cloud properties, their relative posimodifica-tioning in the
20
atmosphere, and on their diurnal variation with respect to the solar illumination. (e.g., Liao and Seinfeld, 1998; Haywood and Shine, 1997). Cloud properties that must be accounted for include cloud fraction and cloud optical depth. For absorbing aerosols, the vertical profile of clouds is also desired (Keil and Haywood, 2003). For a first-order approximation (as assumed in box models), the direct aerosol radiative effect is
negli-25
gible under overcast skies, but is a cloud-fraction weighted product of clear and cloudy sky effects under partly cloudy skies (e.g., Charlson et al., 1992). Such an assumption only holds for optically thick clouds residing above the aerosol layer, where the solar
ACPD
5, 7647–7768, 2005
Measurement-based aerosol direct forcing
H. Yu et al. Title Page Abstract Introduction Conclusions References Tables Figures J I J I Back Close
Full Screen / Esc
Print Version Interactive Discussion
EGU
radiation is sufficiently diffused by the cloud. For optically thin clouds, a significant amount of solar radiation is transmitted to, and will interact with the underlying aerosol layer. If absorbing aerosol lies above the cloud layer (in essence a very bright surface) then the aerosol absorption effect tends to be magnified. Thus, aerosols over bright surfaces tend to induce a warming effect at the TOA.
5
MODIS uses multiple spectral bands at 250 m, 500 m, and 1 km resolution to detect clouds, and retrieve cloud properties recorded at 1 and 5 km horizontal resolution (Plat-nick et al., 2003). From the pressure dependence of thermal emission bands, MODIS infers cloud top pressure and temperature. Using six visible and near-infrared bands, MODIS retrieves drop effective radius (weighted towards cloud top), columnar optical
10
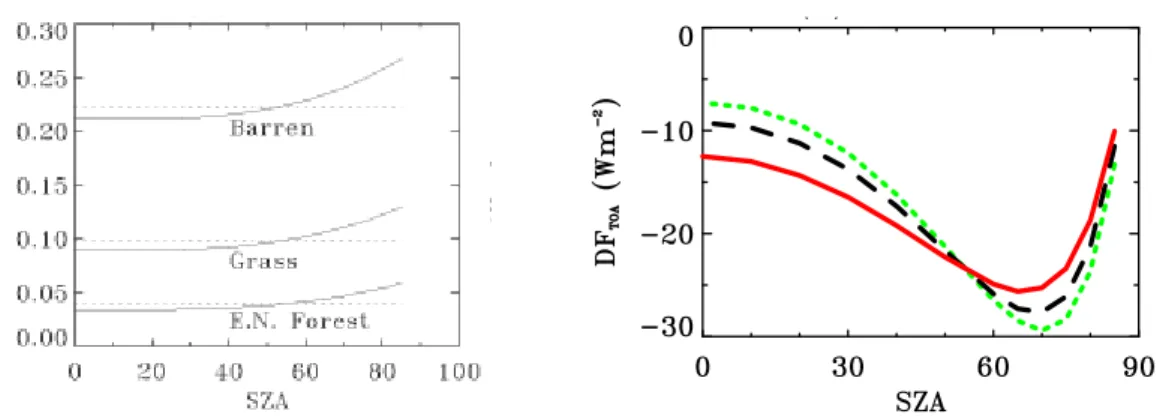
depth, and water path for different cloud thermodynamic phases (i.e., water, ice, and mixed) at 1 km resolution. Such retrievals are only performed for overcast pixels as determined by the two highest confidence bits of the cloud mask. The combination of MODIS/Terra and MODIS/Aqua allows for some indication of cloud evolution from late morning to early afternoon. Figure 3 shows the annual cycle (2001) of cloud fraction
15
and total (water plus ice) cloud optical depth averaged over the entire globe, land, and ocean. On global and annual average, the cloud fraction is about 0.63 and cloud op-tical depth is 10.8. Compared with clouds over ocean, clouds over land are opop-tically thicker and have smaller cloud fraction,
The International Satellite Cloud Climatology Project (ISCCP), a part of the World
Cli-20
mate Research Program (WCRP), has been collecting radiance measurements from the international constellation of weather satellites and analyzing cloud properties and variations since July 1983 (Schiffer and Rossow, 1983; Rossow and Schiffer, 1991, 1999). It has provided information on variations of cloud fraction, optical thickness, cloud-top temperature for various types of cloud at a time scale of 3 h, daily, and
25
monthly for two decades. Such information can be exploited to better constrain the estimate of the aerosol direct effect under cloudy sky conditions and to study interan-nual variations of the aerosol radiative effect.
ACPD
5, 7647–7768, 2005
Measurement-based aerosol direct forcing
H. Yu et al. Title Page Abstract Introduction Conclusions References Tables Figures J I J I Back Close
Full Screen / Esc
Print Version Interactive Discussion
EGU
2.3. Radiative transfer modeling
The early box model or one-line formula (e.g., Charlson et al., 1991; Chylek and Wong, 1995) represents aerosol-radiation interactions with a number of simplifications. While the calculations are straightforward, the simplifications cause large uncertainties in es-timates of aerosol radiative forcing (e.g., Wendisch et al., 2001). In such box models,
5
the aerosol properties are almost assumed for a single wavelength (e.g., 550 nm). However, the optical properties at 700 nm may be more representative for the whole solar spectrum than those at 550 nm (Blanchet, 1982). Box models do not adequately account for the spectral dependence of aerosol/Rayleigh scattering interactions, es-pecially at short wavelengths and at low Sun where Rayleigh scattering is strong. In
10
addition, multiple scattering effects become stronger at high aerosol loadings. There-fore, such simple box models should only be applied to optically thin atmospheres.
With the substantially enhanced computational capability of modern computers, it is now feasible to carry out sophisticated radiative transfer modeling. Most recent stud-ies have used plane-parallel radiative transfer (RT) models numerically solved with a
15
discrete-ordinate method, with varying levels of complexity depending on spectral res-olution and streams (e.g., Fu and Liou, 1993; Chou et al., 1993). Boucher et al. (1998) compare sulfate radiative effects calculated from a dozen such radiative transfer mod-els. Recently, a few studies have used more sophisticated Monte-Carlo RT models (e.g., Podgorny et al., 2000; Podgorny and Ramanathan, 2001). Such modeling is
20
capable of better characterizing the complex particle-radiation interactions in hetero-geneous media, including aerosols in the vicinity of broken clouds.
Simplified phase function parameterizations such as HG functions employed by most RT models cannot adequately represent backward scattering (van de Hulst, 1980), thereby introducing errors in the estimate of aerosol radiative forcing. Errors vary in
25
magnitude, depending on the solar zenith angle, aerosol size distribution and refrac-tive index (Boucher, 1998; Marshall et al., 1995). Aerosol direct solar effects change appreciably with the solar zenith angle (SZA). For purely scattering sulfate aerosol,
ACPD
5, 7647–7768, 2005
Measurement-based aerosol direct forcing
H. Yu et al. Title Page Abstract Introduction Conclusions References Tables Figures J I J I Back Close
Full Screen / Esc
Print Version Interactive Discussion
EGU
the largest cooling occurs around a SZA of ∼70◦because of the angular dependence of both aerosol upscattering fraction and Rayleigh scattering (Nemesure et al., 1995; Boucher et al., 1998; Russell et al., 1999). Aerosol absorption decreases with increas-ing SZA, nearly compensatincreas-ing for the SZA-dependence of aerosol backscatterincreas-ing (Yu et al., 2002). The SZA-dependence of the aerosol direct effect is relatively weak for
ab-5
sorbing aerosols. Accurately modeling the SZA-dependence of aerosol radiative effect requires that the time step for radiative calculations be adequately small, e.g., less than 30 min, in order to sample a range of solar zenith angles and calculate the unbiased daily average aerosol direct effect (Yu et al., 2004).
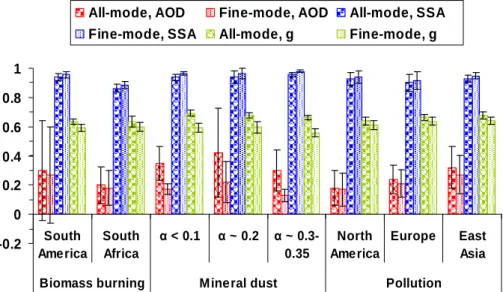
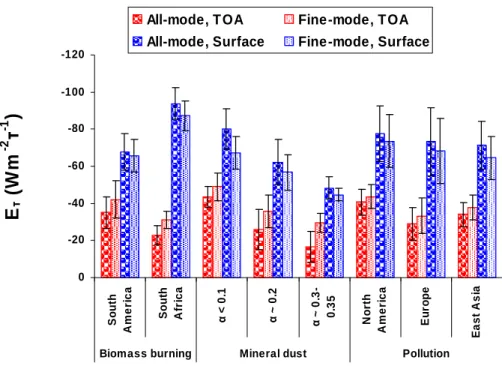
As a summary, we present here an example that demonstrates how the aerosol
10
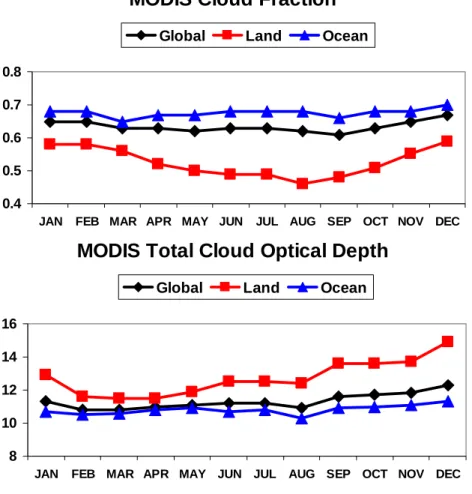
direct solar effect is determined by a combination of aerosol and surface properties. Figure 4a and b show respectively the AERONET measured aerosol optical properties, and the corresponding clear-sky aerosol direct effect of various aerosol types (biomass burning smoke, mineral dust, and industrial/urban pollution) for different geographical regions (Zhou et al., 2005). The monthly aerosol direct effect is normalized with
re-15
spect to the corresponding monthly optical depth at 550 nm. This normalized aerosol direct radiative effect (DRE/τ) has been referred to as “radiative efficiency” (Eτ) (An-derson et al., 2005). This quantity is mainly governed by aerosol size distribution and chemical composition (determining aerosol single-scattering albedo and phase func-tion), surface reflectivity, and solar irradiance, and also to some degree depends on
20
optical depth because of multiple scattering. Black vertical bars represent one stan-dard deviation of AOT, SSA, and Eτfor individual aerosol regimes. Both all-mode (total) and fine-mode aerosols are considered.
Due to stronger absorption of smoke in South Africa (SSA ∼0.862±0.027) as com-pared to South America (SSA∼0.940±0.025) (Dubovik et al., 2002; Eck et al., 2003),
25
biomass burning aerosols in South Africa are found to have an average Eτ that is smaller by ∼35% at the TOA but larger by ∼38% at the surface. For industrial pollution, the aerosol absorption and hence the radiative efficiency are inbetween South Africa biomass burning smoke and South America smoke. On average, the TOA and surface
ACPD
5, 7647–7768, 2005
Measurement-based aerosol direct forcing
H. Yu et al. Title Page Abstract Introduction Conclusions References Tables Figures J I J I Back Close
Full Screen / Esc
Print Version Interactive Discussion
EGU Eτ are relatively large in North America.
Mineral dust dominates over North Africa and the Arabian Peninsula. Here the sur-face reflectivity is high and has considerable spatial variability, ranging from about 0.2 to 0.4 for albedo in the solar spectrum (Tsvetsinskaya et al., 2002). Dust outflow also influences nearby oceans substantially where the surface albedo is less than 0.1. Such
5
large variations of surface albedo could be the major reason for the large differences of aerosol solar effect shown in the plots. The radiative efficiency ranges from −44 to −17 Wm−2τ−1 at the TOA and from −80 to −48 Wm−2τ−1 at the surface when the surface albedo changes from less than 0.1 to 0.3∼0.35.
It also shows that the radiative efficiency of fine-mode aerosol is larger at the TOA but
10
smaller at the surface than that of all-mode aerosol, due to a larger single-scattering albedo and smaller asymmetry factor of fine-mode aerosol retrieved from AERONET measurements.
3. Assessment of global and regional aerosols and their direct effect
3.1. Description of assessments
15
In this review, we concentrate on measurement-based assessments (e.g., from ground-based networks, satellite remote sensing, and intensive field experiments) of tropo-spheric aerosols and their direct radiative effect, supplemented by five global aerosol model simulations. We assess the aerosol properties and resulting estimates of the DRE derived from these different approaches, both globally (in Sect. 3.2) and
region-20
ally (in Sect. 3.3). DCF by anthropogenic aerosols is assessed in Sect. 3.4. In this section, the assessments concentrate on aerosol optical depth and influences on solar radiation under clear sky conditions. In Sect. 4, we will briefly discuss DRE in the ther-mal infrared range and under cloudy conditions. Because satellite sensors generally do not retrieve aerosols with good accuracy at high latitudes (due to weak sunlight and
25
con-ACPD
5, 7647–7768, 2005
Measurement-based aerosol direct forcing
H. Yu et al. Title Page Abstract Introduction Conclusions References Tables Figures J I J I Back Close
Full Screen / Esc
Print Version Interactive Discussion
EGU
fined to areas between 60◦N and 60◦S. The regional assessments are conducted over the 13 zones shown in Fig. 5.
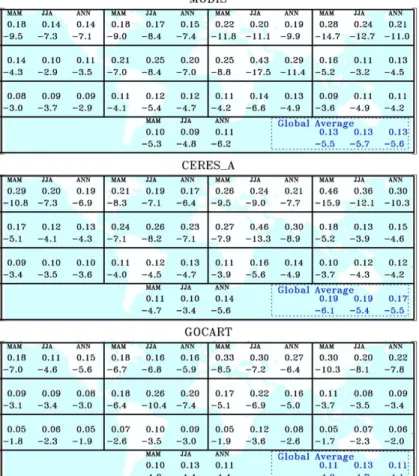
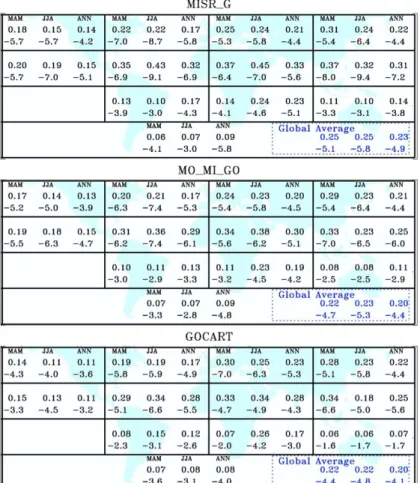
Here, we have compared retrievals of aerosol optical depth from a number of datasets. These include derivations from different satellite sensors (e.g., Terra-MODIS, MISR), model simulations (e.g., GOCART, SPRINTARS, GISS, LMDZ-INCA, LOA,
5
MPI-HAM), and satellite-model integrations (MO GO, MI GO, and MO MI GO), and are listed in Table 2. Aerosol retrievals from MODIS and MISR have previously been described in Sect. 2.1. All MODIS values of AOT or DRE shown in this paper are from Terra Collection 4 retrievals.
Five global aerosol models are included in our comparisons, namely GISS (Koch
10
and Hansen, 2005; Koch et al., 20052; Miller et al., 20053; Schmidt et al., 20054), GO-CART (Chin et al., 2000a, b, 2002, 2003, 2004; Ginoux et al., 2001, 2004), LMDZ-INCA (Schulz et al., 20055; Textor et al., 2005), LMDZ-LOA (Boucher et al., 2002; Boucher and Pham, 2002; Reddy et al., 2004, 2005a, b), and SPRINTARS (Takemura et al., 2000, 2002, 2005). All models simulate major components of tropospheric aerosols,
15
including sulfate (natural and anthropogenic separately), organic carbon (natural and anthropogenic separately), black carbon, and size-resolvable dust and sea-salt. On the other hand, individual models differ in emissions inventories, parameterizations of
2
Koch, D., Schmidt, G., and Field, C.: Sulfur, sea salt and radionuclide aerosols in GISS ModelE, J. Geophys. Res., submitted, 2005.
3
Miller, R. L., Cakmur, R. V., Perlwitz, J. A., Koch, D., Schmidt, G. A., Geogdzhayev, I. V., Ginoux, P., Prigent, C., and Tegen, I.: Mineral dust aerosols in the NASA Goddard Institute for Space Sciences ModelE atmospheric general circulation model, J. Geophys. Res., submitted, 2005.
4
Schmidt, G. A., Ruedy, R., Hansen, J. E., et al.: Present day atmospheric simulations using GISS ModelE: Comparison to in-situ, satellite and reanalysis data, J. Clim., submitted, 2005.
5
Schulz, M., Balkanski, Y., Textor, C., Guibert, S., Generoso, S., Boucher, O., Breon, F.-M., Hauglustaine, D., and Hourdin, F.: The LMDzT-INCA Global Aerosol Model and its, Evaluation with Surface, Lidar and Satellite Aerosol Observations, in preparation, 2005.
ACPD
5, 7647–7768, 2005
Measurement-based aerosol direct forcing
H. Yu et al. Title Page Abstract Introduction Conclusions References Tables Figures J I J I Back Close
Full Screen / Esc
Print Version Interactive Discussion
EGU
physical and chemical processes of aerosols, radiative transfer schemes, and spatial resolution. Some models are driven by assimilated/nudged climatology, whereas oth-ers are coupled with atmospheric general circulation model. All models provide the total aerosol optical depth under whole sky conditions. In addition, SPRINTARS and GISS provide the clear-sky AOT (denoted as SPRINTARS clr and GISS clr,
respec-5
tively). For deriving SPRINTARS clr AOT, clear sky is defined as a condition where the grid-average cloud fraction (maximum-random overlapping) is less than 0.2 at each time step of model integration (e.g., 8 min). GISS clr is derived by weighting the simu-lated AOT with clear-sky fraction.
Both satellite retrievals and model simulations have uncertainties and data
assimi-10
lation or objective analysis should form an optimal estimate of aerosol distributions by combining them with weights inversely proportional to the square of the errors of in-dividual descriptions. An optimum interpolation approach with the Kalman-Bucy filter can fill gaps in satellite retrievals and generate global distributions of aerosols in better agreement with ground-based measurements than are either the satellite retrievals or
15
model simulations alone (Yu et al., 2003). MO GO and MI GO denote, respectively, an integration of GOCART simulations with MODIS (land and ocean) and MISR (land and ocean). We also integrate GOCART simulations with MODIS retrievals over ocean and MISR retrievals over land, denoted as MO MI GO. By doing so, we take advan-tage of the high accuracy of MODIS over-ocean retrievals and high accuracy of MISR
20
retrievals over bright as well as darker land surfaces.
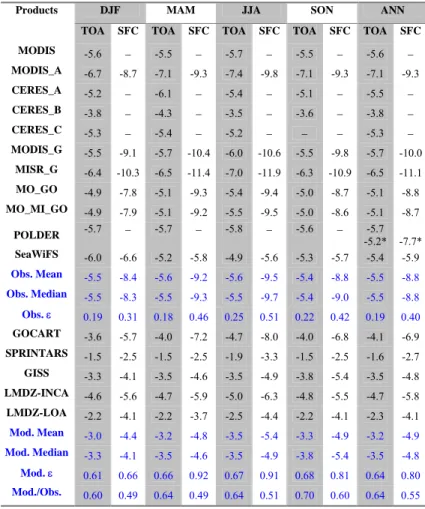
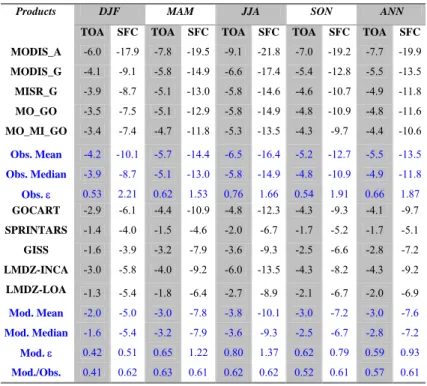
Table 3 lists the estimates of aerosol direct solar effect included in the comparison. A brief description of each is presented in the table and readers are encouraged to refer to the relevant literature for more details. The assessments fall into three broad categories:
25
The first category is satellite based that includes MODIS, MODIS A, CERES A, CERES B, CERES C.
The MODIS approach is to use the MODIS aerosol retrievals consistently in con-junction with the CLIRAD-SW radiative transfer model (Chou et al., 1992) to calculate