HAL Id: hal-00330256
https://hal.archives-ouvertes.fr/hal-00330256
Submitted on 7 Aug 2007HAL is a multi-disciplinary open access
archive for the deposit and dissemination of sci-entific research documents, whether they are pub-lished or not. The documents may come from teaching and research institutions in France or abroad, or from public or private research centers.
L’archive ouverte pluridisciplinaire HAL, est destinée au dépôt et à la diffusion de documents scientifiques de niveau recherche, publiés ou non, émanant des établissements d’enseignement et de recherche français ou étrangers, des laboratoires publics ou privés.
Distribution of micro-organisms along a transect in the
South-East Pacific Ocean (BIOSOPE cruise) from
epifluorescence microscopy
S. Masquelier, Daniel Vaulot
To cite this version:
S. Masquelier, Daniel Vaulot. Distribution of micro-organisms along a transect in the South-East Pa-cific Ocean (BIOSOPE cruise) from epifluorescence microscopy. Biogeosciences Discussions, European Geosciences Union, 2007, 4 (4), pp.2667-2697. �hal-00330256�
BGD
4, 2667–2697, 2007 Micro-organisms in the South-East Pacific S. Masquelier and D. Vaulot Title Page Abstract Introduction Conclusions References Tables Figures ◭ ◮ ◭ ◮ Back CloseFull Screen / Esc
Printer-friendly Version
Interactive Discussion Biogeosciences Discuss., 4, 2667–2697, 2007
www.biogeosciences-discuss.net/4/2667/2007/ © Author(s) 2007. This work is licensed
under a Creative Commons License.
Biogeosciences Discussions
Biogeosciences Discussions is the access reviewed discussion forum of Biogeosciences
Distribution of micro-organisms along a
transect in the South-East Pacific Ocean
(BIOSOPE cruise) from epifluorescence
microscopy
S. Masquelier and D. Vaulot
Station Biologique de Roscoff, UMR 7144, CNRS et Universit ´e Pierre et Marie Curie, Place G. Tessier, 29682, Roscoff, France
Received: 6 July 2007 – Accepted: 7 July 2007 – Published: 7 August 2007 Correspondence to: D. Vaulot ([email protected])
BGD
4, 2667–2697, 2007 Micro-organisms in the South-East Pacific S. Masquelier and D. Vaulot Title Page Abstract Introduction Conclusions References Tables Figures ◭ ◮ ◭ ◮ Back CloseFull Screen / Esc
Printer-friendly Version
Interactive Discussion
Abstract
The distribution of selected groups of micro-organisms was analyzed along a South-East Pacific Ocean transect sampled during the BIOSOPE cruise in 2004. The tran-sect could be divided into four regions of contrasted trophic status: a high Nutrient Low Chlorophyll (HNLC) region (mesotrophic) near the equator, the South-East Pa-5
cific Ocean gyre (hyper-oligotrophic), the transition region between the gyre and the coast of South America (moderately oligotrophic), and the Chile upwelling (eutrophic). The abundance of phycoerythrin containing picocyanobacteria, autotrophic and het-erotrophic eukaryotes in different size ranges, dinoflagellates, and ciliates was deter-mined by epifluorescence microscopy after DAPI staining. All populations reached a 10
maximum in the Chile upwelling and a minimum near the centre of the gyre. Pico-cyanobacteria reached a maximum abundance of 70×103 cell mL−1. In the HNLC
zone, up to 50% of picocyanobacteria formed colonies. Autotrophic eukaryote and dinoflagellate abundance reached 24.5×10³ and 200 cell mL−1, respectively. We
ob-served a shift in the size distribution of autotrophic eukaryotes from 2–5 µm in eutrophic 15
and mesotrophic regions to less than 2 µm in the central region. The contribution of autotrophic eukaryotes to total eukaryotes was the lowest in the central gyre. Maxi-mum concentration of ciliates (18 cell ml−1) also occurred in the Chile upwelling, but,
in contrast to the other groups, their abundance was very low in the HNLC zone and near the Marquesas Islands.
20
1 Introduction
Unicellular picoplanktonic prokaryotes and eukaryotes less than 2 µm in size (Sieburth et al., 1978) are found in marine ecosystems at concentrations ranging from 102 to 105 and 102 to 104 cells mL−1, respectively. They play a fundamental role (Azam et
al., 1983; Sherr and Sherr, 2000), in particular, in oligotrophic waters (Hagstr ¨om et al., 25
BGD
4, 2667–2697, 2007 Micro-organisms in the South-East Pacific S. Masquelier and D. Vaulot Title Page Abstract Introduction Conclusions References Tables Figures ◭ ◮ ◭ ◮ Back CloseFull Screen / Esc
Printer-friendly Version
Interactive Discussion boundary layer and large surface area per unit volume are an advantage to acquire
nu-trients (Raven, 1998). The photosynthetic component of picoplankton, i.e.
Prochloro-coccus and SynechoProchloro-coccus cyanobacteria and picoeukaryotic algae, are important
contributors to the microbial community of the euphotic zone in many marine environ-ments (Campbell et al., 1997; Mackey et al., 2002; Perez et al., 2006). Heterotrophic 5
protists play a pivotal role in mediating organic flux to higher trophic levels in pelagic ecosystems (Azam et al., 1983; Fenchel, 1982; Hagstr ¨om et al., 1988). Among the heterotrophic protists, ciliates and dinoflagellates are potentially important grazers of picoplankton (Sherr and Sherr, 2000).
In the Pacific Ocean, picoplankton has been analyzed both in the Equatorial region 10
and the North gyre (e.g. Campbell et al., 1997; Mackey et al., 2002) but not in the South gyre. The latter is the most oligotrophic environment of the world oceans based on SeaWifs imagery which provides estimates of average surface chlorophyll a con-centrations down to 0.02 mg m−3 (Morel et al., 2007).
The BIOSOPE (Biogeochemistry & Optics South Pacific Experiment) cruise explored 15
this region sailing from the Marquesas Islands to the coast of Chile. Along this tran-sect, a gradient in trophic conditions was encountered, from hyper-oligotrophic (gyre) to very eutrophic waters (Chile upwelling). The present study focuses on the distribution of phycoerythrin containing picocyanobacteria, autotrophic and heterotrophic eukary-otes (in particular dinoflagellates and ciliates) in the South-East Pacific as estimated 20
by epifluorescence microscopy. In comparison to more rapid enumeration techniques such as flow cytometry, microscopy allows (1) to discriminate specific group of organ-isms such as dinoflagellates, (2) to recognize cell organization such as colonies and (3) to regroup organism into size classes (e.g. here, smaller than 2 µm, between 2 µm and 5 µm, and larger than 5 µm). In this paper we try to relate the distribution of the different 25
types of organisms to oceanographic conditions and in particular trophic status.
BGD
4, 2667–2697, 2007 Micro-organisms in the South-East Pacific S. Masquelier and D. Vaulot Title Page Abstract Introduction Conclusions References Tables Figures ◭ ◮ ◭ ◮ Back CloseFull Screen / Esc
Printer-friendly Version
Interactive Discussion
2 Material and methods
2.1 Oceanographic context
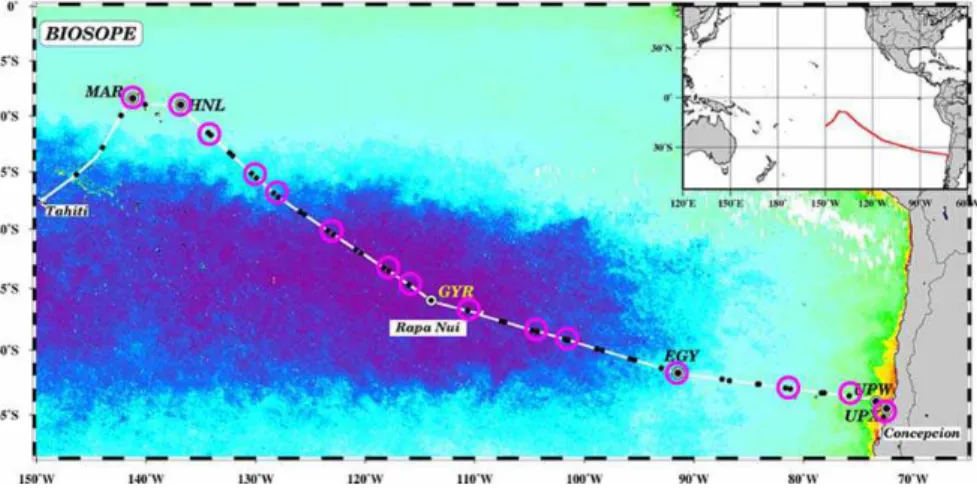
The BIOSOPE cruise took place on board the French NO “l’Atalante” in the South East Pacific Ocean from 26 October to 11 December 2004 (Fig. 1). The transect investi-gated extended from the Marquesas Islands (South Pacific Tropical Waters; SPTW) to 5
the coast of Chile, through the Eastern South Pacific Central Waters (ESPCW) which include the centre of the Pacific gyre (Claustre et al., 20071). The transect can be divided into four very contrasted trophic zones (from West to East): a high Nutrient Low Chlorophyll (HNLC) zone (mesotrophic) near the equator, the South-East Pacific gyre (hyper-oligotrophic) itself, the transition zone between the gyre and the coastal 10
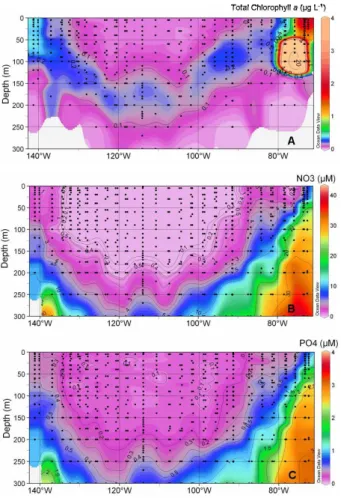
region (moderately oligotrohic), and the Chile upwelling (very eutrophic). In the hyper oligotrophic zone, nitrate concentrations were nearly undetectable between the surface and 150–200 m and remained very low (∼2.5 µM) below this depth (Fig. 2b). Nitrate concentrations were higher in the HNLC zone and maximum in the Chile upwelling (Fig. 2b, Raimbault and Garcia, 20072). Phosphate was apparently never a limiting 15
factor (Fig. 2c, Moutin et al., 20073).
1
Claustre, H., Sciandra, A., Vaulot, D., and Raimbault, P.: Introduction to the special section : bio-optical and biogeochemical conditions in the South East Pacific in late 2004 – the BIOSOPE program, Biogeosci. Discuss., in preparation, 2007.
2
Raimbault, P. and Garcia, N.: Nutrients distribution and new production estimation in the southwest Pacific: Evidence for intense nitrogen recycling, Biogeosci., Discuss., submitted, 2007.
3
Moutin, T., Karl, D., Duhamel, S., Rimmelin, P., Van Mooy, B., and Claustre, H.: Phosphate availability and the ultimate control of nitrate input by nitrogen fixation in the Pacific Ocean, Biogeosci. Discuss., submitted, 2007.
BGD
4, 2667–2697, 2007 Micro-organisms in the South-East Pacific S. Masquelier and D. Vaulot Title Page Abstract Introduction Conclusions References Tables Figures ◭ ◮ ◭ ◮ Back CloseFull Screen / Esc
Printer-friendly Version
Interactive Discussion 2.2 DAPI staining and epifluorescence microscopy
Fifteen stations (Fig. 1 and Table 1) were sampled at six depths with a conductivity-temperature-depth (CTD) rosette system equipped with 12 L Niskin bottles. In general, two samples were collected in the surface layer, three around the chlorophyll maximum and one below. Water was pre-filtered through a 200 µm mesh to remove zooplankton, 5
large phytoplankton, and particles before further filtrations.
Water samples (100 mL) were fixed with glutaraldehyde (0.25% final concentration) and filtered through 0.8 µm pore size filters. This porosity was selected to avoid high densities of bacteria on the filter which would have rendered visualisation of the larger and less dense eukaryotes more difficult. Samples were stained with 4’6-diamidino-2-10
phenylindole (DAPI, 5 µg mL−1 final concentration) (Porter and Feig, 1980) and stored
at –20◦C for at least 12 months before counting. Counts were performed with an
Olym-pus BX51 epifluorescence microscope (OlymOlym-pus Optical CO, Tokyo, Japan) equipped with a mercury light source and an x100 UVFL objective. Some pictures, such as those of dinoflagellates, were taken on board the ship on the freshly prepared slides 15
using a BH2 Olympus microscope with an x40 objective and a Canon G5 digital cam-era. Pictures of picocyanobacteria were taken in the laboratory on the BX51 Olympus microscope with a Spot RT-slider camera (Diagnostics Instruments, Sterling Heights, MI).
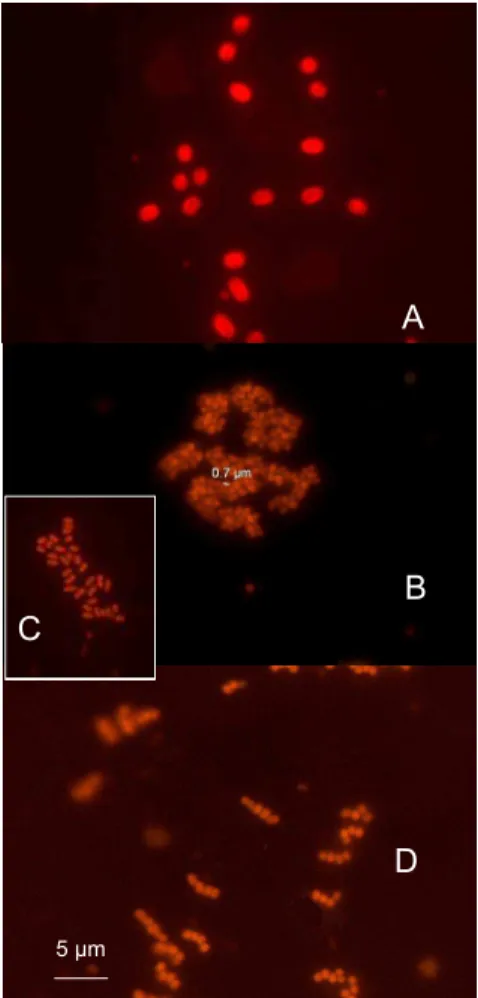
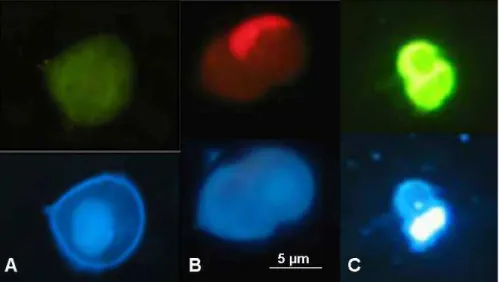
Isolated and colonial picocyanobacteria (Fig. 3) containing orange fluorescing phy-20
coerythrin were counted under green light (530–550 nm). DAPI staining allowed us to discriminate eukaryotic from prokaryotic organisms under UV light (360/420 nm) based on the blue staining of the cell nucleus. The red fluorescence of chlorophyll under blue light (490/515 nm) allowed us to discriminate autotrophic (photosynthetic) from het-erotrophic eukaryotes. However, it was not possible to distinguish truly autotrophic 25
organisms from organisms that had ingested chlorophyll-containing cells. Ten fields and a minimum of 100 cells were counted per slide. Eukaryotes were classified ac-cording to three diameter ranges: (i) smaller than 2 µm, (ii) between 2 µm and 5 µm,
BGD
4, 2667–2697, 2007 Micro-organisms in the South-East Pacific S. Masquelier and D. Vaulot Title Page Abstract Introduction Conclusions References Tables Figures ◭ ◮ ◭ ◮ Back CloseFull Screen / Esc
Printer-friendly Version
Interactive Discussion (iii) larger than 5 µm. Among eukaryotes larger than 5 µm, ciliates and dinoflagellates
were counted separately. Dinoflagellates were discriminated by their shape, their size (between 5 µm and 100 µm), and the presence of a nucleus with condensed chromatin. Within dinoflagellates, we discriminated autotrophic and heterotrophic dinoflagellates based on the red fluorescence of chlorophyll under blue light of the former (Fig. 4a 5
and b). Among heterotrophic dinoflagellates, some dinoflagellates were characterized by an intense green fluorescence under blue light (Fig. 4c), as reported previously (Shapiro et al., 1989), and counted separately. Ciliates were discriminated by their shape, their size (between 20 µm and 100 µm), and the presence of cilia and multiple nuclei. No distinction between different types of ciliates was attempted. Because of 10
their low abundance, 50 fields per slide were counted for dinoflagellates and ciliates such that the minimum concentration detectable was 1.5 cell mL−1.
2.3 Data representation
Contour maps showing the distributions of CTD data and of the different populations were drawn using the Ocean Data View software (Schlitzer, 2003). VG gridding with 15
averaging length-scales of 45 and 100 for both X and Y was used for CTD and mi-croscopy data, respectively.
3 Results
3.1 Comparison between microscopy and flow cytometry
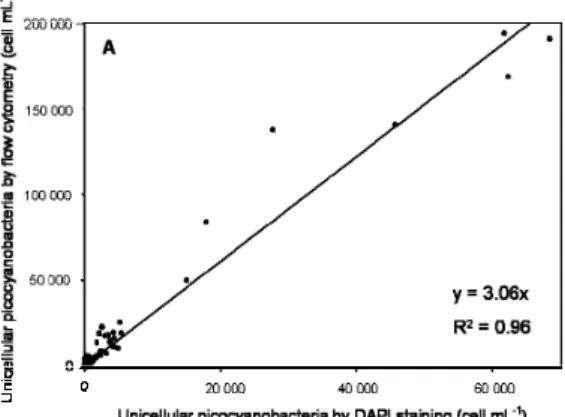
In order to validate our microscopy counts, we compared them to counts of Syne-20
chococcus cyanobacteria and photosynthetic picoeukaryotes done by flow cytometry
(Grob et al., 2007) at the same stations (Fig. 5). There was a good relatively correlation between the two methods, such that global distribution trends were identical, but slopes were significantly larger than one indicating that microscopy was underestimating the
BGD
4, 2667–2697, 2007 Micro-organisms in the South-East Pacific S. Masquelier and D. Vaulot Title Page Abstract Introduction Conclusions References Tables Figures ◭ ◮ ◭ ◮ Back CloseFull Screen / Esc
Printer-friendly Version
Interactive Discussion actual concentrations. For picocyanobacteria, abundance found by microscopy was 3
times lower than measured by flow cytometry (Fig. 5a). For photosynthetic eukaryotes, the correlation was not very high (R2=0.69; n=80) when all the data were considered, although the slope was lower than for cyanobacteria (Fig. 5b). However, if only data below 40–60 m were included the correlation was significantly better (R2=0.90; n=56) 5
and the slope less pronounced. 3.2 Picocyanobacteria
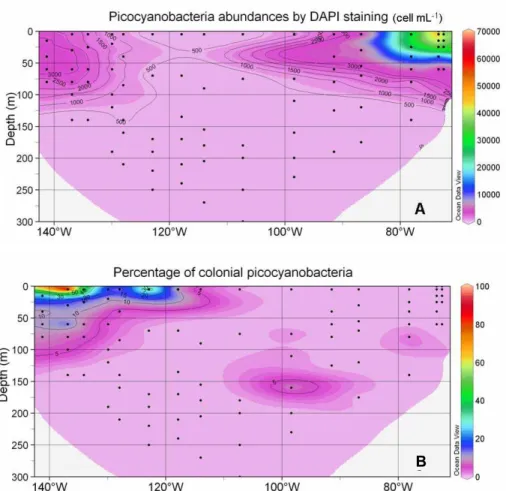
In surface, picocyanobacteria abundance (Fig. 6a) reached a maximum (70×103 cell mL−1) near the coast of Chile (station UPW1) and a minimum (less than 500 cell mL−1)
in the middle of the South East Pacific gyre. They increased again near the Marque-10
sas Islands. Along the vertical, they decreased slightly down to about 100 m and then quickly disappeared (Fig. 6a). Interestingly, a large fraction of the picocyanobacteria belonged to colonial forms in the vicinity of the Marquesas Islands and in the HNLC zone (Fig. 6b). In this region, this fraction could reach up to 50% percent near the surface and 5 to 10% between 25 and 100 m, while it dropped below 5% almost ev-15
erywhere else. Three types of colony could be observed (Fig. 3): (i) groups of 20–30 cells, (ii) groups of more than 100 cells, (iii) short chain. None of these forms seemed to be preferentially observed in any given region.
3.3 Eukaryotes
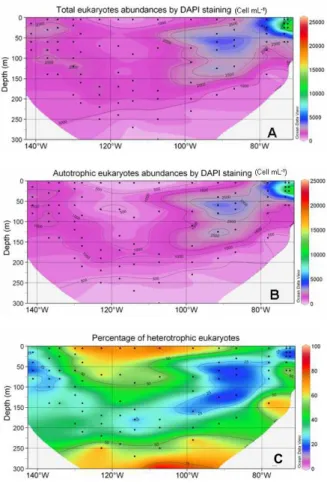
The maximum abundance of total eukaryotes (26×103cell mL−1) occurred in the Chile
20
upwelling near the surface (station UPX2, 25 m depth) and the minimum (276 cell mL−1) in the gyre at depth (station GYR2, 270 m depth) (Fig. 7a). In the surface layer,
abundances were minimum in the center of the gyre and increased both eastward and westward. The maxima of total eukaryotes coincided roughly with the depth of chloro-phyll maximum (DCM) (Compare Figs. 2a and 7a). Below 200 m, concentrations were 25
always lower than 1000 cell mL−1. The distribution of autotrophic eukaryotes was very
BGD
4, 2667–2697, 2007 Micro-organisms in the South-East Pacific S. Masquelier and D. Vaulot Title Page Abstract Introduction Conclusions References Tables Figures ◭ ◮ ◭ ◮ Back CloseFull Screen / Esc
Printer-friendly Version
Interactive Discussion similar to that of total eukaryotes (Fig. 7b), a consequence of the fact that they were
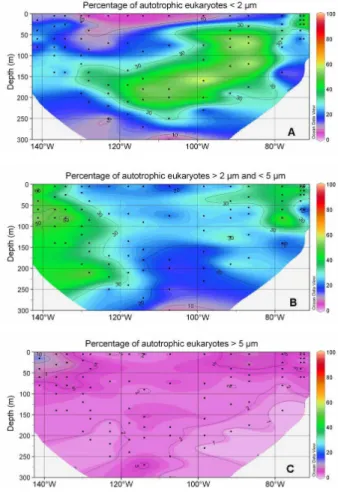
much more abundant than heterotrophic ones (Fig. 7c). The size distribution of au-totrophic eukaryotes varied dramatically throughout the transect (Figs. 8 and 9): in the surface of the gyre, cells smaller than 2 µm accounted for less than 10% while, they dominated (50–70 %) in the DCM of the gyre as well as east of the gyre (Fig. 8A). 5
In the Chile upwelling (station UPX2, 25 m), they accounted for up to 80% of the total eukaryotes. In contrast, their contribution was much lower in the HNLC region where larger eukaryotes between 2 µm and 5 µm accounted for 40% to 60% of the population (Fig. 8b). This size class was also dominant near the surface in the transition zone be-tween the gyre and the upwelling. Cells larger than 5 µm accounted for less than 10% 10
of autotrophic eukaryotes everywhere along the transect, except near the Marquesas Islands where they contributed slightly more (Fig. 8c).
The relative proportion of heterotrophic eukaryotes was the highest in the 0–50 m layer of the gyre (75–80%), while in the DCM it dropped to 25% (Fig. 7c). In the DCM, cells smaller than 2 µm accounted for 28% (east of the gyre) to 40% (in the gyre) of 15
heterotrophic eukaryotes (Fig. 9). The contribution of cells between 2 µm and 5 µm did not vary much (about 50 %) while cells larger than 5 µm accounted for up to 14% of total heterotrophic eukaryotes in the HNLC region and for about 10% elsewhere.
In the 0–100 m layer, dinoflagellate abundance (Fig. 10a) increased towards the HNLC region (maximum observed: 200 cell mL−1at station STB1, 25 m) and the Chile
20
upwelling, and decreased towards the gyre (minimum observed: 10 cell mL−1 at
sta-tion GYR2, 270 m) in the gyre. In relative terms, autotrophic dinoflagellates dominated around the Marquesas Islands (up to 80% of total dinoflagellates, at station STB1, 80 m depth) and in the Chile upwelling (70% at station UPW1, 15 m depth) (Fig. 10b). The maximum of percentage of autotrophic dinoflagellates (50%–80%) followed the DCM 25
except at station STB8 where the highest percentage (50%) occurred at 70 m whereas the DCM was found at 170 m (Fig. 2a and 10b). In the Chile upwelling, the maximum of autotrophic dinoflagellates (50% at station UPX2 in surface and 70% at station UPW1 at 15 m) occurred above the DCM. The percentage of autotrophic dinoflagellates was
BGD
4, 2667–2697, 2007 Micro-organisms in the South-East Pacific S. Masquelier and D. Vaulot Title Page Abstract Introduction Conclusions References Tables Figures ◭ ◮ ◭ ◮ Back CloseFull Screen / Esc
Printer-friendly Version
Interactive Discussion the lowest (5%–25%) in the surface of the gyre and below 250 m.
Heterotrophic dinoflagellates contribution ranged from 20% to 95% of the total (Fig. 10c) and consisted mostly (80% on average) of cells smaller than 20 µm in size (data not shown). Vertical profiles showed that maximum abundances of heterotrophic dinoflagellates followed the DCM only at some stations in the gyre (STB3, STB6 and 5
STB8, Fig. 11). At other stations, the maximum abundance of heterotrophic dinoflagel-lates was observed above the DCM, except in the upwelling (station UPX2) where the maximum was found below. At station EGY2 (east of gyre), the lowest concentration of heterotrophic dinoflagellates (18 cell mL−1) occurred in the DCM.
Green fluorescing dinoflagellates (Fig. 4c) accounted for up to 50% of the het-10
erotrophic dinoflagellates in surface east of the gyre and at depth in the Chile upwelling and for 5 to 25% of heterotrophic dinoflagellates in the HNLC zone and the Chile up-welling (Fig. 10d).
Ciliates abundance reached a maximum (18 cell mL−1) in the Chile upwelling
(sta-tion UPW1, 40 m depth) and a minimum in the HNLC region (Fig. 12). Abundance 15
increased towards the Chile upwelling and decreased towards the gyre as for most other groups. However, in contrast to most other groups, ciliates also remained quite low towards the HNLC zone and the Marquesas Islands. Vertically, at many stations, ciliate maxima corresponded to dinoflagellate minima (Fig. 11).
4 Discussion
20
Difference between abundances estimates by microscopy vs. flow cytometry observed in this study could be due to several reasons. First, some cells smaller than could have passed through the 0.8 µm filter used here. If this is a real possibility for pic-ocyanobacteria, the loss of eukaryotic cells is likely to be negligible since the small-est known eukaryote Ostreococcus tauri has a size of 0.8 µm (Courties et al., 1994). 25
This may explain why the slope is larger for cyanobacteria than eukaryotes (Fig. 5). Second, samples for microscopy were stored for more than a year at –20◦C before
BGD
4, 2667–2697, 2007 Micro-organisms in the South-East Pacific S. Masquelier and D. Vaulot Title Page Abstract Introduction Conclusions References Tables Figures ◭ ◮ ◭ ◮ Back CloseFull Screen / Esc
Printer-friendly Version
Interactive Discussion counting while samples for flow cytometry were analyzed fresh on board.
Gunder-sen et al. (1996) and Putland et al. (1999) showed a significant loss of bacteria after one month and unicellular cyanobacteria after three months storage of samples at – 20◦C, respectively. Third, storage at –20◦C may cause a degradation of chlorophyll
and an underestimation of red fluorescing organisms (Chavez et al., 1990). Therefore, 5
abundances of unicellular picocyanobacteria and autotrophic eukaryotes may be un-derestimated, while the proportion of heterotrophic eukaryotes could be higher than in the initial samples. The discrepancy between the correlation slopes for the differ-ent populations (Fig. 5) could reinforce this hypothesis. In fact, we observed during counting that organisms from surface samples had less intense chlorophyll fluores-10
cence than those of deeper samples (as expected due to photoacclimation), but also that fluorescence fading was faster. Therefore, it was not always easy to distinguish autotrophic organisms from heterotrophic organisms near the surface, which could ex-plain the lower correlation and higher slopes between abundances for samples above 40–60 m.
15
The low abundance of unicellular picocyanobacteria containing phycoerythrin in the gyre and their higher abundance in the Chile upwelling, a region rich in nutrients and characterized by mixed waters, is in agreement with many recent studies (for a review see Partensky et al., 1999). Interestingly, up to 50% of the unicellular picocyanobacte-ria appeared to be colonial near the Marquesas Islands and in the HNLC region (Fig. 3 20
and 6c). Some cyanobacteria encountered in marine systems form colonies (Graham and Wilcox, 2000) but these are usually much larger than those we observed. It is, for example, the case for Trichodesmium which have been previously observed in the Equatorial Pacific (Capone et al., 1997). Interestingly, unicellular picocyanobacteria forming chains (cf. Fig. 3d) were isolated in culture from the HNLC station at 30 m and 25
100 m depth (Le Gall et al., 2007), but the other morphotypes observed in the field were not obtained. Since there were some evidence of nitrogen fixation activity in this area (P. Raimbault, personal communication), it is tempting to hypothesize that these colonial picocyanobacteria could be nitrogen-fixing. However, small cyanobacteria
re-BGD
4, 2667–2697, 2007 Micro-organisms in the South-East Pacific S. Masquelier and D. Vaulot Title Page Abstract Introduction Conclusions References Tables Figures ◭ ◮ ◭ ◮ Back CloseFull Screen / Esc
Printer-friendly Version
Interactive Discussion cently shown to have the capacity to fix nitrogen (Zehr et al., 2001) do not seem to form
colonies and their morphotype (spherical 3–10 µm cells) has been rarely observed in our samples (data not shown). Alternatively, colony formation could be an adaptation to the structure of the predator community in this region, such as the higher the di-noflagellate to ciliate ratio. Indeed, cells forming colonies could take advantage of the 5
positive aspects of increased size, in particular lower grazing pressure, without paying the full cost of decreased metabolism and reduced growth which is associated with large individual cell size (Nielsen, 2006).
Globally, the distribution of picophytoplankton and nanophytoplankton obtained in the present study is consistent with that estimated by Ras et al. (2007)4 from HPLC 10
pigment data based on assumptions concerning the size range of specific taxonomic groups (Claustre, 1994; Vidussi et al., 2001). They found that the contribution of pi-cophytoplankton (in terms of percentage of Tchla) was the highest in the gyre itself and east of gyre, while nanophytoplankton dominated in the HNLC zone and the Chile upwelling. However, their method tends to underestimate the contribution of picophy-15
toplankton and to overestimate the contribution of macrophytoplankton. For example, they only took into account for the picoplankton size group pigments characterizing cyanobacteria and Chlorophyta. However, Prymnesiophyceae may also contribute sig-nificantly to picoeukaryotic population (Moon-van der Staay et al., 2000; Not et al., 2005). Indeed, Prymnesiophyceae cells characterized by two chloroplasts were ob-20
served in our DAPI samples (data not shown). Conversely, Ras et al. (submitted) include pigments of dinoflagellates and diatoms in the microplankton size range (20– 200 µm), while many dinoflagellates and some diatoms smaller than 20 µm (data not shown) have been observed along the South-East Pacific transect, as observed pre-viously along 110◦W. (Hardy et al., 1996). Therefore, the contribution of
microphyto-25
plankton could be overestimated.
Grob et al. (2007) demonstrated that autotrophic picoeukaryotes are important
con-4
Ras, J., Uitz, J., and Claustre, H.: Spatial variability of phytoplankton pigment distribution in the South East Pacific, Biogeosci. Discuss., in preparation, 2007.
BGD
4, 2667–2697, 2007 Micro-organisms in the South-East Pacific S. Masquelier and D. Vaulot Title Page Abstract Introduction Conclusions References Tables Figures ◭ ◮ ◭ ◮ Back CloseFull Screen / Esc
Printer-friendly Version
Interactive Discussion tributors to the photosynthetic carbon biomass in the gyre. As a complement, we show
here that heterotrophic eukaryotes account for up to 90% of total eukaryotes in the gyreand that between 20 and 65% of them are picoplanktonic in size. Therefore the total contribution of picoeukaryotes (autotrophic and heterotrophic together) to partic-ulate carbon biomass is probably very significant.
5
During the BIOSOPE cruise, Gomez et al. (2007) found dinoflagellate abundance always lower than 1 cell mL−1, except at station station 20 where a bloom of
dinoflag-ellates was observed (∼4 cells mL−1 between surface and 5 m depth), and at station
UPW (∼2 cells mL−1). These counts from acidified lugol’s fixed samples are much
lower than ours (Table 1). These differences could originate from the size of counted 10
dinoflagellates in both studies. We counted dinoflagellates which were between 5 µm and 50 µm in diameter while Gomez et al. (2007) only counted dinoflagellates larger than 15 µm. Hardy et al. (1996) showed that dinoflagellates larger than 20 µm ac-counted only for 10 to 30% of total dinoflagellates in the Pacific gyre. In our samples (data not shown), the contribution of dinoflagellates larger than 20 µm was below 1% 15
near the Marquesas Islands, 1% in the upwelling zone, 2% in the HNLC zone and around the station EGY, and reached a maximum of 3% at station ST20 probably be-cause of the bloom observed there by Gomez et al. (2007).
From a global point of view, the abundance of dinoflagellates (Fig. 10) decreased towards the hyper-oligotrophic zone and increased towards the mesotrophic zone in 20
agreement with Leterme et al. (2006) who showed that the dinoflagellate abundances increased with trophic status in the NE Atlantic Ocean. The increase in heterotrophic dinoflagellates contribution with depth that we observed is coherent with previous ob-servation in the Equatorial Pacific (Chavez et al., 1990) Heterotrophic dinoflagellates were always much more abundant than ciliates as shown previously in the Sargasso 25
Sea (Lessard and Murrell, 1996), and in the North-East Equatorial Pacific (Yang et al., 2004) and could be major predators of picoplankton (Sanders et al., 2000; Sherr et al., 1991).
BGD
4, 2667–2697, 2007 Micro-organisms in the South-East Pacific S. Masquelier and D. Vaulot Title Page Abstract Introduction Conclusions References Tables Figures ◭ ◮ ◭ ◮ Back CloseFull Screen / Esc
Printer-friendly Version
Interactive Discussion in the North-West Atlantic, but little reported since then. These authors found that
they could contribute from 4 to 100% to heterotrophic dinoflagellates while Chavez et al. (1990) found that in the Equatorial Pacific, 32% of heterotrophic dinoflagellates pro-duced a bright green fluorescence. The data reported here (maximal concentrations in excess of 60 cell mL−1 and maximum contribution up to 50% of the heterotrophic
5
dinoflagellates, Fig. 10) are in agreement with these previous studies. (Shapiro et al., 1989). Still the origin of this bright green fluorescence (Fig. 4c) remains intrigu-ing. Shapiro et al. (1989) hypothesized that it could be due to a flavoprotein. Kim et al. (2004) showed that the infection of the thecate dinoflagellate Gonyaulax spinifera by Amoebophrya, a parasitic dinoflagellate, induces a bright green autofluorescence 10
iin infected cells. This fluorescence is, however, much more localised than in the green dinoflagellates observed in our samples (Fig. 4c). Another exciting possibility could be the presence of a cytoplasmic green fluorescing protein (Wilson and Hastings, 1998).
Ciliate abundances reported here (Table 1) are comparable to those reported from other similar marine systems ranging from oligotrophic to eutrophic (Beers et al., 1980; 15
Leakey et al., 1996; Lessard and Murrell, 1996; Yang et al., 2004). Looking only at tintinnid ciliates, Dolan et al. (2007) observed during the BIOSOPE cruise much lower concentrations ranging from 0.002 and 0.04 cells mL−1 between 5 and 300 m.
How-ever, tintinnids generally account only for 5–10% of all ciliates (Dolan and Marrase, 1995). Comparing our data with values given in the Table 2 of Dolan et al. (2007) re-20
sults in a proportion of tintinnids (0.05%) smaller than the one observed in the Catalan Sea (Dolan and Marrase, 1995). However, maxima and minima of tintinnid and total ciliates occur at the same place.
The distribution pattern of ciliates (Fig. 12). agrees with previous observations in the North Western Indian Ocean (Leakey et al., 1996) where the lowest abundances were 25
observed in oligotrophic waters, and the highest in the most productive waters. The different patterns of vertical distribution of ciliates observed in the present study could be explained by the fact that no distinction has been made between the different types of ciliates (mixotrophic and heterotrophic ciliates). In the Catalan Sea, heterotrophic
BGD
4, 2667–2697, 2007 Micro-organisms in the South-East Pacific S. Masquelier and D. Vaulot Title Page Abstract Introduction Conclusions References Tables Figures ◭ ◮ ◭ ◮ Back CloseFull Screen / Esc
Printer-friendly Version
Interactive Discussion ciliate distribution has been shown to be closely related to the DCM while mixotrophic
ciliates have a more complicated vertical pattern and a distribution which may vary from system to system (Dolan and Marrase, 1995).
Nano-ciliates (<20 µm) have been identified as potentially important grazers of pi-coplankton (Sherr and Sherr, 1987; Sherr et al., 1991) and account in general from 5
50 to 95% of total ciliates in a variety of marine ecosystems (Beers et al., 1980; Mon-tagnes et al., 1988; Yang et al., 2004). In our study however, we observed very few nanociliates since the size if the majority of ciliates felled into a 50–100 µm range (data not shown). This absence of nanociliates could be explained by our fixation method used in our study. Leakey et al. (1994) demonstrated that the use of glutaraldehyde as 10
fixative could lead up to a loss of cells as high as 70% among aloricate ciliates rela-tive to lugol’s iodine while tintinnid numbers did not vary significantly between fixarela-tive treatments.
In conclusion, although assessing the abundance of the different microbial groups by microscopy is slow and labour-intensive, the present data set highlights some char-15
acteristics of the microbial community in the South East Pacific Ocean that have es-caped more rapid techniques such as flow cytometry. This includes in particular the importance of colonial picocyanobacteria in the HNLC area and the large contribution of green fluorescing dinoflagellates in some regions, such between the gyre and the coast of South America.
20
Acknowledgements. D. Tailliez and C. Bournot are warmly thanked for their efficient help in CTD rosette management and data processing. D. Marie, M. Viprey and L. Garczarek are acknowledged for their help during the cruise. This is a contribution to the BIOSOPE project (LEFE-CYBER program). This research was funded by the Centre National de la Recherche Scientifique (CNRS), the Institut des Sciences de l’Univers (INSU), the Centre Na-25
tional d’Etudes Spatiales (CNES), the European Space Agency (ESA), the National Aeronau-tics and Space Administration (NASA) and the Natural Sciences and Engineering Research Council of Canada (NSERC). Additional funds were provided by the ANR Biodiversity project PICOFUNPAC. Sylvie Masquelier was supported by a doctoral fellowship (BFR05/027) from the “Minist `ere de la Culture, de l’Enseignement Sup ´erieur et de la Recherche ” of Luxembourg. 30
BGD
4, 2667–2697, 2007 Micro-organisms in the South-East Pacific S. Masquelier and D. Vaulot Title Page Abstract Introduction Conclusions References Tables Figures ◭ ◮ ◭ ◮ Back CloseFull Screen / Esc
Printer-friendly Version
Interactive Discussion
References
Azam, F., Fenchel, T., Field, J. G., Gray, J. S., Meyer-Reil, L. A., and Thingstad, F.: The ecolog-ical role of water column microbes in the sea, Mar. Ecol. Prog. Ser., 10, 257–263, 1983. Beers, J. R., Reid, M. H., and Stewart, G. L.: Microplankton population structure in southern
California nearshore waters in late spring, Mar. Biol., 60, 209–226, 1980. 5
Campbell, L., Liu, H. B., Nolla, H. A., and Vaulot, D.: Annual variability of phytoplankton and bacteria in the subtropical North Pacific Ocean at Station ALOHA during the 1991-1994 ENSO event, Deep-Sea Res. I, 44, 167–192, 1997.
Capone, D. G., Zehr, J. P., Paerl, H. W., Bergman, B., and Carpenter, E. J.: Trichodesmium, a globally significant marine cyanobacterium, Science, 276, 1221–1229, 1997.
10
Chavez, F. P., Buck, K. R., and Barber, R. T.: Phytoplankton taxa in relation to primary produc-tion in the equatorial Pacific, Deep-Sea Res. I, 37, 1733–1752, 1990.
Claustre, H.: The trophic status of various oceanic provinces as revealed by phytoplankton pigment signatures, Limnol. Oceanogr., 39, 1206–1210, 1994.
Courties, C., Vaquer, A., Trousselier, M., Lautier, J., Chr ´etiennot-Dinet, M.-J., Neveux, J., 15
Machado, C., and Claustre, H.: Smallest eukaryotic organism, Nature, 370, 255, 1994. Dolan, J. R. and Marrase, C.: Planktonic ciliate distribution relative to a deep chlorophyll
max-imum : Catalan sea. N.W. Mediterranean, June 1993, Deep-Sea Res. I, 42, 1965–1987, 1995.
Dolan, J. R., Ritchie, M. E., and Ras, J.: The “neutral” community structure of planktonic her-20
bivores, tintinnid ciliates of the microzooplankton, across the SE Tropical Pacific Ocean, Biogeosci. Discuss., 4, 561–593, 2007.
Fenchel, T.: Ecology of heterotrophic microflagellates. Bioenergetics and growth. Mar. Ecol. Prog. Ser., 8, 225-231, 1982.
G ´omez, F., Claustre, H., Raimbault, P., and Souissi, S.: Two High-Nutrient Low-Chlorophyll 25
phytoplankton assemblages: the tropical central Pacific and the offshore Per ´u-Chile Current, Biogeosci. Discuss., 4, 1535–1554, 2007.
Graham, L. and Wilcox, L.: Algae. Prentice Hall, Inc. Upper Saddle River, NJ, 630 pp, 2000. Grob, C., Ulloa, O., Claustre, H., Huot, Y., Alarcon, G., and Marie, D.: Picoplankton abundance
and contribution to particulate attenuation (cp) and organic carbon (POC) in the Eastern
30
South Pacific, Biogeosci. Discuss., 4, 1461–1497, 2007.
Gundersen, K., Bratbak, G., and Heldal, M.: Factors influencing the loss of bacteria in pre-2681
BGD
4, 2667–2697, 2007 Micro-organisms in the South-East Pacific S. Masquelier and D. Vaulot Title Page Abstract Introduction Conclusions References Tables Figures ◭ ◮ ◭ ◮ Back CloseFull Screen / Esc
Printer-friendly Version
Interactive Discussion served seawater samples, Mar. Ecol. Prog. Ser., 137, 305–307, 1996.
Hagstr ¨om, A., Azam, F., Andersson, A., Wikner, J., and Rassoulzadegan, F.: Microbial loop in an oligotrophic pelagic marine ecosystem: possible roles of cyanobacteria and nanoflagel-lates in the organic fluxes, Mar. Ecol. Prog. Ser., 49, 171–178, 1988.
Hardy, J., Hanneman, A., Behrenfeld, M., and Horner, R.: Environmental biogeography of near-5
surface phytoplankton in the southeast Pacific Ocean, Deep-Sea Res. I, 43, 1647–1659, 1996.
Kim, S., Park, M. G., Yih, W., and Coats, D. W.: Infection of the bloom-forming thecate di-noflagellates Alexandrium affine and Gonyaulax spinifera by two strains of Amoebophrya (Dinophyta), J. Phycol., 40, 815–822, 2004.
10
Le Gall, F., Rigaut-Jalabert, F., Marie, D., Garczareck, L., Viprey, M., Godet, A., and Vaulot, D.: Picoplankton diversity in the South-East Pacific Ocean from cultures, Biogeosci. Discuss., in press, 2007.
Leakey, R. J. G., Burkill, P. H., and Sleigh, M. A.: A comparison of fixatives for the estimation of abundance and biovolume of marine planktonic ciliate populations, J. Plankton Res., 16, 15
375–389, 1994.
Leakey, R. J. G., Burkill, P. H., and Sleigh, M. A.: Planktonic ciliates in the northwestern Indian Ocean : their abundance and biomass in waters of contrasting productivity, J. Plankton Res., 18, 1063–1071, 1996.
Lessard, E. J. and Murrell, M. C.: Distribution, abundance and size composition of heterotrophic 20
dinoflagellates and ciliates in the Sargasso Sea near Bermuda. Deep-Sea Res. I, 43, 1045-1065, 1996.
Leterme, S. C., Seuront, L., and Edwards, M.: Differential contribution of diatoms and dinoflag-ellates to phytoplankton biomass in the NE Atlantic Ocean and the North Sea, Mar. Ecol. Prog. Ser., 312, 57–65, 2006.
25
Mackey, D. J., Blanchot, J., Higgins, H. W., and Neveux, J.: Phytoplankton abundances and community structure in the equatorial Pacific, Deep-Sea Res. II, 49, 2561–2582, 2002. Maranon, E., Holligan, P. M., Barciela, R., Gonzalez, N., Mourino, B., Pazo, M. J., and Varela,
M.: Patterns of phytoplankton size structure and productivity in contrasting opocean en-vironments, Mar. Ecol. Prog. Ser., 216, 43–56, 2001.
30
Montagnes, D. J. S., Lynn, D. H., Roff, J. C., and Taylor, W. D.: The annual cycle of heterotrophic planktonic ciliates in the waters surrounding the Isles of Shoals, Gulf of Maine: an assess-ment of their trophic role, Mar. Biol., 99, 21–30, 1988.
BGD
4, 2667–2697, 2007 Micro-organisms in the South-East Pacific S. Masquelier and D. Vaulot Title Page Abstract Introduction Conclusions References Tables Figures ◭ ◮ ◭ ◮ Back CloseFull Screen / Esc
Printer-friendly Version
Interactive Discussion Moon-van der Staay, S. Y., van der Staay, G. W. M., Guillou, L., Vaulot, D., Claustre, H., and
Medlin, L. K.: Abundance and diversity of prymnesiophytes in the picoplankton community from the equatorial Pacific Ocean inferred from 18S rDNA sequences, Limnol. Oceanogr., 45, 98–109, 2000.
5
Morel, A., Gentili, B., Claustre, H., Babin, M., Bricaud, A., Ras, J., and Tieche, F.: Optical properties of the ”clearest” natural waters. Limnol. Oceanogr., 52, 217-229, 2007.
Nielsen, S. L.: Siez-dependent growth rates in eukaryotic and prokaryotic algae exemplified by green algae and cyanobacteria: comparisons between unicells and colonial growth forms, J. Plankton Res., 28, 489–498, 2006.
10
Not, F., Massana, R., Latasa, M., Marie, D., Colson, C., Eikrem, W., Pedros-Alio, C., Vaulot, D., and Simon, N.: Late summer community composition and abundance of photosynthetic picoeukaryotes in Norvegian and Barents Seas, Limnol. Oceanogr., 50, 1677–1686, 2005. Partensky, F., Hess, W. R., and Vaulot, D.: Prochlorococcus, a marine photosynthetic
prokary-ote of global significance, Microb. Mol. Biol. Rev., 63, 106–127, 1999. 15
Perez, V., Fernandez, E., Maranon, E., Moran, X. A. G., and Zubkovc, M. V.: Vertical distribution of phytoplankton biomass, production and growth in the Atlantic subtropical gyres, Deep-Sea Res. I, 53, 1616–1634, 2006.
Porter, K. G. and Feig, Y. S.: The use of DAPI for identifying and counting aquatic microflora, Limnol. Oceanogr., 25, 943–948, 1980.
20
Putland, J. and Rivkin, R.: Influence of storage mode and duration on the microscopic enumer-ation of Synechococcus from a cold coastal ocean environment, Aquat. Microb. Ecol., 17, 191–199, 1999.
Raven, J. A.: The twelfth Tansley Lecture. Small is beautiful: the picophytoplankton, Func. Ecol., 12, 503–513, 1998.
25
Sanders, R. W., Berninger, U. G., Lim, E. L., Kemp, P. F., and Caron, D. A.: Heterotrophic and mixotrophic nanoplankton predation on picoplankton in the Sargasso Sea and on Georges Bank, Mar. Ecol. Prog. Ser., 192, 103–118, 2000.
Schlitzer, R.: Ocean Data View.http:/www.awi-bremerhaven.de/GEO/ODV, 2003.
Shapiro, L. P., Haugen, E. M., and Carpenter, E. J.: Occurrence and abundance of green-30
fluorescing dinoflagellates in surface waters of the Northwest Atlantic and Northeast Pacific oceans. J. Phycol., 25, 189-191, 1989.
Sherr, B. F. and Sherr, E. B.: High rates of consumption of bacteria by pelagic ciliates, Nature, 325, 710–711, 1987.
BGD
4, 2667–2697, 2007 Micro-organisms in the South-East Pacific S. Masquelier and D. Vaulot Title Page Abstract Introduction Conclusions References Tables Figures ◭ ◮ ◭ ◮ Back CloseFull Screen / Esc
Printer-friendly Version
Interactive Discussion Sherr, E. B. and Sherr, B. F.: Marine Microbes An Overview. Microbial Ecology of the Oceans,
D. L. Kirchman, Ed., Willey-Liss, 13-46, 2000.
Sherr, E. F., Sherr, B. F., and McDaniel, J.: Clearance rates of <6 µm fluorescently labeled algae (FLA) by estuarine protozoa: potential grazing impact of flagellates and ciliates, Mar. Ecol. Prog. Ser., 69, 81–92, 1991.
5
Sieburth, J. M., Smetacek, V., and Lenz, J.: Pelagic ecosystem structure: heterotrophic com-partments of the plankton and their relationship to plankton size fractions, Limnol Oceanogr, 23, 1256–1263, 1978.
Vidussi, F., Claustre, H., Manca, B. B., Luchetta, A., and Marty, J. C.: Phytoplankton pigment distribution in relation to upper thermocline circulation in the eastern Mediterranean Sea 10
during winter, J. Geophys. Res., 106, 19 l939–19 956, 2001.
Wilson, T. and Hastings, J. W.: Bioluminescence, Ann. Rev. Cell Dev. Biol., 14, 197–230, 1998. Yang, E. J., Choi, J. K., and Hyun, J. H.: Distribution and structure of heterotrophic protist
communities in the northeast equatorial Pacific Ocean, Mar. Biol., 146, 1–15, 2004.
Zehr, J. P., Waterbury, J. B., Turner, P. J., Montoya, J. P., Omoregie, E., Steward, G. F., Hansen, 15
A., and Karl, D. M.: Unicellular cyanobacteria fix N2 in the subtropical North Pacific Ocean, Nature, 412, 635–638, 2001.
BGD
4, 2667–2697, 2007 Micro-organisms in the South-East Pacific S. Masquelier and D. Vaulot Title Page Abstract Introduction Conclusions References Tables Figures ◭ ◮ ◭ ◮ Back CloseFull Screen / Esc
Printer-friendly Version
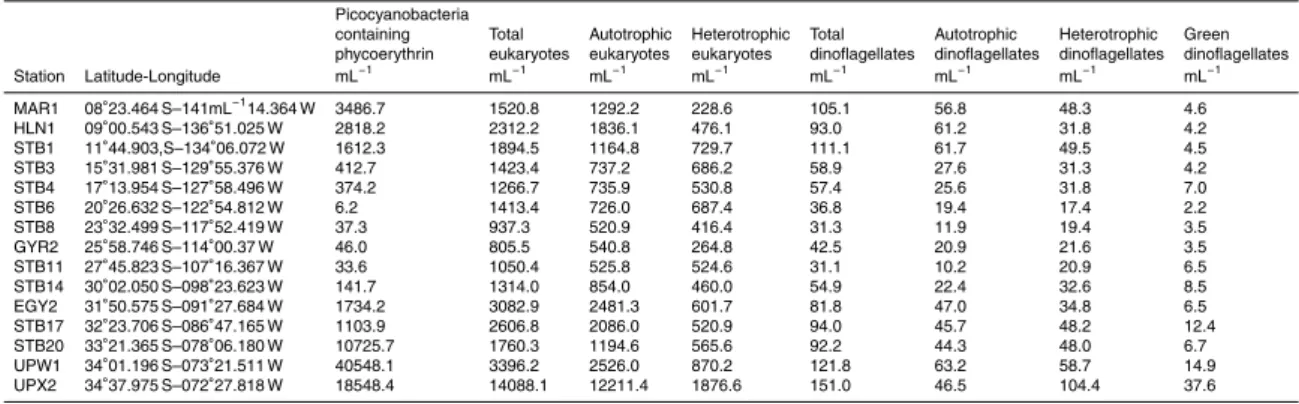
Interactive Discussion Table 1. Concentrations of the different populations enumerated in the present study. Average
for the six depths sampled at each station.
Picocyanobacteria
containing Total Autotrophic Heterotrophic Total Autotrophic Heterotrophic Green phycoerythrin eukaryotes eukaryotes eukaryotes dinoflagellates dinoflagellates dinoflagellates dinoflagellates Station Latitude-Longitude mL−1 mL−1 mL−1 mL−1 mL−1 mL−1 mL−1 mL−1 MAR1 08◦23.464 S–141mL−114.364 W 3486.7 1520.8 1292.2 228.6 105.1 56.8 48.3 4.6 HLN1 09◦00.543 S–136◦51.025 W 2818.2 2312.2 1836.1 476.1 93.0 61.2 31.8 4.2 STB1 11◦44.903,S–134◦06.072 W 1612.3 1894.5 1164.8 729.7 111.1 61.7 49.5 4.5 STB3 15◦31.981 S–129◦55.376 W 412.7 1423.4 737.2 686.2 58.9 27.6 31.3 4.2 STB4 17◦13.954 S–127◦58.496 W 374.2 1266.7 735.9 530.8 57.4 25.6 31.8 7.0 STB6 20◦26.632 S–122◦54.812 W 6.2 1413.4 726.0 687.4 36.8 19.4 17.4 2.2 STB8 23◦32.499 S–117◦52.419 W 37.3 937.3 520.9 416.4 31.3 11.9 19.4 3.5 GYR2 25◦58.746 S–114◦00.37 W 46.0 805.5 540.8 264.8 42.5 20.9 21.6 3.5 STB11 27◦45.823 S–107◦16.367 W 33.6 1050.4 525.8 524.6 31.1 10.2 20.9 6.5 STB14 30◦02.050 S–098◦23.623 W 141.7 1314.0 854.0 460.0 54.9 22.4 32.6 8.5 EGY2 31◦50.575 S–091◦27.684 W 1734.2 3082.9 2481.3 601.7 81.8 47.0 34.8 6.5 STB17 32◦23.706 S–086◦47.165 W 1103.9 2606.8 2086.0 520.9 94.0 45.7 48.2 12.4 STB20 33◦21.365 S–078◦06.180 W 10725.7 1760.3 1194.6 565.6 92.2 44.3 48.0 6.7 UPW1 34◦01.196 S–073◦21.511 W 40548.1 3396.2 2526.0 870.2 121.8 63.2 58.7 14.9 UPX2 34◦37.975 S–072◦27.818 W 18548.4 14088.1 12211.4 1876.6 151.0 46.5 104.4 37.6 2685
BGD
4, 2667–2697, 2007 Micro-organisms in the South-East Pacific S. Masquelier and D. Vaulot Title Page Abstract Introduction Conclusions References Tables Figures ◭ ◮ ◭ ◮ Back CloseFull Screen / Esc
Printer-friendly Version
Interactive Discussion Fig. 1. Map of the BIOSOPE cruise track superimposed on a SeaWiFS ocean colour
compos-ite, the dark purple indicating extremely low values (0.018 mg m−3) of total chlorophyll a. Pink
BGD
4, 2667–2697, 2007 Micro-organisms in the South-East Pacific S. Masquelier and D. Vaulot Title Page Abstract Introduction Conclusions References Tables Figures ◭ ◮ ◭ ◮ Back CloseFull Screen / Esc
Printer-friendly Version
Interactive Discussion Fig. 2. Distribution with longitude and depth of total chlorophyll a (Tchla, chlorophyll a + divinyl
chlorophyll a) in µg L−1(Ras et al., 20074) (A), nitrate in µM (Raimbault and Garcia, 20072) (B),
phosphate in µM (Moutin et al., 20073) (C). 2687
BGD
4, 2667–2697, 2007 Micro-organisms in the South-East Pacific S. Masquelier and D. Vaulot Title Page Abstract Introduction Conclusions References Tables Figures ◭ ◮ ◭ ◮ Back CloseFull Screen / Esc
Printer-friendly Version Interactive Discussion 5 µm A B D C
Fig. 3. Pictures of single (A), and colonial picocyanobacteria (B–D). Colony of more than 100 cells (B), colony of 20–30 cells (C), Chain forming cells (D). Pictures have been taken under green light excitation on samples of stations MAR1 at 80 m (A), MAR1 at 40 m (B), HNL1 at
BGD
4, 2667–2697, 2007 Micro-organisms in the South-East Pacific S. Masquelier and D. Vaulot Title Page Abstract Introduction Conclusions References Tables Figures ◭ ◮ ◭ ◮ Back CloseFull Screen / Esc
Printer-friendly Version
Interactive Discussion Fig. 4. Heterotrophic (A)), autotrophic (B), and green dinoflagellates (C) observed under blue
light excitation (top) and UV light excitation (bottom). Pictures have been taken at stations STB3 (20 m), UPW and STB7 (5 m), respectively.
BGD
4, 2667–2697, 2007 Micro-organisms in the South-East Pacific S. Masquelier and D. Vaulot Title Page Abstract Introduction Conclusions References Tables Figures ◭ ◮ ◭ ◮ Back CloseFull Screen / Esc
Printer-friendly Version
Interactive Discussion Fig. 5. Relationship between the abundances (cell mL−1) measured by flow cytometry (Grob
et al., 2007) and those estimated by DAPI counting of unicellular cyanobacteria (A), and au-totrophic eukaryotes (B). (A) R2=0.96, n=80; (B) Regression line in black takes into account all data (circles and squares); R2=0.69 n=80. Regression line in red takes into account only square dots; R2=0.90, n=56.
BGD
4, 2667–2697, 2007 Micro-organisms in the South-East Pacific S. Masquelier and D. Vaulot Title Page Abstract Introduction Conclusions References Tables Figures ◭ ◮ ◭ ◮ Back CloseFull Screen / Esc
Printer-friendly Version
Interactive Discussion
B
Fig. 6. Distribution of abundances obtained by DAPI counting for unicellular picocyanobacte-ria (cell mL−1) (A) and percentage of unicellular picocyanobacteria in colony (B). Black dots
correspond to the samples analysed. Contour plots generated with the software Ocean Data View.
BGD
4, 2667–2697, 2007 Micro-organisms in the South-East Pacific S. Masquelier and D. Vaulot Title Page Abstract Introduction Conclusions References Tables Figures ◭ ◮ ◭ ◮ Back CloseFull Screen / Esc
Printer-friendly Version
Interactive Discussion
C
Fig. 7. Distribution obtained by DAPI counting of total eukaryotes (cell mL−1) (A), autotrophic
eukaryotes (cell mL−1) (B), and percentage of heterotrophic eukaryotes in comparison with
BGD
4, 2667–2697, 2007 Micro-organisms in the South-East Pacific S. Masquelier and D. Vaulot Title Page Abstract Introduction Conclusions References Tables Figures ◭ ◮ ◭ ◮ Back CloseFull Screen / Esc
Printer-friendly Version
Interactive Discussion Fig. 8. Distribution of the percentage of autotrophic eukaryotes smaller than 2 µm (A), between
2 µm and 5 µm (B), and larger than 5 µm (C) in comparison with the total eukaryotes. Legend as in Fig. 6.
BGD
4, 2667–2697, 2007 Micro-organisms in the South-East Pacific S. Masquelier and D. Vaulot Title Page Abstract Introduction Conclusions References Tables Figures ◭ ◮ ◭ ◮ Back CloseFull Screen / Esc
Printer-friendly Version
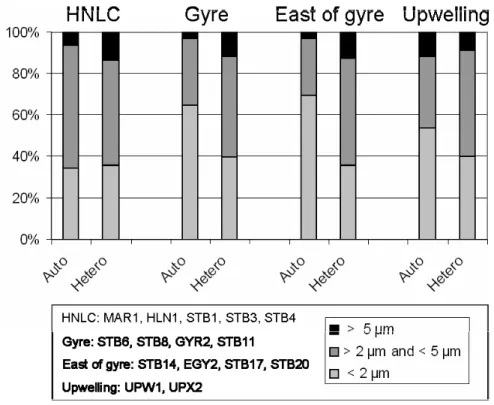
Interactive Discussion Fig. 9. Contribution of the different size classes for the autotrophic (Auto) and heterotrophic
(Hetero) eukaryotes at the depth of chlorophyll maximum for the HNLC, Gyre, East of gyre and Chile upwelling regions.
BGD
4, 2667–2697, 2007 Micro-organisms in the South-East Pacific S. Masquelier and D. Vaulot Title Page Abstract Introduction Conclusions References Tables Figures ◭ ◮ ◭ ◮ Back CloseFull Screen / Esc
Printer-friendly Version
Interactive Discussion Fig. 10. Distribution of total dinoflagellates (cell mL−1) (A), percentage of autotrophic
dinoflag-ellates (B), percentage of heterotrophic over total dinoflagdinoflag-ellates (C), and percentage of green over total heterotrophic dinoflagellates (D). Legend as in Fig. 6.
BGD
4, 2667–2697, 2007 Micro-organisms in the South-East Pacific S. Masquelier and D. Vaulot Title Page Abstract Introduction Conclusions References Tables Figures ◭ ◮ ◭ ◮ Back CloseFull Screen / Esc
Printer-friendly Version
Interactive Discussion Fig. 11. Vertical profiles of concentrations (cell mL−1) of total heterotrophic dinoflagellates
BGD
4, 2667–2697, 2007 Micro-organisms in the South-East Pacific S. Masquelier and D. Vaulot Title Page Abstract Introduction Conclusions References Tables Figures ◭ ◮ ◭ ◮ Back CloseFull Screen / Esc
Printer-friendly Version
Interactive Discussion Fig. 12. Distribution of ciliates (cell mL−1). Legend as in Fig. 6.
![[PDF] Apprendre la programmation Android avec base de données - Free PDF Download](data:image/gif;base64,R0lGODlhAQABAIAAAP///wAAACH5BAEAAAAALAAAAAABAAEAAAICRAEAOw==)