HAL Id: hal-02935280
https://hal.sorbonne-universite.fr/hal-02935280
Submitted on 10 Sep 2020
HAL is a multi-disciplinary open access
archive for the deposit and dissemination of
sci-entific research documents, whether they are
pub-lished or not. The documents may come from
teaching and research institutions in France or
abroad, or from public or private research centers.
L’archive ouverte pluridisciplinaire HAL, est
destinée au dépôt et à la diffusion de documents
scientifiques de niveau recherche, publiés ou non,
émanant des établissements d’enseignement et de
recherche français ou étrangers, des laboratoires
publics ou privés.
scattering media
Amaury Badon, Victor Barolle, Kristina Irsch, A. Claude Boccara, Mathias
Fink, Alexandre Aubry
To cite this version:
Amaury Badon, Victor Barolle, Kristina Irsch, A. Claude Boccara, Mathias Fink, et al.. Distortion
matrix concept for deep optical imaging in scattering media. Science Advances , American Association
for the Advancement of Science (AAAS), 2020, 6 (30), pp.eaay7170. �10.1126/sciadv.aay7170�.
�hal-02935280�
O P T I C S
Distortion matrix concept for deep optical
imaging in scattering media
Amaury Badon1, Victor Barolle1, Kristina Irsch2,3, A. Claude Boccara1,
Mathias Fink1, Alexandre Aubry1*
In optical imaging, light propagation is affected by the inhomogeneities of the medium. Sample-induced aberrations and multiple scattering can strongly degrade the image resolution and contrast. On the basis of a dynamic correction of the incident and/or reflected wavefronts, adaptive optics has been used to compensate for those aberrations. However, it only applies to spatially invariant aberrations or to thin aberrating layers. Here, we propose a global and noninvasive approach based on the distortion matrix concept. This matrix basically connects any focusing point of the image with the distorted part of its wavefront in reflection. A singular value decomposition of the distortion matrix allows to correct for high-order aberrations and forward multiple scattering over multiple isoplanatic modes. Proof-of-concept experiments are performed through biological tissues including a turbid cornea. We demonstrate a Strehl ratio enhancement up to 2500 and recover a diffraction-limited resolution until a depth of 10 scattering mean free paths.
INTRODUCTION
For decades, optical microscopy has been a vital tool in biomedical research to observe live specimens with a submicrometer resolution and with minimal invasiveness. Yet, imaging conditions required for these exquisite performances are rarely gathered. For instance, both the resolution and the contrast drop as the imaging depth in-creases inside a biological tissue. This observation is a consequence of the spatial variations of the specimen’s refractive index that distort the wavefront of both the incoming and outgoing light. When these variations exhibit low spatial frequencies, we use the term aberrations while scattering describes the effect of the higher spatial variations. Both these effects limit the use of conventional microscopy to shallow depths or to semitransparent specimens. Imaging deeper requires to simultaneously compensate for these detrimental phenomena.
To mitigate the aberrations induced by the specimen, the concept of adaptive optics (AO) has been adapted to microscopy from astronomy where it was developed decades ago (1, 2). Astronomers faced the same impediment as fluctuations in the atmosphere severely distort the wavefront of the light coming from stars and prevent to obtain a diffraction-limited stellar image. Astronomers then proposed to measure these distortions using a wavefront sensor and to counter-balance it with a dynamic programmable element such as deformable mirrors. Following this concept and the development of deformable mirrors with increasing number of elements, AO already demon-strated its benefits in various imaging techniques such as digital holog-raphy (3, 4), confocal microscopy (5, 6), two-photon microscopy (7–10), or optical coherence tomography (OCT) (11, 12). Unfortunately, AO methods usually require a guide star or are based on an image sharpness metric. In addition, they are limited to a small region called the isoplanatic patch (IP), the area over which the aberrations can be considered as spatially invariant. Therefore, there is a need to
extend the field of view of AO methods by tackling the case of multiple IPs. This issue is particularly decisive for deep imaging where IP size becomes extremely tiny: <10 m beyond a depth of 1 mm (13). Note that multiconjugate AO can deal with multiple IPs, but this is at the price of a much more complex optical setup (14–16).
On the other hand, multiple scattering was long thought to be too complex to be compensated. For deep imaging, a gating mecha-nism is generally used to reject the multiply scattered photons and capture only the ballistic light. This gating can be spatial (17) as in confocal microscopy or temporal (18) as in OCT, but they are still depth limited as they rely on the exponentially attenuated ballistic light. In a pioneering experiment, Vellekoop and Mosk (19) demon-strated in 2007 the possibility to restore a diffraction-limited spot through a scattering medium by properly shaping the incoming light. Subsequently, a matrix approach of light propagation through complex media was developed (20). Relying on the measurement of the Green’s functions between each pixel of a spatial light modulator (SLM) and of a charge-coupled device (CCD) camera across a scatter-ing medium, the experimental access to the transmission matrix allows taking advantage of multiple scattering for optimal light focusing (20) and communication across a diffusive layer (21, 22) or a multimode fiber (23, 24). However, a transmission configuration is not adapted to noninvasive and/or in vivo imaging of biological media. An epidetection geometry should thus be considered (25). During the last few years, the reflection matrix R had been investigated to perform selective focusing/detection (26, 27) or energy delivery (28, 29) through strongly scattering media. With regard to the specific purpose of imaging, the matrix approach has been recently used to implement AO tools in postprocessing. The single scattering com-ponent of the reflected wave field through biological tissues has been enhanced in depth by compensating for high-order aberrations (30, 31).
Here, we propose to go beyond a matrix approach of AO by in-troducing a novel operator: the so-called distortion matrix D. Un-like previous works that investigated R either in the focal plane (27) or the pupil plane (26, 30, 31), we here consider the medium response between those dual bases (32, 33). Unlike R, the D-matrix does not consider the reflected wave field as a building block but its deviation from an ideal wavefront that would be obtained in the absence of
1Institut Langevin, ESPCI Paris, PSL University, CNRS, 1 rue Jussieu, 75005 Paris, France. 2Vision Institute/Quinze-Vingts National Eye Hospital, Sorbonne University, CNRS UMR 7210, INSERM U 068, 17 rue Moreau, 75012 Paris, France. 3The Wilmer Eye Institute, The Johns Hopkins University School of Medicine, Baltimore, MD, USA. *Corresponding author. Email: alexandre.aubry@espci.fr
Copyright © 2020 The Authors, some rights reserved; exclusive licensee American Association for the Advancement of Science. No claim to original U.S. Government Works. Distributed under a Creative Commons Attribution NonCommercial License 4.0 (CC BY-NC). on September 10, 2020 http://advances.sciencemag.org/ Downloaded from
aberrations and without multiple scattering. This operation may seem trivial but it markedly highlights the input/output correlations of the wave field. While the canonical reflection matrix exhibits a random feature in a turbid medium, the distortion matrix displays strong field-field correlations over each IP. Thanks to this new operator, some relevant results of information theory can thus be fruitfully applied to optical imaging. A singular value decomposi-tion (SVD) of D allows a partidecomposi-tion of the field of illuminadecomposi-tion (FOI) into orthogonal isoplanatic modes (IMs) and extracts the associated wavefront distortion in the pupil plane. The Shannon entropy ℋ of the singular values allows one to define the effective rank of the imaging problem. A combination of the ℋ first eigenstates yields an image of the focal plane with an excellent contrast and a diffraction- limited resolution as if the medium ahead was made perfectly transparent.
Several experiments with an increasing order of complexity are presented to demonstrate the benefits of the D-matrix for optical imaging in turbid media. For the sake of simplicity, the first experi-ment involves the imaging of a single IP through a thick layer of biological tissues. This configuration allows us to lay down the D-matrix concept and highlight the physics behind it. Then, a second proof-of-concept experiment considers a thin but strong aberrating layer introduced between the microscope objective (MO) and a resolution target. This imaging configuration involves a spatially varying aberration across the FOI (i.e., several IPs). Last, we de-scribe an imaging experiment through a turbid nonhuman primate cornea that induces high-order aberrations (including forward multiple scattering) and a strong diffuse multiple scattering background. The D-matrix decomposes the imaging problem into a set of IMs whose degree of complexity increases with their rank (i.e., smaller spatial extent in the focal plane and higher phase distortion in the pupil plane). This last experiment demonstrates the ability of our matrix approach to discriminate between forward multiple scatter-ing paths, which can be taken advantage of for imagscatter-ing, and the diffuse background, which shall be removed from the final image. RESULTS
Time-gated reflection matrix
The D-matrix concept first relies on the measurement of the time- gated reflection matrix R from the scattering sample. Until now, optical transmission/reflection matrices have always been investi-gated either in the k-space (plane-wave basis) (20, 30) or in the real space (focused basis) (27). Here, the R-matrix will be defined between those dual bases. This choice is dictated by our will to go beyond the study of restricted isoplanatic fields of view and tackle space-variant aberrations. Waves produced by nearby points inside a complex medium can generate highly correlated, but tilted, random speckle patterns in the far field (34). In a focused basis, this corresponds to a spatially invariant point spread function (PSF) over an area called the IP. As we will see, only a dual-basis matrix can highlight these angular correla-tions that persist over a restricted spatial domain in the focal plane.
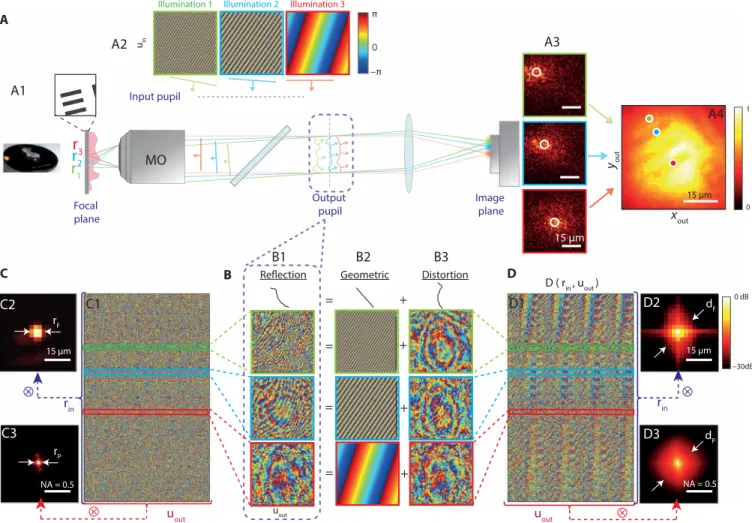
The experimental setup has already been described in a previous work (27) and is displayed in fig. S1. The experimental procedure is detailed in Materials and Methods. In a few words, the sample is illuminated through a MO by a set of focused waves (input focusing basis; see Fig. 1A). For each illumination, the amplitude and phase of the reflected wave field is recorded by phase-shifting interferometry on a CCD camera placed in the pupil plane (output pupil basis). A coherent time gating is also applied to select ballistic and snake photons
while eliminating a (large) part of the diffuse photons. A set of time- gated reflection coefficients, R(uout, rin), is lastly measured between each virtual source in the focal plane identified by the vector rin at the input and each point of the pupil plane identified by the vector
uout at the output. These coefficients form the reflection matrix R (see Fig. 1D).
The first imaging problem that we consider in this paper deals with an experiment through biological tissues (see Fig. 1A). A positive U.S. Air Force (USAF) 1951 resolution target placed behind an 800-m-thick rat intestinal tissue is imaged through an immersion objective [40×, NA (numerical aperture), 0.8; Nikon]. The rat intes-tinal tissue displays a refractive index n ∼ 1.4, a scattering mean free path 𝓁s of the order of 150 m and an anisotropy factor g ≃ 0.9 (35). The reflection matrix R is measured over a FOI × = 41 × 41 m2 with Nin = 729 input wavefronts, a spatial sampling rin = 1.6 m, and an input pupil aperture D in × D in = 1.7 × 1.7 mm 2 . This reduced pupil diameter corresponds to the size of the illumination beam (see fig. S2). At the output, the wave field is recorded over a pupil size of D out × D out = 4.5 × 4.5 mm 2 with Nout = 6084 pixels and a spatial sampling uout = 68 m. The corresponding field of view is 60 × 60 m2. This experimental configuration corresponds to an imaging condition for which time gating guarantees that the reflection matrix contains a fraction of ballistic or snake photons reflected by the resolution target (see fig. S3). However, aberrations are so intense that the full-field image of the resolution target is dominated by the diffuse multiple scattering background (see Fig. 1A4).
Figure 1B1 displays examples of reflected wave fields for several virtual sources rin. Each wave field is stored along a column vector and forms the reflection matrix R = [R(uout, rin)]. R exhibits a four-dimensional (4D) structure but is concatenated both at the input and output to be displayed in 2D (see fig. S4). The phase of R is displayed in Fig. 1C1. Its spatial and angular correlations in the focal and pupil planes are displayed in Fig. 1 (C2 and C3, respectively). As it could be conjectured from the column vectors displayed in Fig. 1B1, the matrix R only displays short-range correlations. This is quite unexpected as the object to be imaged is deterministic and contained in a single IP. To understand this seemingly randomness of R and reveal its hidden correlations, we now investigate its theoretical ex-pression. The reflection matrix can be expressed as follows (see fig. S5)
R = T H in (1)
or, in terms of matrix coefficients
R( u out , r in ) =
∫
T( u out , r ) γ(r ) H in (r, r in ) dr (2) Hin = [Hin(r, rin)] is the input focusing matrix. Its columns are none other than the input focal spots centered around each focus-ing point rin (see fig. S5). Under a single scattering assumption, is a diagonal matrix whose elements (r) map the reflectivity of the object in the focal planes. This object is here assumed to cover the whole FOI. T is the transmission matrix between the focal and pupil planes (see fig. S5). Its elements T(uout, r) describe the propagation of the wave field from a point r in the MO focal plane to a detectoruout in the output pupil plane. Theoretically, the correlation length
rP of the reflected wave field in the pupil plane scales as f/ (see section S1), while its correlation length rF in the focal plane is dictated by the coherence length of the input focal spots, that is to say, the input diffraction limit, in0 ∼ f / D
in , in a strong aberration regime (see section S2). This accounts for the spatial incoherence exhibited by R both at its input (Fig. 1C2) and output (Fig. 1C3), respectively.
on September 10, 2020
http://advances.sciencemag.org/
In the next section, we show how to reveal the hidden correlations in R to, subsequently, extract the transmission matrix T.
Principle of the distortion matrix
The holy grail for imaging is indeed to have access to this transmission matrix T. Its inversion or pseudoinversion would actually allow to reconstruct a reliable 3D image of the scattering medium, thereby overcoming aberration and multiple scattering effects generated by the medium itself. However, in most imaging configurations, the true transmission matrix T is not accessible as it would require an invasive measurement. The common assumption in wave imaging is thus to consider a homogeneous medium model. The free space transmission matrix T0 should then be considered. Its elements
T0(uout, r) are simply given by
T 0 ( u out , r in ) = 1 ─jλf exp [ j 2π ─λf u out . r ] (3) where f is the MO’s focal length and the central wavelength.
In this work, we will use T0 as a reference matrix. The columns of T0 are actually the reflected wave fields that would be obtained in an ideal case, i.e., without aberrations. In the Fourier space, the phase of the complex wave field, or wavefront, is particularly ade-quate to study the effect of aberrations. Figure 1B compares few ex-amples of reflected wavefronts (columns of R; see Fig. 1B1) with the corresponding ideal wavefronts (columns of T0; see Fig. 1B2). While the latter ones display plane-wave fringes whose orientation and spatial frequency are related to the position rin of the input focusing point, the recorded wavefronts consist in a stack of this geometrical component with a distorted phase component induced by the biological tissues. The key idea of this paper is to isolate the latter contribution by subtracting the recorded wavefront by its ideal counterpart. Mathematically, this operation can be expressed as a Hadamard product between R and T 0* (where * stands for phase conjugate) D = R ∘ T 0* (4) Geometric Distortion = = + + = + Input pupil Illumination 1 Illumination 2 A MO Focal plane
r
3r
2 Illumination 3 Image plane Output pupil C B D xout yout uin = + uout D ( rin , uout )r
1 1 0 0 dB −30dB 0 π −π ⊗ rin uout ⊗ ⊗ uout rin ⊗ 15 µm NA = 0.5 A2 A1 A3 A4 B1 B2 B3 C1 C2 C3 D1 D2 D3 15 µm 15 µm 15 µm NA = 0.5 dP dF rP rFFig. 1. Principle of the distortion matrix approach. (A) A resolution target (USAF 1951) is positioned underneath an 800-m-thick sample of rat intestine (A1). In scanning microscopy, raster scanning in the focal plane is obtained using a set of plane-wave illuminations in the input pupil (A2). In the presence of sample-induced aberrations, the detected intensity will exhibit a much larger extent compared to the ideal PSF (A3). The resulting full-field image displays a low contrast and a reduced resolution (A4). (B) In the output pupil plane, the phase of the reflected wave field (B1) can be split into a diffraction (B2) and a distortion (B3) term. (C and D) The reflected distorted wave fields can be stored along column vectors to form the reflection and distortion matrices, R and D, respectively. The phase of R and D is displayed in (C1) and (D1), respec-tively. The autocorrelations of the complex reflected/distorted wave fields are computed in the focal (C2/D2; see section S2) and in the pupil (C3/D3; see section S1) planes, both in dB. All the data shown here are extracted from the rat intestine imaging experiment. Photo credit: Amaury Badon, CNRS. NA, numerical aperture.
on September 10, 2020
http://advances.sciencemag.org/
which, in terms of matrix coefficients, can be written as
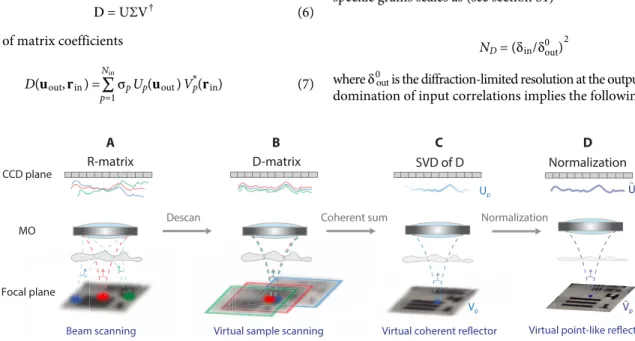
D( u out , r in ) = R( u out , r in ) × T 0* ( u out , r in ) . (5) The matrix D = [D(uout, rin)] is the so-called distortion matrix. Removing the geometrical component of the reflected wave field in the pupil plane as done in Eq. 4 amounts to a change of reference frame. While the original reflection matrix is recorded in the object’s frame (static object scanned by the input focusing beam; see Fig. 2A), the D-matrix is a reflection matrix in the frame of the input focus-ing beam (movfocus-ing object illuminated by a static beam; see Fig. 2B). Physically, this corresponds to a descan of the reflected light as per-formed in confocal microscopy.
The D-matrix deduced from R is displayed in Fig. 1D1. Compared to R (Fig. 1C1), it exhibits long-range correlations both in the pupil (Fig. 1D3) and focal (Fig. 1D2) planes, respectively. On the one hand, by virtue of the van Cittert Zernike theorem (36), the coherence length dP of the distorted wave field in the pupil plane scales as f/in, with in being the spatial extension of the incoherent input focal spot ∣Hin∣2 (see section S2). On the other hand, its correlation length dF in the focal plane corresponds to the size 𝓁c of the IP (see section S2). This is illustrated by examples of distorted wave fields displayed in Fig. 1B3. While the original reflected wavefronts did not exhibit any similarity, the distorted component displays similar Fresnel rings whatever the focusing point rin. The D-matrix thus reveals input/output correlations of the wave field that were originally completely hidden in the original R-matrix (Fig. 1C).
SVD of the distortion matrix
The next step is to extract and take advantage of those field-field correlations for imaging. To that aim, an SVD of the distortion matrix is performed. It consists in writing D as follows
D = UΣV † (6)
or, in terms of matrix coefficients D( u out , r in ) = ∑
p=1 N in
p U p ( u out ) V p* ( r in ) (7)
Σ is a diagonal matrix containing the real positive singular values i in a decreasing order 1 > 2 > . . > Nin. U and V are unitary matrices whose columns, Up = [Up(uout)] and Vp = [Vp(rin)], corre-spond to the output and input singular vectors, respectively. The symbol † stands for transpose conjugate. Mathematically, the SVD extracts a signal subspace associated with the largest singular values and characterized by an important correlation between its lines and/or columns. In the D-matrix, these correlations are induced by the isoplanicity of the input PSF Hin. The single scattering and forward multiple scattering contributions are expected to lie along the signal subspace since they exhibit a spatial invariance over each IP (37). On the contrary, the diffuse photons induced by the scattering layer ahead of the focal plane give rise to a fully incoherent wave field that will be equally distributed over all the eigenstates of D (38). Hence, the pollution of the signal subspace by the multiple scattering noise scales as the inverse of the number of independent input focusing points mapping each IP, ( ℓ c / in0 ) 2 . A large IP enables the SVD to drastically decrease the multiple-to-single scattering ratio.
To know which of the input or output correlations will dictate the SVD of D, relevant parameters are the numbers of independent speckle grains, MD and ND, exhibited by D at its input and output, respectively. The correlation degree of the distorted wave field in each plane is actually inversely proportional to the corresponding number of independent speckle grains. In the focal plane, MD is given by the squared ratio between the FOI and the coherence length dF of the distorted wave field in the focal plane
M D = ( / d F ) 2. (8)
dF is the minimum between the isoplanatic length 𝓁c and the characteristic fluctuation length 𝓁 of the object’s reflectivity (see section S2). In the pupil plane, the number ND of independent speckle grains scales as (see section S1)
N D = ( in / out0 ) 2 (9) where 0
out is the diffraction-limited resolution at the output (Eq. 13). The domination of input correlations implies the following condition
Virtual sample scanning
Beam scanning Virtual coherent reflectorual coherent refcoherent reflele Virtual point-like reflector
CCD plane
MO
Focal plane
Descan Coherent sum
A B C R-matrix D-matrix SVD of D Normalization Normalization D al point-like refle ^ ning ning Beam scann lane m scann
Beamm scann uual sample scannal sample scannp in
Vp
p Up
Vp
^
U
Fig. 2. Extracting the aberration transmittance from the distortion matrix D. (A) The recording of the R-matrix consists in scanning the objects with a moving input focusing beam. (B) The removal of the geometric component in each reflected wavefront (Eq. 4) amounts to recenter each incident focal spot at the origin. The D-matrix is equivalent to the reflection matrix for a moving object. (C) The SVD of D leads to a coherent sum of the distorted wavefronts in the pupil plane. A coherent reflector is virtually synthesized in the focal plane, and the corresponding wavefront emerges along the output singular vector U1. The corresponding image of the object is provided by the first input singular vector V1, but its resolution is dictated by the width in of the input focusing beam. (D) A normalization of U1 in the pupil plane makes the virtual scatterer point like. The corresponding input singular vector ˆ V 1 yields a diffraction-limited image of the object in the focal plane.
on September 10, 2020
http://advances.sciencemag.org/
M D < N D (10) If 𝓁 > 𝓁c, then the last equation can be translated as follows: The number MD = (/𝓁c)2 of IPs supported by the FOI should be smaller than the number ND of resolution cells that map each input focus-ing beam (Eq. 9). As we will see, this strong aberration condition is fulfilled in the experiments presented in this work.
When input correlations dominate, the effective rank of the signal subspace then corresponds to the number of independent spatial modes required to map the distorted wave field in the focal plane, i.e., the number MD of IPs. As shown in section S3, the SVD decomposes the FOI onto a set of orthonormal IMs defined by the input singular vectors Vp. The corresponding output singular vectors
Up yield the associated aberration phase laws in the pupil plane. Their coherent combination can then lead to the retrieval of the transmission matrix T. In the next sections, we will check all these promising properties of D experimentally and see how we can take advantage of it for deep imaging.
Imaging over a single IP
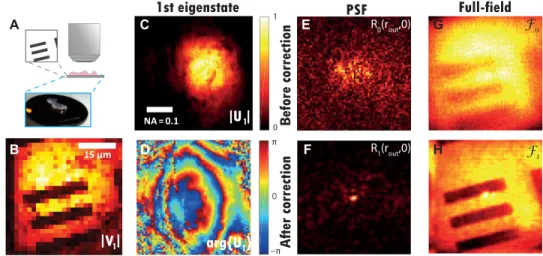
The reflection and distortion matrices corresponding to the imaging experiment through a thick layer of rat intestine are shown in Fig. 1 (C1 and D1, respectively). The long-range spatial correlations ex-hibited by D (Fig. 1D2) seem to indicate that the isoplanatic hypothesis is close to being fulfilled in this experiment. The SVD of D confirms this intuition by exhibiting a predominant eigenstate. The correspond-ing scorrespond-ingular vectors V1 and U1 are displayed in Fig. 3. The modulus of V1 displays a contrasted image of the resolution target (Fig. 3B), but its resolution is limited by the low spatial sampling of the illumina-tion scheme. The output singular vector U1 corresponds to the wave-front induced by a virtual coherent reflector of scattering distribution ∣Hin(r − rin)∣2, hence located on the optical axis in the focal plane (see Fig. 2C). This virtual scatterer results from a coherent summa-tion of the descanned input focal spots through the SVD process (see section S3). Its phase is made of Fresnel rings mainly induced by the irregular surface of the sample and its index mismatch with the surrounding fluid (Fig. 3D). Its finite support is explained by the finite size in of the coherent reflector (Fig. 3C). To make this virtual scatterer point like and retrieve a diffraction-limited image (Fig. 2D), a normalized vector ˜ U 1 should be considered, such that ˜ U 1 ( u out ) =
U 1 ( u out ) / ∣ U 1 ( u out ) ∣ . ˜ U 1 can be used to build an estimator ˆ T of the transmission matrix between the pupil and focal planes, such that its coefficients read
ˆ
T p ( u out , r in ) = ˜ U p ( u out ) T 0 ( u out , r in ) (11) with p = 1 in the present case. This estimator can be used to project the recorded matrix R in the focal basis both at input and output, such that
R p = ˆ T p† R (12) The coefficients R1(rout, rin) are the impulse responses between each input focusing point rin and each output imaging point rout. In other words, once reshaped in 2D, each column of R1 yields the PSF of the imaging system at the input focusing point rin. The PSF for an input focusing point on the optical axis (rin = 0) is displayed in Fig. 3F. For the sake of comparison, the corresponding initial focal spot is displayed in Fig. 3E. The latter one is extracted from the focused matrix R0 deduced from R using T 0 : R 0 = T 0† R . While the
initial PSF exhibits a random speckle pattern (Fig. 3E), the PSF after correction shows a nearly diffraction-limited focal spot with almost all the energy concentrated in the vicinity of the incident focusing point (Fig. 3F). The apparent width of this PSF yields an estimation of the local output resolution out at rin. Here, out goes from 20 m on the raw data (Fig. 3E) to 1.2 m after the matrix correction (Fig. 3F). This value should be compared to the diffraction-limited resolution
out0 = ─
2 NA out (13) with NA out = D out / (2f ) = 0.45 being the output NA. The numerical application of this formula yields out0 ≃ 0.9 m in our experimental configuration. The mismatch between out and out0 comes from the noisy aspect of U1 at large spatial frequencies (see Fig. 3D), which prevents from an efficient aberration compensation over the whole NA.
If the spatial sampling was equivalent at input and output, then a confocal image could be deduced from the diagonal elements (rin =
rout) of R0 and R1 (27). Here, as a sparse illumination scheme has been used ( r in > out0 ) , a full-field image is considered and obtained by summing R over its input elements
ℱ p ( r out ) = ∑ r
in ∣ R p ( r out , r in )∣ (14)
with p = 0 or 1 here. The corresponding images ℱ0 and ℱ1 are dis-played in Fig. 3 (G and H, respectively). While the patterns of the resolution target are hardly visible on the raw image, the D-matrix approach provides a highly contrasted image of the target. To quantify this gain in image quality, the Strehl ratio is a relevant parameter (39). It is defined as the ratio of the PSF peak intensity with and without aberration. Equivalently, it can also be defined in the pupil plane as the squared magnitude of the mean aberration phase factor. Its initial value S 0 can thus be directly derived from the D-matrix coefficients
S 0 = ∣〈exp (jarg { D( u out , r in ) V 1 ( r in ) }) 〉∣ 2 (15) where the symbol 〈⋯〉 denotes an average over uout and rin. In the present case, the original Strehl ratio is S0 = 8 × 10⁻⁵. This experi-ment corresponds to imaging conditions far from being in the range of operation of conventional AO and explains why the patterns of the resolution target are so hardly visible on the raw image (Fig. 3G). The Strehl ratio S 1 after the U1 correction can be directly extracted from the SVD of D (Eq. 7)
S 1 = ∣〈exp (jarg { U 1* ( u out ) D( u out , r in ) V 1 ( r in ) }) 〉∣ 2 (16) The D-matrix correction leads to a Strehl ratio S1 = 3 × 10⁻³. However, Eq. 16 gives the same weight to bright and dark areas of the resolution target in the focal and pupil planes. One possibility is to consider a weighted average instead of Eq. 16 by the object reflec-tivity ∣V1(rin)∣2. This weighted Strehl ratio S 1′ then reaches the value of 1.1 × 10⁻². Such a Strehl ratio value is relatively low, but it should be kept in mind that the distortion matrix is associated with a PSF in reflection that convolves the transmit and receives PSFs. Our measurement of the Strehl ratio is thus degraded by (i) the sub-sistence of input aberrations and (ii) the presence of a diffuse multiple scattering background that acts here as an additive noise. Note, however, that the gain in terms of Strehl ratio is absolute; this is the
on September 10, 2020
http://advances.sciencemag.org/
relevant quantity to assess the benefit of our matrix approach. This gain here is spectacular ( S 1′ / S ′ ∼ 140) and accounts for the satisfying 0 image of the resolution target obtained after the D-matrix correc-tion (see Fig. 3H). Figure S3 shows how this drastic improvement of the Strehl ratio allows us to push back the imaging depth limit from 450 m to almost 1 mm.
This first experiment demonstrates the benefit of the D-matrix in the simple case of an FOI containing a single IP. In the next section, the case of multiple IPs is tackled.
Imaging over multiple IPs
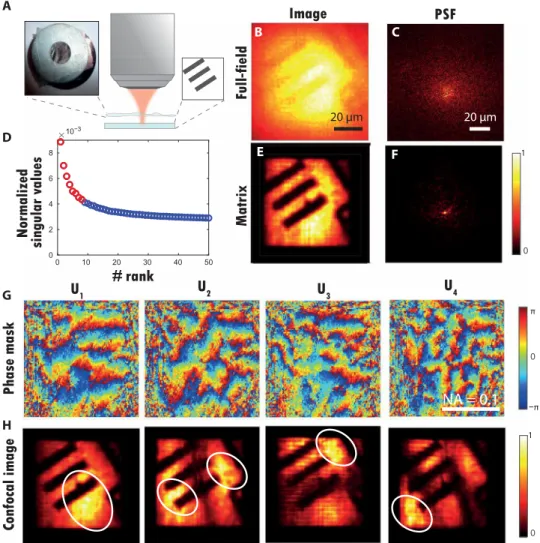
The first element of the group 6 in the resolution target is now im-aged through an aberrating layer consisting in a rough plastic sheet placed d = 1 mm above the resolution target (USAF 1951) (see Fig. 4A). The reflection matrix R is measured over a FOI of 57 × 57 m2 with N
in = 441 input wavefronts, a spatial sampling rin = 2.85 m, and an input pupil aperture D in × D in = 1.3 × 1.3 mm 2 . At the output, the wave field is recorded over a pupil size of D out × D out = 2 × 2 mm 2 with Nout = 12,321 pixels and a spatial sampling uout = 18 m.
The full-field image ℱ0 (Eq. 14) and an example of PSF (Eq. 12) are displayed in Fig. 4 (A and B, respectively). The PSF is strongly degraded with a characteristic focal spot dimension out ∼ 45 m. This PSF dimension allows an estimation of the coherence length 𝓁c of the aberrating layer. Under a thin phase screen model (37), the IP dimension 𝓁c coincides with the coherence length of the aberration transmittance. It turns out that the PSF width is inversely propor-tional to 𝓁c in this experiment: out ∼ d/𝓁c. The IP size and the number of IPs supported by the FOI can be deduced from the PSF width : 𝓁c ∼ 18 m and MD ∼ (/𝓁c)2 ∼ 10.
A D-matrix is deduced from R (Eq. 4). Its analysis leads to the following estimation of the initial Strehl ratio: S ′ = 1.6 × 10 0 −6 (Eq. 15). This particularly strong aberration level accounts for the highly blurred aspect of the full-field image in Fig. 4A. This experimental situation is thus particularly extreme, even almost hopeless, for a successful imaging of the resolution target. Yet, the SVD of D will provide the solution.
Figure 4D displays the histogram of the normalized singular values ˜ σ p = σ p / ∑ i=1 N in σ i . If recorded data were not corrupted by experimental noise, then the matrix would be of effective rank MD. We could use all the eigenstates of D associated with nonzero singular values to retrieve an image of the object. In Fig. 4D, only few singular values seem to emerge from the noise background. Hence, it is dif-ficult to determine the number of eigenstates that we need to consider to properly reconstruct an image of the object. This issue can be circumvented by computing the Shannon entropy ℋ of the singular values (40, 41), such that
ℋ( ˜ i ) = − ∑ i=1
N in
˜ i log 2 ( ˜ i ) (17) Shannon entropy delivers the maximally noncommittal dataset at a given signal-to-noise ratio, that is to say, the most information with the least artifact. The Shannon entropy can be used as an indica-tor of how many eigenstates are needed to build an adequate image of the object without being affected by experimental noise.
The singular values of Fig. 4D have an entropy H≃ 8.4. Hence, only the eight first singular states shall be considered. Figure 4G displays the phase of the four first singular vectors Up in the pupil plane. They display phase distortions whose typical coherence length uc scales as f𝓁c/d ∼ 100 m. The phase conjugation of these singular vectors should compensate for the detrimental effect of the aberrating layer in different parts of the FOI. A set of focused reflec-tion matrices Rp can be deduced (Eq. 12). Figure 4F displays an example of corrected PSF extracted from a column of R1. Its com-parison with the original PSF in Fig. 4C shows how the phase con-jugation of U1 allows one to compensate for the aberrations at this incident focusing point. On the one hand, the PSF width is nar-rowed by a factor of 20, going from out ∼ 45 m to 2.25 m. The latter value should be compared with the diffraction-limited resolu-tion out0 ∼ 2 m (Eq. 13) in our experimental conditions. The Strehl ratio is increased by a factor of 2.2 ×10³ to reach the final value S 1 ′ = 3.5 × 10 −3 (Eq. 16). Again, this value of the Strehl ratio is probably underestimated because of input aberrations and multi-ple scattering. 0 π 1 0 E F G H −π B R0(rout,0) R1(rout,0) C A D AB
Fig. 3. Imaging through a thick layer of rat intestinal tissue. (A) Experimental configuration. (B and C) Modulus of the first input singular vector V1 of D in the focal plane. (D) Modulus and phase of the first output singular vector Up in the pupil plane. (E) Example of PSF deduced from the central column (rin = 0) of the raw focused matrix R0. (F) Corresponding corrected PSF deduced from the central column of the focused matrix R1 (Eq. 12). (G and H) Comparison of the full-field images ℱ0 and ℱ1 (Eq. 14) before and after aberration correction. Photo credit: Amaury Badon, CNRS.
on September 10, 2020
http://advances.sciencemag.org/
Confocal images can be deduced from the focused reflection matrices Rp
ℐ p ( r out ) = ∑ r
in ∣ R p ( r out , r in ) ∣ e
− ‖ r out − r in ‖ 2 /2 l p2 (18) where lp is the aperture of the numerical confocal pinhole (27). This finite aperture enables an average of the output image over neigh-bor incident focusing points to smooth out the sparse illuminations. Figure 4H displays the confocal images ℐp for lp = 2 m. For a spec-ular object such as a resolution target, the SVD has indeed the prop-erty of decomposing into a set of orthogonal IMs of spatial period 𝓁c (see section S3). Their shape depends on the autocorrelation function of the aberrating phase screen. A general trend is that the spatial frequency content of the eigenvectors increases with their rank. If this function presents an exponential or sinc model, then the FOI will be spatially decomposed into sinusoidal wave functions (42) analogous to optical fiber modes or to prolate spheroidal wave func-tions (43), respectively. Here, the autocorrelation function of the aberrating phase displays a Gaussian-like shape. The FOI is thus
spatially mapped onto Hermite-Gaussian wave functions analogous to laser cavity modes (44).
The normalized pupil singular vectors ˜ U p yield a set of orthogonal phase transmittances that map aberrations onto each IM. A coherent combination of these singular vectors should lead, in principle, to a satisfying estimator of the transmission matrix (see section S3)
ˆ T = ∑
p=1 ℋ( ˜ i )
˜ U p ∘ T 0 (19) In practice, a final image ℐ of the resolution target can be obtained by summing the previous IMs ℐp
ℐ( r out ) = ∑
p=1 ℋ( ˜ i )
ℐ p ( r out ) (20) The final result is displayed in Fig. 4E. The comparison with the initial full-field image (Fig. 4B) illustrates the benefit of the D-matrix approach. Spatially varying aberrations are overcome, and a con-trasted image of the resolution target is recovered over the whole
0 10 20 30 40 50 0 2 4 6 8 10−3 A B C E D F 0 π 1 −π π 0 1 0 20 µm 20 µm G H
NA = 0.1
Fig. 4. Matrix imaging over multiple IPs. (A) Schematic of the experiment. A resolution target (USAF 1951) is positioned at a distance d = 1 mm underneath a rough plastic film (see inset). (B) Original full-field image ℱ0 (Eq. 14). (C) Example of PSF deduced from a column of the raw focused matrix R0. (D) Plot of the normalized singular values ˜ of D. The red circles correspond to the eight first singular values (signal subspace), while the noisy singular values are displayed in blue. (E) Matrix image con-structed from the eight first eigenstates of D (Eq. 20). (F) Example of PSF deduced from a column of the corrected focused matrix R1. (G) Phase of the four first singular vectors Up. (H) Confocal images deduced from the focused reflection matrices Rp (Eq. 18). Photo credit: Amaury Badon, CNRS.
on September 10, 2020
http://advances.sciencemag.org/
FOI. This experiment demonstrates how the D-matrix enables a decomposition of the FOI into several IMs and a mapping of each of them onto orthonormal distorted phase laws. However, this demonstration has been restricted to the case of a 2D aberrating phase layer. In the next section, we consider the case of a cornea with deteriorated transparency as a 3D aberrating and scattering structure.
Imaging through a hazy cornea
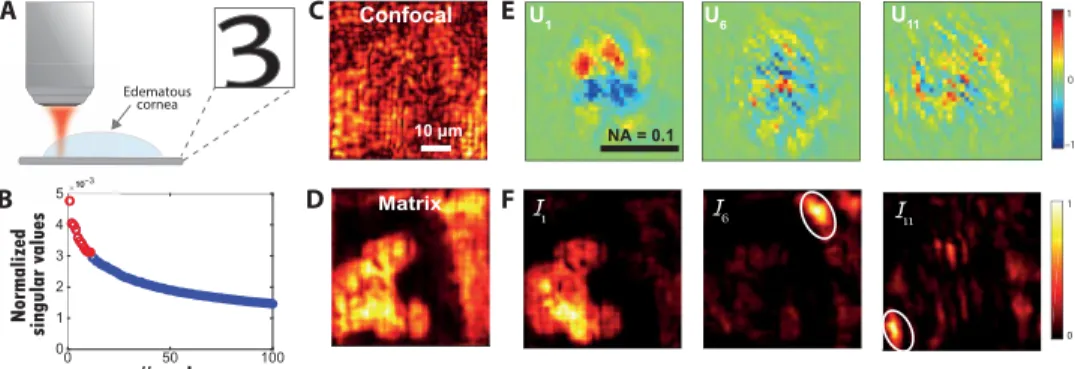
The experimental configuration is displayed in Fig. 5A. The number “3” of the group 5 in the resolution target is imaged through a 700-m-thick edematous nonhuman primate cornea. The reflec-tion matrix R is measured over an FOI of 52 × 52 m2 by means of
Nin = 625 input wavefronts, a spatial sampling rin = 2.1 m, and an input pupil aperture D in × D in = 1 × 1 mm 2 . At the output, the wave field is recorded over an output pupil size D out × D out = 2 × 2 mm 2 with Nout = 1296 pixels and a spatial sampling length uout = 56 m . Figure 5C displays the confocal image ℐ0 deduced from R0 with
lp = 1 m (Eq. 18). Multiple scattering and aberrations induced by the cornea induce a random speckle-reflected wave field that pre-vents from imaging the resolution target. On the contrary, as we will see, the D-matrix analysis allows us to nicely recover the pattern 3 of the resolution target (see Fig. 5D).
Figure 5C displays the spectrum of the singular values ˜ σ p . The first singular value emerges from the rest of the spectrum, but it is difficult to know until which rank the eigenstates can be considered as belonging to the signal subspace. As previously, the Shannon entropy of the singular values yields an unambiguous answer: ℋ( ˜ i ) = 10.7 . The 11th first singular states should thus be consid-ered. Figure 5E displays the 1st, 6th, and 11th singular vectors Up in the pupil plane. The complexity of the wavefront distortion, i.e., their spatial frequency content, increases with the rank of the corre-sponding singular values. The correcorre-sponding IMs ℐp (Eq. 18) are displayed in Fig. 5F. While the first singular vector U1 allows a wide-field correction of low-order aberration, the higher-rank singular vectors are associated with high-order aberrations that are effective over IMs of smaller dimension. In Fig. 5D, the whole spa-tial frequency spectrum of wavefront distortions is lastly compen-sated by smartly combining the confocal images ℐp associated with each singular state from D’s signal subspace (Eq. 20). The compari-son of the initial (Fig. 5C) and final (Fig. 5D) images is spectacular with a Strehl ratio gain S 1′ / S 0′ = 230 . The comparison of ℐ (Fig. 5D) and ℐ1 (see the first inset of Fig. 5F) illustrates the benefit of a matrix approach of aberration correction compared to conventional AO, since the latter one would yield ℐ1 in theory.
This decomposition of complex aberration phase laws over a set of IMs opens important perspectives for aberrometry. It actually goes well beyond state-of-the-art techniques that basically consist in a simple projection over a set of Zernike polynomials. Moreover, an estimator of the single-to-multiple scattering ratio (SMR) can be built on the relative energy between the signal and noise subspaces of D
SMR = ∑ p=1 ℋ( σ i ) σ p 2 ─ ∑ N i=ℋ( σ in i )+1 σ p2 (21)
The SMR can actually be a quantitative biomarker of the corneal opacification or a quantitative measure of corneal transparency (45). On the basis of a fit with a recent analytical study of the SMR (38), the cornea thickness L can be estimated in terms of scattering
mean free path 𝓁s: L ∼ 9𝓁s (see fig. S3). As the corneal thickness is known (L = 700 m), the scattering mean free path can be deduced: 𝓁s ∼ 80 m. This value is in excellent agreement with recent ex vivo measurements of 𝓁s in pathological corneas with compromised transparency (45). The value of 9𝓁s highlights the difficult experi-mental conditions under which the imaging of the resolution target has been successfully achieved.
In conclusion, this last experiment shows the potential of a matrix approach for eye aberrometry and turbidimetry, such as for improved quality control of donor tissue assessment before corneal transplantation (45). Of course, this method is by no means limited to ophthalmic applications. It can be applied to the characterization of any kind of biological tissues provided that we have access to the associated reflection matrix.
DISCUSSION
Here, we present a novel and noninvasive method for aberration compensation and diffraction-limited imaging at large optical depths. This approach relies on a new operator, the so-called distor-tion matrix, that connects a set of input focusing points with the distorted component of the reflected the wave field in the pupil plane. This operator connecting position and spatial frequency has some analogy with the Wigner distribution function (46). However, the Wigner transform applies to a single variable of a function, i.e., to a single vector in a discrete formalism. Here, our position- momentum analysis is performed between the input and output of a reflection matrix.
The concept of distortion matrix is to measure the backscattered waves in a descanned frame while scanning the sample with focused illuminations. This approach has some similarity with a previous AO approach (10) in its hardware configuration. The main difference is that, in this study, wavefronts are averaged by the Shack-Hartmann type of analysis and this AO approach thus relies on an isoplanatic condition. Here lies one of the strengths of our approach. While conventional methods estimate the aberrated wavefront for a single location or averaged over the whole FOI, we propose to study the spatial and angular correlations of the distortion operator through an SVD. In this manner, we demonstrate the efficient compensation of both low- and high-order aberrations over multiple IPs. More-over, our approach relies on the Shannon entropy that provides an objective criterion to determine the number of IPs supported by the FOI. This is in contrast with recent works based on a far-field reflec-tion matrix in which the FOI was arbitrarily divided into subareas where different corrections were applied (47, 48).
Besides aberration correction, our approach leverages the cor-relations of the output wave field to get rid of the multiple scattering background. The latter contribution is actually spatially incoherent. It thus mainly lies along the noise subspace of the D-matrix. Thanks to these features, we were able to image through almost 10 scattering mean free paths of biological tissues, which is beyond the imaging depth of conventional OCT systems for these specimens (see fig. S3). Compared to the previously developed smart-OCT method that was able to detect few bright scatterers at large penetration depth (12𝓁s) (27), the D-matrix approach yields a direct image of the sample reflectivity at a diffraction-limited resolution. In addition, our approach enables to quantitatively estimate the amount of multiply scattered light. Combined with a conventional image, this parameter is of importance for characterization purposes.
on September 10, 2020
http://advances.sciencemag.org/
The distortion operator thus opens a new route toward real-time deep optical imaging of biological tissues. In that respect, the exper-imental setup and procedure used in this paper are clearly perfectible. While postprocess operations take less than 1 min on a regular laptop, the main limitation in the current experimental configura-tion is the acquisiconfigura-tion time. In particular, the scanning illuminaconfigura-tion scheme was not optimized because of the SLM speed. While the use of a galvanometric mirror or a high-speed deformable mirror would drastically reduce the acquisition time at the cost of a more complex setup, we counteracted this issue with a sparse illumination. How-ever, this, in return, limited the available number of angular degrees of freedom at the input, which prevents us from an aberration cor-rection of the incident wave field. By optimizing the experimental apparatus and acquisition scheme, large reflection matrices can be measured in a few seconds. For instance, Yoon et al. (48) recently demonstrated the acquisition of a 10,000-mode matrix in 15 s with the same degree of control for the incident and reflected waves. In that case, a simultaneous correction of aberrations at the input and output is absolutely possible under the distortion matrix approach by alternatively projecting the incident and reflected wave fields in the focal and pupil planes. In view of 3D imaging, our approach can also be coupled to computational AO techniques (12) to tackle depth-dependent aberrations and restore a diffraction-limited reso-lution in all directions. An alternative is to switch from a scanning to a full-field illumination scheme. A measurement of the coherent reflection matrix R can be performed under a spatially incoherent illumination (49, 50). This full-field configuration would allow to record the reflection matrix over millimetric volumes in a moderate acquisition time.
Last, we used a negative resolution target as the sample to be imaged in this work. The reason is that this highly contrasted object was the ideal specimen to clearly highlight the issue of multiple iso-planatic areas. Beyond the proof-of-concept experiments presented in this article, a direct imaging of biological specimens over large penetration depth will be the next step. The assumption on which our method is based (Eq. 10) can easily be met in biological tissues since a strong aberration regime takes place beyond a few scattering mean free paths. Note also that, even when this condition is not fulfilled and far-field correlations dominate, the distortion matrix approach can still work but the FOI has to be beforehand subdivided into individual IPs (47, 51). The ability of identifying multiple IPs
will also be particularly promising to map the specimen-induced aberration and the SMR. Aside from aberrometry and/or turbidimetry, future in vivo implementations of our approach have implications beyond that of ocular media characterization, most notably for imaging through nontransparent ocular media (e.g., retinal imaging through a turbid cornea or through cataract opacities) (52).
In summary, we have introduced, in this work, a new operator, the so-called distortion matrix D, which reveals the hidden cor-relations of the reflected wave field. This matrix results from the mismatch between the phase of the recorded reflection matrix and those of a reference matrix that would be obtained in an ideal con-figuration. As shown in this paper, D gives access to the nonin-vasive transmission matrix between each sensor and each voxel of the FOI. Then, by solving the corresponding inverse problem, an image of a scattering sample can be obtained as if the medium ahead was made transparent. The D-matrix concept is very gener-al. It can be extended to any kind of waves and experimental con-figurations for which a measurement of the amplitude and phase of the reflected wave field is possible under multiple illuminations (53–56). A recent work actually demonstrates the benefits of this concept for ultrasound imaging in a random scattering regime (51). This D-matrix concept thus opens a new route toward a glob-al and noninvasive matrix approach of deep imaging in biologicglob-al tissues.
MATERIALS AND METHODS
Experimental setup
The experimental configuration is identical to the one described in (27) except for the MO that had been replaced by a water immersion one. The following components were used in the experimental setup (see fig. S1): a femtosecond laser (Femtosecond Fusion 20-400: central wavelength, 810 nm; bandwidth, 40 nm), an SLM (PLUTO- NIR-2, HOLOEYE), an objective lens (40×; NA, 0.8; Nikon), and a CCD camera (Dalsa Pantera 1M60) with a dynamic range of 60 dB. The incident light power in the back pupil plane of the MO was 10 mW in the experiment. Thus, the radiant flux was 106 W/cm2 at the focal spot in free space. For each input wavefront, the complex- reflected wave field was extracted from four intensity measurements using phase-shifting interferometry. The acquisition time of the reflection matrix was approximately 2 min.
0 50 100 0 1 2 3 4 10 0 1 1 0 –1 U1 U6 Confocal Matrix Edematous cornea
3
U11 A B C D E F NA = 0.1 10 µm 510−3Fig. 5. Imaging through corneal tissue with deteriorated transparency. (A) Schematic of the experiment. A resolution target (USAF 1951) is positioned below an edematous nonhuman primate cornea (see inset). (B) Plot of the normalized singular values ˜ σ p of D. The red circles correspond to the 11 first singular values (signal
subspace), while the noisy singular values are displayed in blue. (C) Original confocal image deduced from the focused reflection matrix R0 (Eq. 18). (D) Final matrix image constructed from the 11 first eigenstates of D (Eq. 20). (E) Real parts of U1, U6, and U11. (F) Corresponding confocal images deduced from the focused reflection matrices Rp (Eq. 18).
on September 10, 2020
http://advances.sciencemag.org/
Image acquisition and data analysis
Both data acquisition and analysis were performed using MATLAB custom-written codes. These codes are available from the authors upon request.
SUPPLEMENTARY MATERIALS
Supplementary material for this article is available at http://advances.sciencemag.org/cgi/ content/full/6/30/eaay7170/DC1
REFERENCES AND NOTES
1. H. W. Babcock, The possibility of compensating astronomical seeing. Publ. Astron. Soc. Pac. 65, 229–236 (1953).
2. R. Foy, A. Labeyrie, Feasibility of adaptive telescope with laser probe. Astron. Astrophys. 152, L29–L31 (1985).
3. S. T. Thurman, J. R. Fienup, Correction of anisoplanatic phase errors in digital holography.
J. Opt. Soc. Am. A 25, 995–999 (2008).
4. A. E. Tippie, J. R. Fienup, Multiple-plane anisoplanatic phase correction in a laboratory digital holography experiment. Opt. Lett. 35, 3291–3293 (2010).
5. M. J. Booth, M. A. Neil, R. Juškaitis, T. Wilson, Adaptive aberration correction in a confocal microscope. Proc. Natl. Acad. Sci. U.S.A. 99, 5788–5792 (2002).
6. X. Tao, B. Fernandez, O. Azucena, M. Fu, D. Garcia, Y. Zuo, D. C. Chen, J. Kubby, Adaptive optics confocal microscopy using direct wavefront sensing. Opt. Lett. 36, 1062–1064 (2011).
7. D. Débarre, E. J. Botcherby, T. Watanabe, S. Srinivas, M. J. Booth, T. Wilson, Image-based adaptive optics for two-photon microscopy. Opt. Lett. 34, 2495–2497 (2009). 8. N. Ji, D. E. Milkie, E. Betzig, Adaptive optics via pupil segmentation for high-resolution
imaging in biological tissues. Nat. Methods 7, 141–147 (2010).
9. I. N. Papadopoulos, J.-S. Jouhanneau, J. F. Poulet, B. Judkewitz, Scattering compensation by focus scanning holographic aberration probing (f-sharp). Nat. Photonics 11, 116–123 (2017).
10. M. Rueckel, J. A. Mack-Bucher, W. Denk, Adaptive wavefront correction in two-photon microscopy using coherence-gated wavefront sensing. Proc. Natl. Acad. Sci. U.S.A. 103, 17137–17142 (2006).
11. B. Hermann, E. Fernández, A. Unterhuber, H. Sattmann, A. Fercher, W. Drexler, P. Prieto, P. Artal, Adaptive-optics ultrahigh-resolution optical coherence tomography. Opt. Lett. 29, 2142–2144 (2004).
12. S. G. Adie, B. W. Graf, A. Ahmad, P. S. Carney, S. A. Boppart, Computational adaptive optics for broadband optical interferometric tomography of biological tissue. Proc. Natl.
Acad. Sci. U.S.A. 109, 7175–7180 (2012).
13. B. Judkewitz, R. Horstmeyer, I. M. Vellekoop, I. N. Papadopoulos, C. Yang, Translation correlations in anisotropically scattering media. Nat. Phys. 11, 684–689 (2015). 14. F. J. Rigaut, B. L. Ellerbroek, R. Flicker, in Adaptive Optical Systems Technology,
P. L. Wizinowich, Ed. (SPIE, 2000), pp. 432–441.
15. Z. Kam, P. Kner, D. Agard, J. W. Sedat, Modelling the application of adaptive optics to wide-field microscope live imaging. J. Microsc. 226, 33–42 (2007).
16. R. D. Simmonds, M. J. Booth, Modelling of multi-conjugate adaptive optics for spatially variant aberrations in microscopy. J. Opt. 15, 094010 (2013).
17. M. Minski, Microscopy apparatus. US patent 3013467 (1961).
18. M. R. Hee, E. A. Swanson, J. G. Fujimoto, J. A. Izatt, Femtosecond transillumination tomography in thick tissues. Opt. Lett. 18, 1107–1109 (1993).
19. I. M. Vellekoop, A. P. Mosk, Focusing coherent light through opaque strongly scattering media. Opt. Lett. 32, 2309–2311 (2007).
20. S. M. Popoff, G. Lerosey, R. Carminati, M. Fink, A. C. Boccara, S. Gigan, Measuring the Transmission Matrix in Optics: An Approach to the Study and Control of Light Propagation in Disordered Media. Phys. Rev. Lett. 104, 100601 (2010).
21. S. M. Popoff, G. Lerosey, M. Fink, A. C. Boccara, S. Gigan, Image transmission through an opaque material. Nat. Commun. 1, 81 (2010).
22. M. Kim, Y. Choi, C. Yoon, W. Choi, J. Kim, Q.-H. Park, W. Choi, Maximal energy transport through disordered media with the implementation of transmission eigenchannels.
Nat. Photonics 6, 583–587 (2012).
23. T. Cizmar, K. Dholakia, Exploiting multimode waveguides for pure fibre- based imaging.
Nat. Commun. 3, 1027 (2012).
24. I. N. Papadopoulos, S. Farahi, C. Moser, D. Psaltis, Focusing and scanning light through a multimode optical fiber using digital phase conjugation. Opt. Express 20, 10583–10590 (2012).
25. S. A. Alexandrov, T. R. Hillman, T. Gutzler, D. D. Sampson, Synthetic aperture fourier holographic optical microscopy. Phys. Rev. Lett. 97, 168102 (2006).
26. S. M. Popoff, A. Aubry, G. Lerosey, M. Fink, A. C. Boccara, S. Gigan, Exploiting the time-reversal operator for adaptive optics, selective focusing, and scattering pattern analysis.
Phys. Rev. Lett. 107, 263901 (2011).
27. A. Badon, D. Li, G. Lerosey, A. C. Boccara, M. Fink, A. Aubry, Smart optical coherence tomography for ultra-deep imaging through highly scattering media. Sci. Adv. 2, e1600370 (2016).
28. Y. Choi, T. R. Hillman, W. Choi, N. Lue, R. R. Dasari, P. T. C. So, W. Choi, Z. Yaqoob, Measurement of the time-resolved reflection matrix for enhancing light energy delivery into a scattering medium. Phys. Rev. Lett. 111, 243901 (2013).
29. S. Jeong, Y.-R. Lee, W. Choi, S. Kang, J. H. Hong, J.-S. Park, Y.-S. Lim, H.-G. Park, W. Choi, Focusing of light energy inside a scattering medium by controlling the time-gated multiple light scattering. Nat. Photonics 12, 277–283 (2018).
30. S. Kang, S. Jeong, W. Choi, H. Ko, T. D. Yang, J. H. Joo, J.-S. Lee, Y.-S. Lim, Q.-H. Park, W. Choi, Imaging deep within a scattering medium using collective accumulation of single-scattered waves. Nat. Photonics 9, 253–258 (2015).
31. S. Kang, P. Kang, S. Jeong, Y. Kwon, T. D. Yang, J. H. Hong, M. Kim, K.-D. Song, J. H. Park, J. H. Lee, M. J. Kim, K. H. Kim, W. Choi, High-resolution adaptive optical imaging within thick scattering media using closed-loop accumulation of single scattering. Nat. Commun. 8, 2157 (2017).
32. J.-L. Robert, M. Fink, Green’s function estimation in speckle using the decomposition of the time reversal operator: Application to aberration correction in medical imaging.
J. Acoust. Soc. Am. 123, 866–877 (2008).
33. J.-L. Robert, M. Fink, The time-reversal operator with virtual transducers: Application to far-field aberration correction. J. Acoust. Soc. Am. 124, 3659–3668 (2008). 34. G. Osnabrugge, R. Horstmeyer, I. N. Papadopoulos, B. Judkewitz, I. M. Vellekoop,
Generalized optical memory effect. Optica 4, 886–892 (2017).
35. S. L. Jacques, Optical properties of biological tissues: A review. Phys. Med. Biol. 58, R37–R61 (2013).
36. M. Born, E. Wolf, Principles of Optics: Electromagnetic Theory of Propagation, Interference
and Diffraction of Light (CUP Archive, 1999).
37. J. Mertz, H. Paudel, T. G. Bifano, Field of view advantage of conjugate adaptive optics in microscopy applications. Appl. Opt. 54, 3498–3506 (2015).
38. A. Badon, A. C. Boccara, G. Lerosey, M. Fink, A. Aubry, Multiple scattering limit in optical microscopy. Opt. Express 25, 28914–28934 (2017).
39. V. N. Mahajan, Strehl ratio for primary aberrations: some analytical results for circular and annular pupils. J. Opt. Soc. Am. 72, 1258–1266 (1982).
40. L. L. Campbell, Minimum coefficient rate for stationary random processes. Inf. Control. 3, 360–371 (1960).
41. S. J. Roberts, W. Penny, L. Rezek, Temporal and spatial complexity measures
for electroencephalogram based brain-computer interfacing. Med. Biol. Eng. Comput. 37, 93–98 (1999).
42. R. G. Ghanem, R. D. Spanos, Stochastic Finite Elements: A Spectral Approach (Springer-Verlag, 1991).
43. J.-L. Robert, M. Fink, The prolate spheroidal wave functions as invariants of the time reversal operator for an extended scatterer in the fraunhofer approximation.
J. Acoust. Soc. Am. 125, 218–226 (2009).
44. A. Aubry, J. de Rosny, J.-G. Minonzio, C. Prada, M. Fink, Gaussian beams and legendre polynomials as invariants of the time reversal operator for a large rigid cylinder.
J. Acoust. Soc. Am. 120, 2746–2754 (2006).
45. R. Bocheux, P. Pernot, V. Borderie, K. Plamann, K. Irsch, Quantitative measures of corneal transparency, derived from objective analysis of depth-resolved corneal images, demonstrated with full-field optical coherence tomographic microscopy. PLOS ONE 14, e0221707 (2019).
46. M. Bastiaans, Wigner distribution function and its application to first-order optics.
J. Opt. Soc. Am. 69, 1710–1716 (1979).
47. M. Kim, Y. Jo, J. H. Hong, S. Kim, S. Yoon, K.-D. Song, S. Kang, B. Lee, G. H. Kim, H.-C. Park, W. Choi, Label-free neuroimaging in vivo using synchronous angular scanning microscopy with single-scattering accumulation algorithm. Nat. Commun. 10, 3152 (2019).
48. S. Yoon, H. Lee, J. H. Hong, Y.-S. Lim, W. Choi, Laser scanning reflection-matrix microscopy for label-free in vivo imaging of a mouse brain through an intact skull. arXiv:1910.04681 (2019).
49. A. Badon, G. Lerosey, A. C. Boccara, M. Fink, A. Aubry, Retrieving time-dependent green’s functions in optics with low-coherence interferometry. Phys. Rev. Lett. 114, 023901 (2015). 50. A. Badon, D. Li, G. Lerosey, A. C. Boccara, M. Fink, A. Aubry, Spatio-temporal imaging
of light transport in highly scattering media under white light illumination. Optica 3, 1160–1166 (2016).
51. W. Lambert, L. A. Cobus, T. Frappart, M. Fink, A. Aubry, Distortion matrix approach for ultrasound imaging of random scattering media. Proc. Natl. Acad. Sci. U.S.A., (2020). 52. A. Badon, V. Barolle, A. C. Boccara, M. Fink, K. Irsch, A. Aubry, Towards characterization
and compensation of loss of anterior segment transparency. IEEE Transactions on
Engineering in Medicine and Biology Conference (EMBC) (IEEE, 2019).
53. V. Lauer, New approach to optical diffraction tomography yielding a vector equation of diffraction tomography and a novel tomographic microscope. J. Microsc. 205, 165–176 (2002).
on September 10, 2020
http://advances.sciencemag.org/
54. S. Shahjahan, A. Aubry, F. Rupin, B. Chassignole, A. Derode, A random matrix approach to detect defects in a strongly scattering polycrystal: How the memory effect can help overcome multiple scattering. Appl. Phys. Lett. 104, 234105 (2014).
55. T. Blondel, J. Chaput, A. Derode, M. Campillo, A. Aubry, Matrix approach of seismic imaging: Application to the erebus volcano, Antarctica. J. Geophys. Res. Solid Earth 123, 10936–10950 (2018).
56. T. Zhang, K. Unger, G. Maire, P. C. Chaumet, A. Talneau, C. Godhavarti, H. Giovannini, K. Belkebir, A. Sentenac, Multi-wavelength multi-angle reflection tomography.
Opt. Express 26, 26093–26105 (2018).
57. J.-L. Robert, Evaluation of green’s functions in complex media by decomposition of the time reversal operator: Application to medical imaging and aberration correction, thesis, Universite Paris 7–Denis Diderot (2007).
58. M. Priestley, Spectral Analysis and Time Series (Academic Press, 1988). 59. J. W. Goodman, Statistical Optics (Wiley, 2000).
60. C. Prada, J.-L. Thomas, Experimental subwavelength localization of scatterers by decomposition of the time reversal operator interpreted as a covariance matrix.
J. Acoust. Soc. Am. 114, 235–243 (2003).
61. C. Prada, M. Fink, Eigenmodes of the time reversal operator: A solution to selective focusing in multiple-target media. Wave Motion 20, 151–163 (1994).
Acknowledgments: We wish to thank L. Cobus, W. Lambert, P. Balondrade, and S. Meimon for fruitful discussions. Funding: The authors are grateful for the funding provided by Labex WIFI (Laboratory of Excellence within the French Program Investments for the Future; ANR-10-LABX-24 and ANR-10-IDEX-0001-02 PSL*). A.B. acknowledges financial support from
the French “Direction Générale de l’Armement” (DGA). This project has received funding from the European Research Council (ERC) under the European Union’s Horizon 2020 research and innovation program (grant agreement nos. 610110 and 819261, HELMHOLTZ* and REMINISCENCE projects, respectively). K.I. acknowledges financial support from the European Union’s Horizon 2020 research and innovation program under the Marie Skłodowska-Curie grant agreement no. 709104. Author contributions: A.A. initiated and supervised the project. A.B. built the experimental setup and performed the experiments. K.I., A.C.B., and M.F. initiated the ophthalmic application. K.I. provided corneal samples and guidance on the ophthalmic experiment. A.B., V.B., and A.A. analyzed the experiments. V.B. and A.A. performed the theoretical study. A.B. and A.A. prepared the manuscript. A.B., V.B., K.I., A.C.B., M.F., and A.A. discussed the results and contributed to finalizing the manuscript. Competing interests: A.A., M.F., A.C.B., A.B., and V.B. are inventors on a patent related to this work held by CNRS (no. WO2020016249, published January 2020). All authors declare that they have no other competing interests. Data and materials availability: All data needed to evaluate the conclusions in the paper are present in the paper and/or the Supplementary Materials. Additional data related to this paper may be requested from the authors. Submitted 25 July 2019
Accepted 5 June 2020 Published 22 July 2020 10.1126/sciadv.aay7170
Citation: A. Badon, V. Barolle, K. Irsch, A. C. Boccara, M. Fink, A. Aubry, Distortion matrix concept for deep optical imaging in scattering media. Sci. Adv. 6, eaay7170 (2020).
on September 10, 2020
http://advances.sciencemag.org/
DOI: 10.1126/sciadv.aay7170 (30), eaay7170.
6 Sci Adv
ARTICLE TOOLS http://advances.sciencemag.org/content/6/30/eaay7170 MATERIALS
SUPPLEMENTARY http://advances.sciencemag.org/content/suppl/2020/07/20/6.30.eaay7170.DC1 REFERENCES
http://advances.sciencemag.org/content/6/30/eaay7170#BIBL This article cites 51 articles, 4 of which you can access for free
PERMISSIONS http://www.sciencemag.org/help/reprints-and-permissions
Terms of Service Use of this article is subject to the
is a registered trademark of AAAS.
Science Advances
York Avenue NW, Washington, DC 20005. The title
(ISSN 2375-2548) is published by the American Association for the Advancement of Science, 1200 New
Science Advances
License 4.0 (CC BY-NC).
Science. No claim to original U.S. Government Works. Distributed under a Creative Commons Attribution NonCommercial Copyright © 2020 The Authors, some rights reserved; exclusive licensee American Association for the Advancement of
on September 10, 2020
http://advances.sciencemag.org/