HAL Id: hal-00295889
https://hal.archives-ouvertes.fr/hal-00295889
Submitted on 2 May 2006
HAL is a multi-disciplinary open access
archive for the deposit and dissemination of
sci-entific research documents, whether they are
pub-lished or not. The documents may come from
teaching and research institutions in France or
abroad, or from public or private research centers.
L’archive ouverte pluridisciplinaire HAL, est
destinée au dépôt et à la diffusion de documents
scientifiques de niveau recherche, publiés ou non,
émanant des établissements d’enseignement et de
recherche français ou étrangers, des laboratoires
publics ou privés.
The heterogeneous chemical kinetics of N2O5 on CaCO3
and other atmospheric mineral dust surrogates
F. Karagulian, C. Santschi, M. J. Rossi
To cite this version:
F. Karagulian, C. Santschi, M. J. Rossi. The heterogeneous chemical kinetics of N2O5 on CaCO3
and other atmospheric mineral dust surrogates. Atmospheric Chemistry and Physics, European
Geo-sciences Union, 2006, 6 (5), pp.1373-1388. �hal-00295889�
Atmos. Chem. Phys., 6, 1373–1388, 2006 www.atmos-chem-phys.net/6/1373/2006/ © Author(s) 2006. This work is licensed under a Creative Commons License.
Atmospheric
Chemistry
and Physics
The heterogeneous chemical kinetics of N
2
O
5
on CaCO
3
and other
atmospheric mineral dust surrogates
F. Karagulian, C. Santschi, and M. J. RossiEcole Polytechnique F´ed´erale de Lausanne(EPFL), Laboratoire de Pollution Atmosph´erique et Sol (LPAS), Bˆatiment CH H5, Station 6, CH-1015 Lausanne, Switzerland
Received: 7 September 2005 – Published in Atmos. Chem. Phys. Discuss.: 24 October 2005 Revised: 6 February 2006 – Accepted: 28 February 2006 – Published: 2 May 2006
Abstract. Uptake experiments of N2O5 on several
mineral dust powder samples were carried out under continuous molecular flow conditions at 298±2 K. At [N2O5]0=(4.0±1.0)×1011cm−3 we have found γss values
ranging from (3.5±1.1)×10−2 for CaCO3 to (0.20±0.05)
for Saharan Dust with γssdecreasing as [N2O5]0increased.
The uptake coefficients reported in this work are to be re-garded as upper limiting values owing to the fact that they are based on the geometric (projected) surface area of the mineral dust sample. We have observed delayed production of HNO3 upon uptake of N2O5for every investigated
sam-ple owing to hydrolysis of N2O5with surface-adsorbed H2O.
Arizona Test Dust and Kaolinite turned out to be the samples that generated the largest amount of gas phase HNO3 with
respect to N2O5taken up. In contrast, the yield of HNO3
for Saharan Dust and CaCO3is lower. On CaCO3the
disap-pearance of N2O5was also accompanied by the formation of
CO2. For CaCO3sample masses ranging from 0.33 to 2.0 g,
the yield of CO2was approximately 42–50% with respect to
the total number of N2O5molecules taken up. The reaction
of N2O5with mineral dust and the subsequent production of
gas phase HNO3lead to a decrease in [NOx] which may have
a significant effect on global ozone.
1 Introduction
Dinitrogen pentoxide, N2O5, is part of the family of active
nitrogen, NOy, owing to its equilibrium with NO2and NO3
according to Reaction (R1):
N2O5 NO2+NO3 (R1)
Under atmospheric pressure and 298 K the thermal lifetime of N2O5 is approximately 20 s and is a strong function of
Correspondence to: M. J. Rossi (michel.rossi@epfl.ch)
temperature (Atkinson et al., 1997; W¨angberg et al., 1997). The observation of the buildup of the concentration of ni-tric acid, HNO3, in the polluted urban planetary boundary
layer (PBL) during the night could only be explained by the heterogeneous conversion of N2O5 to HNO3 according to
Reaction (R2) (Hjorth et al., 1987; Tuazon et al., 1983). N2O5+H2O(ads)→2HNO3 (R2)
The substrate for the heterogeneous Reaction (R2) has not been unambiguously identified but is thought to be urban H2O-containing aerosols or humid surfaces on the ground
whose purpose is to make available adsorbed H2O in order
to enable Reaction (R2).
Together with HNO3 and NO3, N2O5 contributes to the
formation of particulate nitrate on the dust particles by surface processes in the troposphere (Zhang et al., 1994). These heterogeneous processes represent an important sink for nitrogen oxide species, with decreases of daytime NOy
levels reaching up to 60% in the presence of dust at a loading of about 1.8–11.5 µg m−3 corresponding to a particle sur-face area of (0.11–0.7)×10−6cm2cm−3. During the night-time, the conversion of NO3 and N2O5 to particles
domi-nates the overall nitrate formation accounting for 80% of total particulate nitrate formation while the heterogeneous hydrolysis pathway leading to HNO3accounts for only about
20% (Zhang et al., 1994).
In addition, the present study shows that gas phase HNO3
is a potential reaction product formed by heterogeneous hy-drolysis of N2O5 with adsorbed water present on mineral
dust. Previous laboratory studies performed using a Knudsen cell flow reactor have extensively supported the reactivity of HNO3on CaCO3, marble, mineral dust surrogates and metal
oxides (Fenter et al., 1995; Frinak et al., 2004; Hanisch and Crowley, 2001a; Underwood et al., 2001).
Mineral aerosols provide reactive surfaces in the atmo-sphere where heterogeneous chemical reactions may take place. Dentener showed that the interaction of N2O5, O3and
1374 F. Karagulian et al.: Products and kinetics of N2O5interaction on mineral dust
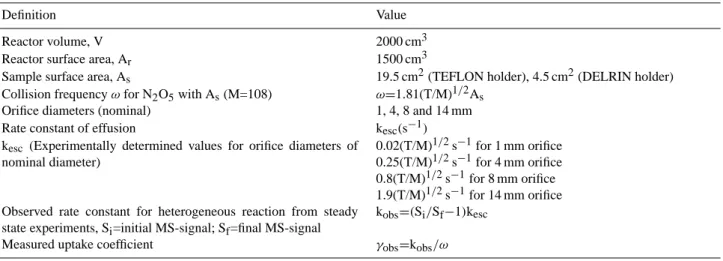
Table 1. Characteristic parameters and relevant kinetic expressions.
Definition Value
Reactor volume, V 2000 cm3
Reactor surface area, Ar 1500 cm3
Sample surface area, As 19.5 cm2(TEFLON holder), 4.5 cm2(DELRIN holder)
Collision frequency ω for N2O5with As(M=108) ω=1.81(T/M)1/2As
Orifice diameters (nominal) 1, 4, 8 and 14 mm
Rate constant of effusion kesc(s−1)
kesc (Experimentally determined values for orifice diameters of
nominal diameter)
0.02(T/M)1/2s−1for 1 mm orifice 0.25(T/M)1/2s−1for 4 mm orifice 0.8(T/M)1/2s−1for 8 mm orifice 1.9(T/M)1/2s−1for 14 mm orifice Observed rate constant for heterogeneous reaction from steady
state experiments, Si=initial MS-signal; Sf=final MS-signal
kobs=(Si/Sf−1)kesc
Measured uptake coefficient γobs=kobs/ω
HO2radicals with dust will affect the photochemical oxidant
cycle, with ozone concentrations decreasing by up to 10% in and nearby the dust source areas (Dentener et al., 1996).
Field observations (de Reus et al., 2005) and laboratory ex-periments (Hanisch and Crowley, 2001a, b, 2003c, d; Usher et al., 2003) have established the interaction of trace gases with mineral dust aerosol as well as the quantitative impact of the latter on the composition of the atmosphere. Box, re-gional and global scale models have shown the importance of dust on both the photochemical rates of oxidant forma-tion as well as the loss of trace gases regarding atmospheric composition (Bauer et al., 2004; Bian and Zender, 2003; Dentener et al., 1996; Tabazadeh et al., 1998; Zhang et al., 1994). In these models the chemical alteration of the tropo-sphere by dust including photolysis rate forcing and uptake was investigated. These models simulate the uptake of re-active trace gases on mineral dust surfaces in a global circu-lation model that includes schemes to simulate atmospheric chemistry processes in the presence of dust aerosol, some-times using estimated rate coefficients for trace gas uptake. The comparison of the global scale model of Bian and Zender with Bauer et al. reveals significant quantitative dif-ferences of the effect of mineral dust on O3and several
im-portant trace gases such as HNO3, N2O5 and H2O2.
How-ever, both studies agree that the direct interaction of O3with
mineral dust is of minor importance, whereas the uptake of one of its precursor, HNO3, is responsible for most of the
ozone decrease in the areas affected by dust. In the modelling studies of both Bian and Zender and Bauer et al. an uptake coefficient γN2O5=10
−3at a relatively humidity (rh) of 30%
has been used. In the modelling simulation performed by Bauer et al. the uptake of N2O5 resulted in a reduction of
11% of its concentration in the gas phase whereas the sim-ulations of Bian and Zender indicate a global reduction of 2%.
Despite the published results of field observations and modeling studies (Bauer et al., 2004; Bian and Zender, 2003; Bonasoni et al., 2004; de Reus et al., 2000), only a single laboratory study has been performed on N2O5 interacting
with Saharan Dust combining a Knudsen flow reactor with a DRIFTS cell (Seisel et al., 2005). We have therefore em-barked on a laboratory program to measure some of the het-erogeneous reactions involving N2O5and NO3(Karagulian
and Rossi, 2005) as relevant trace atmospheric gases. In the present work, we have used a Knudsen flow reactor in order to investigate the uptake and reaction of N2O5 on selected
authentic mineral dust samples such as Kaolinite, Saharan Dust from Cape Verde Islands, Arizona test dust and natural limestone as well as on samples of pure CaCO3.
2 Experimental set up and detection
All experiments were performed in a TEFLON® coated Knudsen flow reactor operating in the molecular flow regime. This technique has been described in detail in the literature (Caloz et al., 1997). Briefly, N2O5was introduced into the
Knudsen flow reactor from the gas handling system using a fine needle valve as a flow control device. An isolation plunger allows the separation of the reactive surface of in-terest from the reactor volume. The gases leave the Knud-sen reactor through an escape orifice whose diameters (1, 4, 8, 14 mm) determine the residence time (τg=1/kesc) and
molecular concentration at a given flow rate FM0=IM·C(M),
where IM is the mass spectrometric signal amplitude (MS)
and C(M)is a calibration factor for the species M of interest
that depends on instrumental parameters. The concentration [M]MS=N/Vcell= F
M 0
kesc·Vcellis related to the flow of molecules leaving the reactor FM0 . Mass spectrometry (MS) provides a direct measure of the flow rate FM0 which is proportional to
F. Karagulian et al.: Products and kinetics of N2O5interaction on mineral dust 1375
Table 2. Composition of mineral dust samples used in this work.
Kaolinite1 CaCO32 Natural limestone3 Saharan Dust4 Arizona Test Dust5 Al2Si2O5(OH)4 SiO244.2% TiO22.17% Al2O337.2% Fe2O31.14% FeO 0.05% MgO 0.04% CaO 0.04% Na2O 0.02% K2O 0.02% P2O50.06% F 0.02% CaCO399.9% CaCO397% SiO21.9% Al2O30.5% Fe2O30.3% MgO 0.2% Other elements 0.1% SiO247% FeO 14.7% Al2O317.6% MgO 5.1% Na2O 2.1% K2O 2.5% CaO 5.0% TiO24.5% P2O50.6% SO30.3% MnO 0.3% SiO268–76% Al2O310–15% Fe2O32–5% Na2O 2–4% CaO 2–5% MgO 1–2% TiO20.5–1.0% K2O 2–5% ρt=2.1–2.6 g/cm3 ρb=0.528 g/cm3 ρt=2.93 g/cm3 ρb=0.96 g/cm3 ρt=2.7 g/cm3 ρb=1.13 g/cm3 ρt=2.7 g/cm3 ρb=1.2 g/cm3 ρt=2.65 g/cm3 ρb=0.6 g/cm3 d=1.0 µm d=3.5 µm – d=0.9 µm –
SBET=22.57 m2/g SBET=5.06 m2/g – SBET=39.6 m2/g –
1C. V. Clemency, Dept. of Geological Sciences, SUNY at Buffalo, Buffalo N. Y. (USA), for the Clay Minerals Society. 2Fluka AG, CH-9471 Buchs (Switzerland).
3Transmat SA, Route de Ferreyres, CH-1315 La Sarraz (Switzerland). 4Hanisch F. and Crowley, J. N. Atmos. Chem. Phys., 3, 119, 2003.
5Powder Technology Inc., 1433 Ewing Avenue S. Burnsville, MN 55 306, USA.
the concentration of a species escaping the Knudsen flow re-actor. The rate constant for the effusive loss kescof N2O5is
given by the kinetic theory of gases and was measured for ev-ery used orifice. The characteristic parameters and relevant kinetic expressions used in this work are reported in Table 1. The samples we have used in this study are the following: Kaolinite, poorly ordered (KGa-2, Warren County, Georgia, USA), CaCO3 (Fluka), Arizona Medium Test Dust
(Pow-der Technology Incorporated, Burnsville MN, USA), natu-ral limestone (Transmat, La Sarraz, Switzerland) and Saha-ran Dust from deposits on Cape Verde Islands (SDCV). The main physical and chemical data on the mineral dust samples used in this work are reported in Table 2.
Two kinds of sample holders were used: one consisted of a TEFLON coated Pyrex holder of available sample surface of 19.6 cm2, the other consisted of an internal reduction piece made out of DELRIN leading to a sample surface of 4.9 cm2. Both TEFLON and DELRIN did not show any reactivity to-wards N2O5under the present experimental conditions.
N2O5was synthesized by the oxidation of NO2with
ex-cess ozone. MS analysis did not reveal the presence of ozone at m/e 48. The O3/O2mixture at the outlet of the ozonator
(Fisher 502) is passed through a P2O5trap in order to
elimi-nate residual moisture before being mixed with equally dried NO2. The N2O5 is collected in a methanol/dry-ice bath at
195 K and is subsequently analyzed for purity by MS. Hy-drolysis of N2O5may occur on surfaces of the traps and of
the vacuum line before admission into the Knudsen flow
re-actor generating HNO3 as an impurity ranging from 10 to
15% as detected by MS at m/e 63, its molecular ion peak. N2O5 does not have a measurable parent and fragment
peak at m/e 108 and 62, respectively, under the present ex-perimental conditions; the most intense peaks are its frag-ment NO+2 at m/e 46 followed by the less intense frag-ment NO+ at m/e 30. However, the HNO3 impurity also
contributes to the MS signal at m/e 46 and 30. Un-der the used experimental conditions, HNO3 has been
de-tected at its parent peak at m/e 63. Through a calibrated mass spectrum of pure HNO3 we have accurately
deter-mined the effective contribution of HNO3 at m/e 46 and
30 by using the fragmentation pattern expressed as the ratios f46= I046(HNO)3 I063(HNO)3 =52±8 and f30= I030(HNO)3 I063(HNO)3 =33±4. In the absence of a substrate, f46·I063(HNO3)and f30·I063(HNO3)
have been subtracted from the total MS signals I046 and I030 at m/e 46 and 30, respectively, in order to assign the remaining MS amplitude to the NO+2 and NO+ fragments of N
2O5: I46(N0 2O5)=I460 −f46·I63(HNO0 3) and
I30(N2O5)
0 =I300 −f30·I 63(HNO3)
0 . The ratio between the two most
intense peaks of N2O5 therefore was r= I46(N2O5)0
I30(N2O5)0 =1.4±0.2.
Mixtures of N2O5 and HNO3 may thus be monitored
us-ing MS signal intensities at m/e 46, 30 and 63. However, in order to quantify N2O5 we chose its most intense peak
1376 F. Karagulian et al.: Products and kinetics of N2O5interaction on mineral dust 1.5 1.0 0.5 0.0 M S Signal (Volt ) 1200 1000 800 600 400 200 time (s) (a) (b) (c) (d) x 100 (e) /10 (a) (b) reaction on (a)corr (b)corr
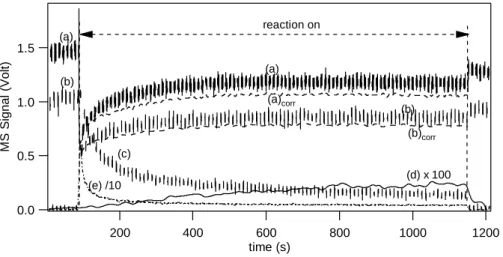
Figure 1: Typical N2O5 uptake experiment on a sample of 510 mg of CaCO3. Curves (a), (b),
(c), (d) and (e) correspond to the raw MS signals monitored at m/e 46, m/e 30, m/e 44, m/e 63
and m/e 18, respectively, using an orifice diameter of 14 mm, As = 19.6 cm2 and [N2O5]0 =
(4.0 ± 1.0) x 1011 cm-3. Curves (a)
corr and (b)corr correspond to the corrected signal at m/e 46
and m/e 30 for the presence of HNO3.
0.35 0.30 0.25 0.20 0.15 0.10 0.05 0.00 MS s ignal ( V ol t) 300 250 200 150 100 50 0 time (s) (a) (b) desorption on
Figure 2: Desorption of CO2 and NO after N2O5 uptake on a sample of 510 mg CaCO3
displayed in Figure 1. Curves (a) and (b) correspond to the raw MS signals monitored at m/e
44 and m/e 30, respectively, at an orifice diameter of 14 mm and As = 19.6 cm2.
30
Fig. 1. Typical N2O5uptake experiment on a sample of 510 mg of CaCO3. Curves (a), (b), (c), (d) and (e) correspond to the raw MS
signals monitored at m/e 46, m/e 30, m/e 44, m/e 63 and m/e 18, respectively, using an orifice diameter of 14 mm, As=19.6 cm2 and
[N2O5]0=(4.0±1.0)×1011cm−3. Curves (a)corrand (b)corrcorrespond to the corrected signal at m/e 46 and m/e 30 for the presence of
HNO3.
MS fragment m/e 46 was corrected for the contribution of HNO3 in order to calculate [N2O5]. The subscript 0 and r
refers to continuous gas uptake experiments in the absence and presence, respectively, of the solid sample.
3 Uptake coefficient of N2O5 and identify of reaction
products
When N2O5is exposed to the sample, it is taken up and
un-dergoes a heterogeneous reaction on the mineral dust surface which results in a decrease of the N2O5concentration that is
monitored using the MS signal I46(N2O5)
r . As shown in
pre-vious studies on mineral dust, HNO3that is always present
as an impurity, is taken up on the mineral dust surface with-out releasing any product that may contribute to the total MS signal I46r at m/e 46 (Hanisch and Crowley, 2001b). We have therefore determined the rate constant kobsfor the
disappear-ance of N2O5following Eq. (1), assuming that the rate law is
first order in N2O5: kobs= I46(N2O5) 0 I46(N2O5) r −1 · kesc (1) I46(N2O5) 0 and I 46(N2O5)
r are the intensities of the NO+2
frag-ment of N2O5before and during heterogeneous reaction,
re-spectively, and kescis the measured rate constant of effusion
for N2O5out of the flow reactor (see Table 1). In order to
de-termine I46(N2O5)
r , the raw MS signal at m/e 46 was corrected
for HNO3generated through hydrolysis of N2O5with water
adsorbed on the substrate surface. Production of HNO3has
in fact been observed at m/e 63 in every uptake experiment of N2O5. Figure 1 shows the raw MS signal at m/e 63 for
a typical uptake experiment of N2O5on CaCO3. Therefore,
we have corrected the MS signal of N2O5at m/e 46 for the
presence of HNO3according to Eq. (2) when the sample is
exposed to N2O5:
I46(N2O5)
r =I
46
r −f46·I63(HNOr 3) (2)
The ratio r, reported above, turned out to be the same before and during the exposure of the mineral dust sample to N2O5.
Therefore, I46(N2O5)
r exclusively corresponds to N2O5for this
experiment after correction of the MS signal at m/e 46 for the contribution of HNO3desorbing from the mineral dust
substrate.
In the Knudsen flow reactor, reactant gas molecules either exit through an aperture into the mass spectrometer or are lost on the reactive surface. The net observed uptake coefficient for N2O5, γobsis given by the following expression:
γobs=
kobs
ω (3)
Equation (3) is only valid if the rate law for uptake is first or-der in N2O5,where kobsis the pseudo-first order rate constant
at steady state conditions given in Eq. (1), ω is the collision frequency of the average molecule with the reactive surface area of the sample defined as ω=4Vc¯
cellAs, ¯c is the mean ve-locity of the gas-phase molecule, Vcell is the volume of the
reactor and As is the surface sample area. In our data
anal-ysis, γobswas calculated using the geometric surface area of
the sample holder as will be justified below. In the following, we evaluate γobsat the initial and steady state values of the
uptake rate leading to γ0and γss, respectively.
4 Uptake of N2O5on CaCO3: results and discussion
Typical raw data from an uptake experiment of N2O5 on
510 mg of CaCO3 are shown in Fig. 1 using the 14 mm
F. Karagulian et al.: Products and kinetics of N2O5interaction on mineral dust 1377
Table 3. Uptake experiments with N2O5on CaCO3as a function of sample mass at [N2O5]0=(4.0±1.0)×1011cm−3.
CaCO3
Mass in g
γ0 γss Yield of HNOc3 Yield of COc2
0.33a 0.16 ± 0.03 (2.0±0.6)×10−2 5.2 % 47.8 %
0.51a,b 0.2 ± 0.05 (2.2±0.5)×10−2 5.4 % 42.4 %
0.58a 0.18±0.05 (2.3±0.5)×10−2 – –
0.73a 0.22±0.04 (2.4±0.4)×10−2 5.4 % 50 %
2a 0.18±0.025 (1.6±1.6)×10−2 5.4 % 50 %
aUptake measurements performed with a surface sample area A
s=19.6 cm2. bUptake experiment displayed in Fig. 1.
cThe yield is given as a percentage with respect to the total number of molecules of N
2O5taken up during a reaction time of 550 s.
diameter-orifice. After a steady state flow of N2O5has been
established, the isolation plunger is lifted at t=92 s and the substrate is thus exposed to the N2O5 flow. MS signals
of 18 (H2O+), 30 (NO+), 44 (CO+2), 46 (NO+2), and 63
(HNO+3)were simultaneously monitored during the uptake. Because of the uptake of N2O5 on CaCO3, the number of
molecules exiting through the escape orifice into the MS im-mediately decreases which leads to a decrease of the MS signal I46(N2O5)
r at m/e 46. During the exposure of the
sam-ple to N2O5both HNO3and CO2monitored at m/e 63 and
44, respectively, have been observed in the gas phase. As the exposure time increases, the MS signal at m/e 46 par-tially recovers, indicating a decrease in the rate of uptake that ultimately leads to steady state towards the end of the displayed uptake experiment. However, on the time scale of an hour or longer the uptake begins to saturate at the present experimental conditions so that one should preferably talk about a pseudo steady-state that is attained at the end of the uptake experiment at t=1150 s displayed in Fig. 1. As a con-clusion we note the disparate time scales for the partial satu-ration of N2O5uptake taking place during the first 300 s and
complete saturation occurring on a much longer time scale. At t=1150 s the sample compartment is sealed by lowering the plunger and the MS signal at m/e 46 approximately re-turns to its initial steady-state value. The slight decrease of I46(N2O5)
0 over extended periods of time such as displayed in
Fig. 1 is explained by a slight decrease of the corresponding flow rate into the reactor owing to the difficulty of maintain-ing a stable pure N2O5flow for long exposure times.
An ancillary experiment was performed in order to esti-mate the amount of water adsorbed on the CaCO3substrate
surface after a given pumping time. In order to limit H2O
desorbing from the Pyrex sample holder it was replaced by a gold-coated all-metal sample holder. In this way most des-orbing H2O may be attributed to the mineral dust sample.
Typically, a fresh sample of 1g of CaCO3was pumped for
30 min at T=298 ± 2 K in the 14 mm-orifice reactor until the MS signal of H2O at m/e 18 dropped to the background level.
Subsequently, the CaCO3sample was heated up to 470 K and
the MS signal at m/e 18 recorded until it reached background as well indicating that no additional water desorbed at that temperature. The MS signal at m/e 18 was integrated in order to calculate the number of adsorbed water molecules H2Oads
using the measured BET surface area of 3.7 m2g−1for a high
ordered commercially available CaCO3sample from Aldrich
Corporation. A value of approximately 3.0×10¹³ molecule cm−2has been found for the surface density of strongly ad-sorbed H2Oads(Santschi, 2003).
When the CaCO3substrate is exposed to N2O5at 92 s, we
observed rapid formation of CO2(g)and H2O(g)as displayed
in Fig. 1 which were either generated in a chemical reaction or desorbing from a precursor state. In order to better under-stand the uptake of N2O5 on solid CaCO3powder, we will
briefly digress to the description of the chemical nature of a carbonate surface. From experimental and theoretical sur-face science studies, (De Leeuw and Parker, 1998; Kuriyavar et al., 2000; Stipp et al., 1994) there is clear evidence that under ambient conditions of pressure, temperature, and rel-ative humidity, the surface of CaCO3 is terminated by OH
groups that persist even under ultrahigh vacuum conditions. The OH-terminated surface may be a result of the dissocia-tive adsorption of water according to Reaction (R3): CaCO3+H2O → Ca(OH)(HCO3) (R3)
In a recent study (Al-Hosney and Grassian, 2004), the sur-face chemistry of CaCO3with trace atmospheric gases such
as HNO3, SO2, HCOOH, and CH3COOH was investigated
using FTIR absorption spectrometry. This study has sug-gested adsorbed carbonic acid H2CO3to be involved in the
surface chemistry of CaCO3 and was reportedly identified
as a stable intermediate species on the CaCO3surface in the
presence of H2O vapor. The vibrational spectrum of carbonic
acid is characterized by its C=O stretching frequency at 1685 and 1705 cm−1corresponding to the adsorbed and condensed phase, respectively. In the following, adsorbed H2CO3will
1378 F. Karagulian et al.: Products and kinetics of N2O5interaction on mineral dust
Dissolution of CaCO3in the system H2O – CO2– CaCO3
is controlled by three molecular processes: dissolution at the mineral surface, mass transport by diffusion, and the slow Reaction (R4) which have been modelled by Buh-mann and Dreybrodt (BuhBuh-mann and Dreybrodt, 1985) with Reaction (R4) being rate limiting (Dreybrodt et al., 1997):
CO2(g)+H2O(ads) H2CO3(ads) H+(aq)+HCO
−
3(aq) (R4)
Bicarbonate ion, HCO−3, may react with CaCO3to yield a
surface intermediate that is proposed to be the active surface reactant for the heterogeneous reactions discussed below ac-cording to the well-known “Karst dissolution” mechanism (Dreybrodt et al., 1996):
CaCO3(s)+H+(ads)+HCO
−
3(ads)→Ca(OH)(HCO3) +CO2(g)(R5)
When the CaCO3sample is exposed to N2O5the surface
in-termediate may react as follows:
N2O5(g)+Ca(OH)(HCO3) →Ca(NO3)2+H2O(s)+CO2(g)(R6)
and the net reaction resulting from Reactions (R4), (R5) and (R6) will be:
N2O5+CaCO3→Ca(NO3)2+CO2(g) (R7)
Reaction (R5) is much too slow under flow reactor conditions such that the surface intermediate Ca(OH)(HCO3)may only
be formed under ambient conditions and at long reaction times according to a recent laboratory study (Santschi and Rossi, 2006). Once the surface intermediate is consumed, the surface reaction will saturate. Therefore, the rate and the ex-tent of the heterogeneous reaction depend on the abundance of the preexisting surface intermediate. On the time scale of the uptake experiments reported in Fig. 1 the calculated ratio CO2/N2O5of the product yields was 0.42 which is
signif-icantly smaller than 1.0 that is stoichiometrically expected according to Reaction (R7) (see Table 3). The mass balance between the adsorbed N2O5and the reaction product CO2is
therefore not satisfied. If Reactions (R4) and (R5) were fast and not rate limiting, the expected CO2yield would be 100%.
We therefore have to consider another possible pathway for Reaction (R6) that does not result in release of CO2:
N2O5+Ca(OH)(HCO3) →Ca(NO3)(HCO3)+HNO3(g)(R8)
In this case N2O5 may directly be converted into gas phase
HNO3 which is also observed at longer exposure times as
displayed in Fig. 1. Reaction (R8) may therefore explain why the ratio CO2/N2O5is significantly smaller than 1.0 as
no CO2is released from Reaction (R8). In addition, HNO3
may also react with CaCO3as already observed by Hanisch
and Crowley, 2001. We routinely measure a yield of 51% of gas phase H2O with respect to N2O5 consumed which
is comparable to the CO2 yield according to Reaction (R6)
and results from the uptake of N2O5on samples of different
mass of powdered CaCO3. In the wake of the observation
of H2O, CO2 and HNO3 we propose that Reactions (R6)
and (R8) compete with each other. H2O is formed in
Re-action (R6) on CaCO3 whose reactive interface consists of
the preexisting surface intermediate Ca(OH)(HCO3)
result-ing from prior exposure to atmospheric CO2 and H2O
fol-lowing Reactions (R4) and (R5).
In the present study we have mostly used a low-ordered commercially available CaCO3sample from Fluka
Corpora-tion. Owing to the fact that this CaCO3sample has a
spe-cific surface area (BET) of 5.06 m2/g, the 510 mg sample from the experiment displayed in Fig. 1 has a total surface area of 2.6×104cm2. N2O5may be represented as a sphere
with a projected surface area of 6.4×10⁻¹⁵cm2/molecule or 1.56×10¹⁴/molecules cm−2, assuming that N2O5 has a
characteristic diameter of approximately 9 ˚A and a den-sity of 2.93 g/cm3. After an exposure time of 1060 s
2.2×10¹⁸ molecules of N2O5 are taken up on 510 mg
of CaCO3(Fig. 1) leading to a surface concentration of 2.2×10¹⁸
2.6×104=8.4×10 13N
2O5molecule cm−2which corresponds
to a coverage (θ ) of approximately 54% based on the BET surface area after a reaction time of 1060 s. After N2O5
reacted on CaCO3 powder for 1060 s the substrate is
ap-parently at steady state as displayed in Fig. 1. This means that there is a sufficient number of intermediate species Ca(OH)(HCO3)to allow Reactions (R6) and (R8) to occur.
However, once reacted with N2O5, the intermediate species
cannot regenerate because Reactions (R4) and (R5) are too slow. Therefore, we observe an amount of CO2(g) smaller
than the maximum yield of 100% at steady state conditions. On the other hand, N2O5 may react with adsorbed water
H2O(ads)that still remains on the CaCO3 substrate, thereby
forming two molecules of nitric acid as follows:
N2O5(g)+H2O(ads)→2HNO3(g) (R9)
In this case solid CaCO3is just the support for the reactive
adsorbed water H2O(ads)and is not consumed in the
chemi-cal reaction. Initially, HNO3(g)is physically adsorbed on the
surface to result in adsorbed HNO3which reacts with a
sur-face OH-group and slowly forms sursur-face nitrates and H2O
according to Reaction (R10):
S−OH + HNO3(ads)→S−NO3+H2O(ads,g) (R10)
where S represents a surface site for physical adsorption. This mechanism has been proposed by Seisel and co-workers (Seisel et al., 2004) in a DRIFTS study of the heterogeneous reaction of HNO3on mineral dust where they observed the
presence of free OH-groups located on the surface of min-eral dust and the formation of surface nitrates. The fact that CO2is formed immediately after lifting the plunger (Fig. 1)
whereas HNO3is formed later on after a certain delay clearly
indicates that there are two competitive processes occurring during the reaction of N2O5with CaCO3. Immediately after
the exposure of substrate, N2O5reacts with the intermediate
species Ca(OH)(HCO3)on the CaCO3sample (Reactions R6
F. Karagulian et al.: Products and kinetics of N2O5interaction on mineral dust 1379 1.5 1.0 0.5 0.0 M S Signal (Volt ) 1200 1000 800 600 400 200 time (s) (a) (b) (c) (d) x 100 (e) /10 (a) (b) reaction on (a)corr (b)corr
Figure 1: Typical N
2O
5uptake experiment on a sample of 510 mg of CaCO
3. Curves (a), (b),
(c), (d) and (e) correspond to the raw MS signals monitored at m/e 46, m/e 30, m/e 44, m/e 63
and m/e 18, respectively, using an orifice diameter of 14 mm, A
s= 19.6 cm
2and [N
2O
5]
0=
(4.0 ± 1.0) x 10
11cm
-3. Curves (a)
corrand (b)
corrcorrespond to the corrected signal at m/e 46
and m/e 30 for the presence of HNO
3.
0.35 0.30 0.25 0.20 0.15 0.10 0.05 0.00 MS s ignal ( V ol t) 300 250 200 150 100 50 0 time (s) (a) (b) desorption on
Figure 2: Desorption of CO
2and NO after N
2O
5uptake on a sample of 510 mg CaCO
3displayed in Figure 1. Curves (a) and (b) correspond to the raw MS signals monitored at m/e
44 and m/e 30, respectively, at an orifice diameter of 14 mm and A
s= 19.6 cm
2.
30
Fig. 2. Desorption of CO2and NO after N2O5uptake on a sample of 510 mg CaCO3displayed in Fig. 1. Curves (a) and (b) correspond to
the raw MS signals monitored at m/e 44 and m/e 30, respectively, at an orifice diameter of 14 mm and As=19.6 cm2.
Table 4. Relationship between γ0 and γss at different residence
times τg(s−1) of N2O5interacting with 580 mg of CaCO3
pow-der for data plotted in Fig. 2, surface sample area As=19.6 cm2;
FN2O5 0 =2.3×10¹⁵molecule s −1. Orifice (mm) γ0 γss τg(s) 14 (1.6±0.13)×10−1 (6.0±1.2)×10−2 0.34 8 (8.5±0.8)×10−2 (3.0±0.7)×10−2 0.81 4 (3.4±1.0)×10−2 (1.8±1.1)×10−2 2.72 1 (1.1±1.0)×10−2 (1.0±1.0)×10−2 30
and R8). At the same time heterogeneous hydrolysis of N2O5
may occur due to the presence of H2O(ads) on the substrate
(Reaction R9). However, the presence of a sufficient quantity of the intermediate formed in Reaction (R5) may make tions (R6) and (R8) predominant at first with respect to Reac-tion (R9). This explains the initial rapid formaReac-tion of CO2(g)
and the absence of any measurable trace of gas phase HNO3
at t=92 s in Fig. 1. Reaction (R6) may explain the slow rise of HNO3with the extent of reaction as H2O(ads)is accumulating
on the surface and increasingly enabling the heterogeneous hydrolysis of N2O5 according to Reaction (R9). Once the
surface intermediate starts to be significantly depleted ow-ing to the initial fast reaction with N2O5Reactions (R6) and
(R8) start saturating and Reaction (R9) becomes predomi-nant which would explain the delayed formation of HNO3
displayed in Fig. 1. At present we do not have sufficient data to identify the elementary processes, Reactions (R6), (R8) and (R9) with the partial saturation of N2O5uptake during
the initial 300 s of exposure as discussed above and displayed in Fig. 1. However, we expect the changing branching ratio
between Reactions (R6) and (R8) on the one hand and the hydrolysis Reaction (R9) on the other hand with the extent of N2O5uptake to play a significant role. This may well be a
starting point for numerical modeling of the present reaction system.
After having performed the uptake experiment shown in Fig. 1 on a substrate of CaCO3, we sealed the sample and
halted the inlet flow of N2O5for approximately 10 min.
Sub-sequently, we lifted the plunger again and observed small amounts of desorbing CO2 (curve (a), Fig. 2) as well as a
MS signal at m/e 30 without any measurable MS signal at m/e 46 (curve (b), Fig. 2). The total yield of desorbed CO2
only represented 5% of N2O5 taken up on the substrate of
CaCO3during the reaction time of 1058 s (Fig. 1). The small
intensity of the MS signal at m/e 30 suggests formation of small amounts of NO as a decomposition product of N2O5
owing to the absence of a MS signal at m/e 46.
Uptake experiments of N2O5 on 0.58 g of CaCO3
pow-der were carried out at smaller orifice sizes, thus increased residence time τg at constant flow of N2O5 of 2.3×10¹⁵
molecule s−1. The values of γ0 and γss decrease with
in-creasing values of the residence time as displayed in Fig. 3 and Table 4. The strong dependence of γss on τg suggests
that the mechanism of N2O5 uptake is complex and does
not correspond to a simple first order uptake reaction. These observations indicate that the reactivity of N2O5on CaCO3
decreases for long residence times as the heterogeneous re-action rate not only depends on the gas phase concentration but apparently also on intermediates whose surface concen-tration depend on the extent of reaction that scales with τg
akin to an effective second order reaction. Apparently, the active surface intermediate Ca(OH)(HCO3)cannot
regener-ate under the present experimental conditions according to Reaction (R5). This is consistent with the preexisting nature of the surface intermediate discussed above.
1380 F. Karagulian et al.: Products and kinetics of N2O5interaction on mineral dust 0.15 0.10 0.05 0.00 γ 14 12 10 8 6 4 2 0 orifice (mm)
Figure 3: Dependence of γ
0(full squares) and γ
ss(open circles) for the uptake of N
2O
5on 580
mg CaCO
3powder on orifice size: A
sis 4.9 cm
2,
F
0N2O5= 2.3 x 10
15molecule s
-1.
0.25 0.20 0.15 0.10 0.05 0.00 γ 2.0 1.5 1.0 0.5 0.0 mass (g) 80 60 40 20 0 formal layers 5 4 3 2 1 "nominal layers"
Figure 4: Dependence of the uptake coefficient γ
0(open squares) and γ
ss(full circles) on
sample mass at [N
2O
5]
0= (4.0 ± 1.0) x 10
11cm
-3at an orifice diameter of 14 mm for the
uptake of N
2O
5on CaCO
3powder (A
s= 19.6 cm
2). Full triangles represent pulsed valve
experiments carried out at the same experimental conditions.
31
Fig. 3. Dependence of γ0(full squares) and γss(open circles) for the uptake of N2O5on 580 mg CaCO3powder on orifice size: Asis
4.9 cm2, FN2O5
0 =2.3×10¹⁵molecule s
−1.
In order to unravel whether or not the effective available surface area for uptake is influenced by the internal surface area formed by interstitial voids between individual dust par-ticles, the mass dependence of the N2O5uptake on CaCO3
was investigated in the Knudsen flow reactor at ambient tem-perature and at [N2O5]=(4.0±1.0)×1011cm−3. The mass of
CaCO3which is a non-porous material ranged from 0.11 g
to 1.8 g and the results are shown in Fig. 4. Table 5 re-ports values of γss and γ0 based on the geometric surface
area As=19.6 cm2. The steady state and initial uptake
coeffi-cient γssand γ0, respectively, of N2O5were found to increase
linearly with the mass of the CaCO3sample at low masses.
Samples below 0.33 g were considered to be part of this lin-ear mass-dependent regime. Increasing the sample mass fur-ther had a negligible effect on the amount of adsorbed N2O5
as apparently not the entire external sample surface is avail-able for N2O5adsorption. This maximum value is attributed
to the inability of N2O5to penetrate through all layers of the
sample within the residence time of N2O5in the gas phase,
thus resulting in a constant number of molecules taken up despite the increasing sample mass. The limiting γssvalue
therefore represents the maximum amount of N2O5 able to
interact with CaCO3powder within the N2O5residence time.
The Reaction of N2O5on CaCO3and other mineral dust
substrates is significantly different to that observed in lab-oratory work on N2O5on salt where it was concluded that
N2O5is non-sticky (Koch et al., 1999) and therefore able to
penetrate into the interstitial voids of the alkali salt sample in contrast to mineral dust, presumably because of the differ-ence in the number and types of surface OH-groups that seem to be more prevalent on mineral dust compared to alkali salts. We attribute a large value to γ for N2O5on CaCO3because
of the large initial uptake value γ0value reported in Table 6
at the low value of [N2O5] of 4.0×10⁻¹¹cm−3(γ0=0.12 for
CaCO3)which effectively prevents the application of pore
diffusion theory because reaction is much faster than Knud-sen diffusion into the bulk. In view of the small atmospheric concentration of N2O5 of typically 5.0×109cm−3which is
roughly two orders of magnitude lower than the lowest con-centration used in the present experiments and the observed inverse concentration dependence of both γ0and γss(Table 6,
except for Kaolinite, see Fig. 8) the rate of uptake under at-mospheric conditions will correspond to γ 0.12 such that we feel entitled to take the external surface as a basis to extract the γ values from the measured rates. In view of the low atmospheric [N2O5] we confer more weight to γ0because it
is mostly free of saturation effects that lower γ0 to γss
val-ues under the chosen experimental conditions as displayed in Fig. 1. Because we cannot attain concentration values of [N2O5]=5.0×109cm−3in the present experiment we simply
attribute more weight to γ0than to γssin that we believe that
γ0more accurately describes the atmospheric value in view
of the inverse concentration dependence.
In order to better define the saturation behavior of N2O5
on the substrate further uptake experiments were performed on CaCO3 employing a pulsed valve to admit N2O5 into
the reactor. The pulsed-valve experiments were carried out by using a solenoid valve, through which the gas was in-troduced in pulses with a duration of 5 ms and at a dose of 2.5×10¹⁵ molecules per pulse (Caloz et al., 1997) cor-responding to [N2O5]0=1.3×012cm−3. We determined the
total number of injected molecules per pulse and the value of kescin a reference experiment which was obtained by
fit-ting the decaying MS signal to a single exponential decay in the absence of reaction thereby obtaining kesc. The “reactive
pulse” was obtained by repeating the same pulsed experiment with the sample exposed to the gas. The total observed expo-nential decay in the presence of a reactive substrate was thus
F. Karagulian et al.: Products and kinetics of N2O5interaction on mineral dust 1381 0.15 0.10 0.05 0.00 γ 14 12 10 8 6 4 2 0 orifice (mm)
Figure 3: Dependence of γ
0(full squares) and γ
ss(open circles) for the uptake of N
2O
5on 580
mg CaCO
3powder on orifice size: A
sis 4.9 cm
2,
F
0N2O5= 2.3 x 10
15molecule s
-1.
0.25 0.20 0.15 0.10 0.05 0.00 γ 2.0 1.5 1.0 0.5 0.0 mass (g) 80 60 40 20 0 formal layers 5 4 3 2 1 "nominal layers"
Figure 4: Dependence of the uptake coefficient γ
0(open squares) and γ
ss(full circles) on
sample mass at [N
2O
5]
0= (4.0 ± 1.0) x 10
11cm
-3at an orifice diameter of 14 mm for the
uptake of N
2O
5on CaCO
3powder (A
s= 19.6 cm
2). Full triangles represent pulsed valve
experiments carried out at the same experimental conditions.
31
Fig. 4. Dependence of the uptake coefficient γ0(open squares) and γss(full circles) on sample mass at [N2O5]0=(4.0 ± 1.0)×1011cm−3at
an orifice diameter of 14 mm for the uptake of N2O5on CaCO3powder (As=19.6 cm2). Full triangles represent pulsed valve experiments
carried out at the same experimental conditions.
characterized by a new rate constant, kdec, given by kdec=
kobs + kescthat is used to determine the number of interest
given by γPV=kobs/ω.The pulsed valve uptake experiments
on CaCO3showed that there is a modest mass-dependence of
the measured uptake γP V by approximately a factor of three
to four. For a dose of about 2.5×10¹⁵ molecules per pulse we observed an unexpected increase of the uptake γP V with
increasing mass of CaCO3as reported for steady state
exper-iments in Table 5 and displayed in Fig. 4. The increase of
γP V saturates at large sample mass because the number of
layers exceeds the depth of diffusion of gas into the internal voids. For all series of pulses the measurements are identical, within the uncertainty, to those for steady state experiments. Similar behavior has been observed in a recent study car-ried out by Seisel et al. (Seisel et al., 2005). In that study uptake experiments of N2O5on Saharan Dust obtained from
pulsed and steady state experiments were in good agreement, indicating that the steady state uptake coefficients are not in-fluenced by saturation effects under their experimental con-ditions.
The good agreement between γ0 from pulsed valve and
continuous flow experiments gives us confidence in the large numerical value which precludes pore diffusion. Real-time diffusion tube experiments showed that the interaction of Ar and N2 molecules with toluene and black decane soot,
re-spectively, does not differ significantly from the one of a Teflon-coated tube (Alcala, 2002). We take this as an indi-cation that on a time scale of a few seconds the gas does not explore the interstitial space of the sample. However, on a much longer time scale slow diffusional processes will trans-port N2O5into the bulk. Therefore, γssis controlled both by
saturation as well as by mass transport.
In order to determine the number of sample layers, the to-tal volume of the powder was calculated from its true density (ρt=2.93 g/cm3)and the mass of the sample spread out across
the geometric area of the sample holder. The number of for-mal layers calculated for an average sample grain diameter of 3.5 µm from the average particle size and the height of the sample is reported in Table 5. The typical grain diameter of 3.5 µm has been obtained from the manufacturer’s speci-fications of the used CaCO3powder and presumably
corre-sponds to the size of the primary CaCO3particles. Published
electron microscopy (SEM) images suggest a grain size di-ameter that is larger than 3.5 µm as displayed in Fig. 5, pre-sumably owing to agglomeration of primary particles. Fol-lowing Fig. 4 we make the assumption that the “break” at 330 mg of CaCO3in the γ0and γP V curve vs. sample mass
corresponds to one effective or “nominal” layer of CaCO3
particles that fully covers the geometric surface As of the
sample support. A mass of 330 mg corresponds to one nom-inal layer of 57 µm diameter CaCO3 particles “filling” the
geometric surface of the sample holder As=19.6 cm2 using
an arrangement of closely-packed spherical particles. Thus, one nominal layer of CaCO3 will contain 330 mg CaCO3
of closely packed spheres of “effective” grain diameter of 57 µm knowing full well that the sample in reality is mul-tidisperse and structurally heterogeneous. The linear mass dependence of γ up to a sample mass of 330 mg displayed in Fig. 4 is a consequence of the fact that γ has been calcu-lated using the full value of Asin the expression for the
col-lision frequency ω although the sample holder was only par-tially covered with CaCO3 particles. Had we used the true
geometric surface area for samples less than 330 mg in the calculation of γ we would have obtained the constant value
1382 F. Karagulian et al.: Products and kinetics of N2O5interaction on mineral dust
Figure 5: SEM-image of 5 mg of CaCO
3powder sample used in this work. The dark area is the sample
holder.
1.6
1.4
1.2
1.0
0.8
0.6
0.4
0.2
0.0
MS
S
ignal
(
V
o
lt)
2200
2000
1800
1600
time (s)
reaction on
(a)
(b)
(a)
(b)
(c) x 100
(d)/10
(a)
corrFigure 6: Typical N
2O
5uptake experiment on a sample of 1 g of Kaolinite. Curves (a), (b), (c)
and (d) correspond to the raw MS signals monitored at m/e 46, m/e 30, m/e 63 and m/e 18,
respectively, using an orifice diameter of 8 mm and [N
2O
5]
0= (3.8 ± 0.5) x 10
12cm
-3. Curve
(a)
corrcorresponds to the corrected signal at m/e 46 for the presence of HNO
3.
32
Fig. 5. SEM-image of 5 mg of CaCO3powder sample used in this work. The dark area is the sample holder.
displayed for sample masses in excess of 330 mg. Therefore, the linear mass dependence is an artifact resulting from the use of a constant value of Asin the calculation of γ for
sam-ple masses corresponding to partial coverage of the samsam-ple holder of area Aswith CaCO3particles of 57 µm diameter.
In contrast, the use of the BET (Brunauer-Emmett-Teller) surface area and the pore diffusion theory (KLM) (Keyser et al., 1991) would substantially underestimate the true uptake coefficient. An alternate interpretation of the same data dis-played in Fig. 4 makes use of the assumption that the sample consists of small CaCO3particles of 3.5 µm diameter
lead-ing to a multilayer structure of the sample. This assumption which may be questioned on the basis of the image of the CaCO3sample displayed in Fig. 5 evidently leads to a
multi-layer coverage in the linear mass dependence of γ displayed in Fig. 4 in contrast to the partial coverage assumption dis-cussed above. Table 5 reveals that at the “break” point of 330 mg one effective sample layer corresponds to 16 formal layers which is a consequence of the differing particle size, namely 57 vs. 3.5 µm. Owing to the multilayer nature of the sample under this assumption pore diffusion theory has been applied and results in γpd,ss=(7.4±1.7)×10−6using a
tortu-osity factor τ =2.7 for a grain diameter for CaCO3of 3.5 µm
(dashed curve, Fig. 4). This value of γ is lower by a fac-tor of 103compared to γss=(2.8±0.5)×10−2and γ0=0.16 ±
0.02 which were calculated on the basis of the geometrical surface area As of the sample as displayed in Table 5. The
use of the pore diffusion theory substantially underestimates the true uptake coefficient so that it may be interpreted as a lower limit for γgwhereas γssand γ0based on the
geometri-cal surface area may be regarded as an upper limit to the true value of γ .
A supporting argument in favor or using the geometric sur-face area Asin evaluating γ comes from pulsed valve
experi-ments whose results are virtually identical to the steady state experiments at “zero” time after the start of the uptake re-action, namely γ0 (Fig. 1). We support the view that it is
improbable for the gas to explore the whole internal (BET) surface area of the sample during a typical pulse decay last-ing for a few seconds or so based on diffusion tube experi-ments under molecular flow conditions performed by Alcala (2002).
In conclusion, we present two main arguments in favor of using the geometric surface area for the calculation of γ per-taining to the interaction of N2O5with CaCO3: (a) the large
magnitude of the uptake coefficient, γ0, γPV, and γssmakes
diffusion into the interstitial space non-competitive with re-action. This will be even more the case at atmospheric con-centrations owing to the observed inverse concentration de-pendence which has been observed on numerous occasions, for instance for NO3 free radical interacting with CaCO3
(Karagulian and Rossi, 2005); (b) the good agreement be-tween steady-state and pulsed valve experiments have firmly established the large values of γ0which decrease to a
steady-state owing to saturation of the uptake. It is thought to be highly unlikely that N2O5is able to explore the internal
sur-face area on the time scale of a pulsed valve uptake exper-iment. The linear mass dependence of γ from 0 to 330 mg displayed in Fig. 4 is a trivial artifact that is related to the use of Asin computing γ despite the incomplete coverage of the
sample holder with CaCO3particles.
F. Karagulian et al.: Products and kinetics of N2O5interaction on mineral dust 1383
Figure 5: SEM-image of 5 mg of CaCO3 powder sample used in this work. The dark area is the sample
holder. 1.6 1.4 1.2 1.0 0.8 0.6 0.4 0.2 0.0 MS S ignal ( V o lt) 2200 2000 1800 1600 time (s) reaction on (a) (b) (a) (b) (c) x 100 (d)/10 (a)corr
Figure 6: Typical N2O5 uptake experiment on a sample of 1 g of Kaolinite. Curves (a), (b), (c)
and (d) correspond to the raw MS signals monitored at m/e 46, m/e 30, m/e 63 and m/e 18,
respectively, using an orifice diameter of 8 mm and [N2O5]0 = (3.8 ± 0.5) x 10
12cm
-3. Curve
(a)corr corresponds to the corrected signal at m/e 46 for the presence of HNO3.
32
Fig. 6. Typical N2O5uptake experiment on a sample of 1 g of Kaolinite. Curves (a), (b), (c) and (d) correspond to the raw MS signals
monitored at m/e 46, m/e 30, m/e 63 and m/e 18, respectively, using an orifice diameter of 8 mm and [N2O5]0=(3.8±0.5)×1012cm−3. Curve (a)corrcorresponds to the corrected signal at m/e 46 for the presence of HNO3.
1.5 1.0 0.5 0.0 MS Si gna l ( V ol t) 2000 1800 1600 1400 time (s) (a) (b) (c) x 100 reaction on (d)/10 (a) (b) (a)corr
Figure 7: Typical N
2O
5uptake experiment on a sample of 1 g of Saharan Dust. Curves (a),
(b), (c) and (d) correspond to the raw MS signals monitored at m/e 46, m/e 30, m/e 63 and
m/e 18, respectively, using an orifice diameter of 8 mm and [N
2O
5]
0= (3.8 ± 0.5) x 10
12cm
-3.
Curve (a)
corrcorresponds to the corrected signal at m/e 46 for the presence of HNO
3.
0.35 0.30 0.25 0.20 0.15 0.10 0.05 0.00 γ 4x10¹² 3 2 1 0 [N2O5] cm-3
Figure 8: N
2O
5on 200 mg Kaolinite: uptake coefficient γ of N
2O
5as a function of [N
2O
5]:
initial (γ
0, open circles) and steady state (γ
ss, full triangles) uptake coefficients for A
s= 4.9
cm
2. Full and empty symbols are referred to uptake experiments carried out with an orifice
diameter of 4 and 8 mm orifice diameter, respectively.
Fig. 7. Typical N2O5uptake experiment on a sample of 1 g of Saharan Dust. Curves (a), (b), (c) and (d) correspond to the raw MS signals
monitored at m/e 46, m/e 30, m/e 63 and m/e 18, respectively, using an orifice diameter of 8 mm and [N2O5]0=(3.8±0.5)×1012cm−3. Curve
(a)corrcorresponds to the corrected signal at m/e 46 for the presence of HNO3.
5 Uptake of N2O5on mineral dust substrates: results
and discussion
Table 6 reports results on experiments performed on 1 g samples of surrogate mineral dust powder at a high ini-tial concentration of [N2O5]0=(3.8±1.0)×1012cm−3. The
steady-state uptake coefficients γss of N2O5 range from
(2.2±0.6)×10−3 for natural limestone to (5.9±1.6)×10−2
for Saharan Dust using the geometric surface area. At a lower initial concentration of [N2O5]0=(4.0±1.0)×1011cm−3
up-take experiments performed on 0.3 g have revealed larger values of γss ranging from (3.5±1.1)×10−2 for CaCO3
to 0.2±0.05 for Saharan Dust. We also report the ob-served initial uptake coefficients γ0 for N2O5 on all the
samples of mineral dust at low and high values of [N2O5].
For a concentration of [N2O5]0=(3.8± 0.5)×1012cm−3the
γ0 values range from (6.4±1.9)×10−3 for Arizona test
dust to (9.0±2.6)×10−2 for Saharan Dust, whereas at [N2O5]0=(4.0±1.0)×1011cm−3 the γ0 values range from
0.12±0.04 for CaCO3 to 0.43±0.13 for natural limestone.
For samples such as Saharan Dust, CaCO3and Arizona Test
Dust values of γssand γ0decrease between a factor of 3 and
7 from low to high [N2O5]0. As indicated in Table 6, both
the values γss and γ0 for CaCO3decrease only by a factor
3.5 from low to high [N2O5]. On the other hand, a
particu-lar case is represented by natural limestone which showed a decrease of γssand γ0by a factor of 20 and 40, respectively,
when increasing [N2O5]0.CaCO3showed values of γssand
γ0 higher by a factor of 3 with respect to natural limestone
at high [N2O5]0. This difference is reversed by the same
amount for low [N2O5]0 with γ of natural limestone being
highly sensitive to saturation by [N2O5]. Natural limestone
1384 F. Karagulian et al.: Products and kinetics of N2O5interaction on mineral dust 1.5 1.0 0.5 0.0 MS Si gna l ( V ol t) 2000 1800 1600 1400 time (s) (a) (b) (c) x 100 reaction on (d)/10 (a) (b) (a)corr
Figure 7: Typical N2O5 uptake experiment on a sample of 1 g of Saharan Dust. Curves (a),
(b), (c) and (d) correspond to the raw MS signals monitored at m/e 46, m/e 30, m/e 63 and m/e 18, respectively, using an orifice diameter of 8 mm and [N2O5]0 = (3.8 ± 0.5) x 1012 cm-3.
Curve (a)corr corresponds to the corrected signal at m/e 46 for the presence of HNO3.
0.35 0.30 0.25 0.20 0.15 0.10 0.05 0.00 γ 4x10¹² 3 2 1 0 [N2O5] cm -3
Figure 8: N2O5 on 200 mg Kaolinite: uptake coefficient γ of N2O5 as a function of [N2O5]:
initial (γ0, open circles) and steady state (γss, full triangles) uptake coefficients for As = 4.9
cm2. Full and empty symbols are referred to uptake experiments carried out with an orifice diameter of 4 and 8 mm orifice diameter, respectively.
33
Fig. 8. N2O5on 200 mg Kaolinite: uptake coefficient γ of N2O5 as a function of [N2O5]: initial (γ0, open circles) and steady state
(γss, full triangles) uptake coefficients for As=4.9 cm2. Full and
empty symbols are referred to uptake experiments carried out with an orifice diameter of 4 and 8 mm orifice diameter, respectively.
is a sedimentary rock containing 97% CaCO3by weight and
a small percentage of metal oxides (see Table 2) that may be responsible for the difference in the kinetic properties of CaCO3and natural limestone. In recent work Krueger and
co-workers (Krueger et al., 2005), showed that dust contain-ing calcium is very reactive with respect to the uptake of ni-tric acid. However, because of differences in mineralogy of single dust-particles, not all of the calcium-containing parti-cles react similarly.
It is important to note that for Kaolinite γssand γ0are
inde-pendent of [N2O5]0over the investigated range. Typical raw
data from an uptake experiment of N2O5on 1 g of Kaolinite
and Saharan Dust are shown in Figs. 6 and 7. In this series of experiments we did not succeed to saturate the samples during the present observation period. Uptake experiments of N2O5on 0.2 g of Kaolinite powder were carried out by
varying the initial flow of N2O5 into the reactor (Table 7).
Figure 8 displays data for the 8 mm orifice corresponding to a residence time τg of 1.32 s for a variation of [N2O5]0
by a factor 9.5 that is between (4.0±1.0)×1011cm−3 and
(3.8±0.5)×1012 cm−3. Figure 8 shows that both γ
0and γss
remain constant at 0.19±0.05 and (2.3±0.6)×10−2, respec-tively, with increasing [N2O5] and by changing the gas
resi-dence time τg. From this series of measurements it is evident
that γssfollows a pseudo first order rate law in N2O5in
con-trast to the other substrates which showed a decreasing trend from low to high [N2O5] (see Fig. 3 and Table 6).
In recent work the uptake of N2O5 on Saharan Dust
was found to be independent of [N2O5] (Seisel et al.,
2005). An initial uptake γ0=(8.0±0.3)×10−2 was found,
whereas the steady state value γss=(1.3±0.3)×10−2 was
lower by a factor of five with respect to the present results at [N2O5]0=(3.8±0.5)×1012cm−3 for reasons that are not
apparent.
We have observed delayed production of HNO3upon
up-take of N2O5 for every sample investigated. Gas phase
HNO3formation may be due to the heterogeneous hydrolysis
of N2O5according to Reaction (R9). In order to understand
the gas phase production of HNO3 we want to stress that
all the investigated samples have a non negligible amount of adsorbed water available on the substrate surface. The quantities of H2O(ads)that still remain on the different
min-eral dust substrates at our experimental conditions as re-ported in Table 6 and were measured by gravimetric mea-surements. The hygroscopic properties of mineral aerosol samples have been examined in recent work (Gustafsson et al., 2005) which showed significant water adsorption on Ari-zona Test Dust compared to CaCO3. In Table 6 we also
report the percentage of gas phase HNO3 produced with
respect to N2O5 taken up during a reaction time of 200 s.
At [N2O5]=(3.8±0.5)×1012cm−3, Arizona Test Dust and
Kaolinite turned out to be the samples to produce the largest amount of gas phase HNO3, that is 72% and 30%,
respec-tively, with respect to N2O5taken up. On the other hand,
Sa-haran Dust and CaCO3have been the samples with a lower
yield of absolute HNO3 produced, namely 5% and 6%,
re-spectively. At [N2O5]=(4.0±1.0)×1011cm−3 we obtained
lower yields of gas phase HNO3 compared to [N2O5] ten
times higher. In this case we may correlate the low yield of HNO3to the large rate of uptake of N2O5and of HNO3on
mineral dust. Adsorbed HNO3may then form salts such as
Ca(NO3)2, Fe(NO3)3and surface nitrates as shown in other
experimental studies (B¨orensen et al., 2000; Goodman et al., 2001; Vogt and Finlayson-Pitts, 1994). A recent study on the reactivity of gaseous HNO3 on atmospheric mineral
dust samples reported values for the uptake of HNO3 on
CaCO3, Saharan Dust and Arizona Test Dust (Hanisch and
Crowley, 2001a). In that work, a value of γ0=0.11 based
on the geometric surface area was determined for Saharan Dust at [HNO3]=(5.6±0.4)×1011cm−3, 0.14 for CaCO3and
6.6×10⁻² for Arizona Test Dust. These results are consis-tent with the trend of the present yields of HNO3measured
for nominally the same mineral dust samples. Whenever the uptake coefficient of HNO3 on the mineral substrates was
low such as for Arizona Test Dust and Kaolinite, we find in-creased amounts of HNO3in the gas phase. Conversely, the
reverse is true for samples that rapidly take up HNO3as for
CaCO3and Saharan Dust (B¨orensen et al., 2000).
6 Conclusions and atmospheric implications
We have shown in this work that N2O5 undergoes a
het-erogeneous reaction with surrogate substrates of mineral dust aerosol at T=298±2 K. The measured uptake coefficient showed different values for high and low N2O5
concentra-tions with the least differences for Saharan Dust. These γ values are generally larger than the ones used in a recent global modeling simulation of heterogeneous chemistry on mineral dust aerosol at dry conditions (Bauer et al., 2004) where γ =3.0×10⁻³for N2O5has been used. The γ values
resulting from the present measurements are larger by at least
F. Karagulian et al.: Products and kinetics of N2O5interaction on mineral dust 1385
Table 5. Summary of uptake experiments with N2O5on CaCO3 as a function of sample mass ([N2O5]=(4.0±1.0)×1011cm−3, orifice
diameter=14 mm, As=19.6 cm2).
Mass (g) γss γ0 γ0(pulsed valve) aNumber of formal layers bNumber of nominal layers
0.11 (8.0±5.0)×10−3 (5.5±2.0)×10−2 (4.7±1.5)×10−2 5 0.3 0.15 (1.5±0.5)×10−2 (6.4±3.0)×10−2 7 0.5 0.33 (2.0±0.6)×10−2 0.16±0.03 0.13±0.018 16 1 0.51 (2.2±0.5)×10−2 0.2±0.02 25 1.5 0.58 (2.3±0.5)×10−2 0.18±0.02 30 1.8 0.73 (2.4±0.5)×10−2 0.22±0.02 0.21±0.016 36 2.2 1.0 (2.7±0.4)×10−2 0.15±0.025 50 3 1.3 (2.8±0.5)×10−2 0.16±0.024 64 4 1.6 (2.8±0.5)×10−2 0.15±0.024 0.15±0.015 80 5 1.8 (2.8±0.5)×10−2 0.17±0.03 90 5.5
Effective diameter ofa3.5 µm andb57 µm.
Table 6. Summary of uptake experiments of N2O5on mineral dust samples: initial (γ0)and steady state (γss)uptake coefficients.
Mineral dust sample aγ0 aγss aHNO3 H2O(ads)[mg g−1]
Kaolinite 0.14±0.04 (2.2±0.6)×10−2 30% 23
Natural Limestone (1.1±0.3)×10−2 (2.2±0.6)×10−3 18% 7
Arizona Test Dust (6.4±1.9)×10−2 (1.6±0.4)×10−2 72% 22
CaCO3 (3.3±1.0)×10−2 (6.2±1.8)×10−3 5% 4 Saharan Dust (9.0±2.6)×10−2 (5.9±1.6)×10−2 6% 20 bγ 0 bγss bHNO3 Kaolinite (0.16±0.04) (2.1±0.6)×10−2 17% Natural Limestone (0.43±0.13) (4.3±1.3)×10−2 12%
Arizona Test Dust (0.2±0.06) (0.11±0.03) 20%
CaCO3 (0.12±0.04) (2.1±0.6)×10−2 5%
Saharan Dust (0.3±0.08) 0.2±0.05 4%
Uptake experiments were performed at a[N2O5]0=(3.8±0.5)×1012cm−3 using 1 g of sample powder for As=19.6 cm2; b[N
2O5]0=(4.0±1.0)×1011cm−3 using 300 mg of sample powder for As=4.9 cm2. The yield of HNO3 is given as a percentage
with respect to the total molecules of N2O5taken up after a given reaction time of 200 s at orifice diameter of 8 mm.
a factor of 10. Therefore, the uptake of N2O5on mineral dust
aerosols may potentially have a greater influence on the re-duction of the global ozone concentration compared to the estimated value of 0.7% (Bauer et al., 2004).
In a recent laboratory study on the heterogeneous re-action of N2O5 with Saharan dust Seisel et al. (2005)
found γ0=(8.0±0.3)×10−2 and γss=(1.3±0.3)×10−2,
respectively, at [N2O5]=9.0×1010cm−3. At
[N2O5]=(4.0±1.0)×1011cm−3 used in this work
(Ta-ble 6), we have found values for γ0and γsslarger by a factor
of 4 and 15, respectively. In a recent numerical modeling study the interaction of N2O5(γ =0.1), O3and HO2radicals
with dust resulted in a decrease of tropospheric ozone of up to 10% near the dust source areas. (Dentener et al., 1996). In comparison, the measured uptake coefficient γ of N2O5
on sulfuric acid aerosols was reported to lie within the range 0.06–0.12 at a temperature between 230 and 300 K (Hanson and Lovejoy, 1994). Other measurements reported γ values of 0.05 on aqueous surfaces over a temperature range from 282 to 294 K (van Doren et al., 1990).
The photolysis rate of NO3 (J(NO3)=0.2 s−1)is too fast
to allow recombination with NO2to N2O5during daylight.
Therefore, the heterogeneous chemistry of N2O5 is
impor-tant only at night-time. The heterogeneous reaction of N2O5
is most effective during the night when rh is at a maximum in the boundary layer. Thus, under these conditions, dust particles are likely to contain significant quantities of ad-sorbed water and the assumed high values of γ seem justi-fied (Dentener and Crutzen, 1993). In a recent global model-ing study γ =0.02 (rh=70%) and γ =3.0×10⁻³(rh=30%) for
1386 F. Karagulian et al.: Products and kinetics of N2O5interaction on mineral dust
Table 7. Summary of uptake experiments of N2O5 on 200 mg
Kaolinite for data plotted in Fig. 8: initial (γ0)and steady state
(γss)uptake coefficients (As=4.9 cm2). [N2O5] molecules cm−3 γ0 γss a(4.0±1.0)×1011 0.16±0.04 (2.1±0.6)×10−2 b(6.2±1.5)×1011 0.23±0.06 (2.6±0.5)×10−2 a(9.0±0.5)×1011 0.22±0.06 (2.2±0.5)×10−2 b(2.1±0.5)×1012 0.18±0.05 (2.4±0.7)×10−2 a(3.8±0.5)×1012 0.16±0.04 (2.2±0.6)×10−2 aOrifice diameter=8mm;bOrifice diameter=4 mm.
humid and dry conditions have been used as upper and lower limits, respectively (Bauer et al., 2004). The modeling results show that when applying the high value for the uptake coef-ficient 0.8% of the global ozone mass is removed by uptake of N2O5on aerosols. The observed reaction products of the
heterogeneous reaction of N2O5with mineral dust, mainly
HNO3, may also have an influence on the oxidizing
poten-tial of the atmosphere as well as on the atmospheric ozone balance. Previous laboratory work (Goodman et al., 2000; Hanisch and Crowley, 2001a; Seisel et al., 2004) has shown the importance of the reactivity of HNO3 on mineral dust
substrates. In addition, modeling studies have quantitatively shown decreases in ozone concentration close to the area of HNO3destruction (Bauer et al., 2004).
The Saharan dust sample, from Cape Verde (SDCV), that we have used is mineralogically representative of atmo-spheric dust aerosol. Its composition has been described in the literature (Coud´e-gaussen et al., 1994) and closely simu-lates atmospheric particles of crustal origin (Desboeufs et al., 1999). The clay fraction (<2 µm) of dust from Cape Verde shows a kaolinite-illite-chlorite assemblage which is typical for central Saharan Dust. In the free troposphere mineral dust aerosol of a size less than 2 µm have a settling veloc-ity of approximately 50 cm h−1(Seinfeld and Pandis, 1998). Therefore it can remain in the atmosphere for several days, travel long distances and undergo heterogeneous reactions with trace gases.
The loss rate constant (kMhet)due to heterogeneous uptake of a gas species M onto small aerosol particles is given by
kMhet=γ A ¯c/4 if the rate is not limited by diffusion, where γ is the uptake coefficient of M and is a function of the mineral dust aerosol composition, A is the surface area density of the dust aerosol and ¯c is the mean molecular speed of M. Assuming a surface area density for Saharan Dust of about 1.5×10⁻⁶cm2cm−3 (de Reus et al., 2000), we estimate
kN2O5
het =1.76×10
−3s−1(τN2O5
het =9.5 min) for N2O5based on
γ=0.2 for Saharan dust at [N2O5]<(4.0 ± 1.0)×1011cm−3
(16 ppb). From the difference between the N2O5formation
and loss in the presence of the equilibrium with NO3we
ob-tain the expression for the N2O5steady state lifetime given
in Eq. (4) (Brown et al., 2003):
τN2O5 ss = k N2O5 het + kNO3 het k1(T ) k−1[NO2] !−1 (4)
k1(T ) and k−1 are the rate constant for thermal
decom-position of N2O5 and its inverse at atmospheric pressure
according to equilibrium (R1), respectively. From recent work on the NO3 heterogeneous reaction on mineral dust
we have obtained γ =0.2 which leads to kNO3
het =2.4×10
−3s−1
(τNO3
het =7 min) for NO3(Karagulian and Rossi, 2005).
At T=273 K k1(273K)=3.1×10⁻³ s−1(τ=5 min)
(Atkin-son et al., 1997) and equilibrium (R1) is shifted to the left. For [NO2] a typical value is 10 ppb in polluted air so that the
pseudo first-order recombination rate constant k−1[NO2] is
0.48 s−1which is much larger than the rate constant for het-erogeneous loss kNO3
het =2.4×10
−3s−1. Therefore, the second
term of Eq. (4) will be negligible and the steady state lifetime
τN2O5
ss of N2O5will be determined by its heterogeneous loss
rate constant kN2O5
het .
At T=293 K equilibrium (R1) is shifted to the right with
k1(293 K)=4.6×10⁻²s−1(τ =20 s) which is an order of
mag-nitude larger than at T=273 K. Therefore, both terms in Eq. (4) will be of comparable magnitude which will decrease the steady state lifetime of N2O5with respect to 273 K
some-what.
The calculated overall steady state lifetime for N2O5
at 293 K (τN2O5
ss =8.5 min) is significantly larger than the
thermal dissociation lifetime (τ =20 s) of N2O5. At
the same surface area concentration for dust aerosol of 1.5×10⁻⁶cm2cm−3, the heterogeneous loss rate khydr
het due
to hydrolysis (Reaction R2) is 2.25×10⁻⁴s−1corresponding to a lifetime of 74 min. This means that some N2O5may be
irreversibly converted to HNO3during the night by
hydroly-sis.
During January 2004, Wood (Wood et al., 2005) per-formed in situ measurement of N2O5 in Contra Costa
Country, California, and derived a steady state lifetime for N2O5 that ranged from 5 to 30 min at [N2O5]=200 ppt
(5.0×109cm−3)in the temperature range 275–285 K which is comparable to τN2O5
ss calculated above. With an estimated
value of γ =0.07 Wood et al. derived a total estimated aerosol surface area of 200 µm−2cm−3 from the above measured N2O5lifetime. The γ0value of 0.2 for mineral dust aerosol
measured in this work is consistent with the field mea-surement in the presence of an “urban aerosol” which cer-tainly does not correspond to a typical mineral dust aerosol. Clearly, a quantitative comparison is not possible owing to lack of data. However, with an uptake coefficient lower by three orders of magnitude such as pore diffusion corrected the aerosol loading would have to be higher by the same fac-tor at constant N2O5lifetime which may be excluded on
ex-perimental grounds as it is already quite high for a suburban environment. The measured lifetime for N2O5from the field

![Table 3. Uptake experiments with N 2 O 5 on CaCO 3 as a function of sample mass at [N 2 O 5 ] 0 =(4.0 ± 1.0) × 10 11 cm −3](https://thumb-eu.123doks.com/thumbv2/123doknet/14555211.537400/6.892.185.702.137.274/table-uptake-experiments-n-caco-function-sample-mass.webp)


![Figure 6: Typical N 2 O 5 uptake experiment on a sample of 1 g of Kaolinite. Curves (a), (b), (c) and (d) correspond to the raw MS signals monitored at m/e 46, m/e 30, m/e 63 and m/e 18, respectively, using an orifice diameter of 8 mm and [N 2 O 5 ] 0](https://thumb-eu.123doks.com/thumbv2/123doknet/14555211.537400/12.892.190.695.104.344/figure-typical-experiment-kaolinite-correspond-monitored-respectively-diameter.webp)
![Figure 7: Typical N 2 O 5 uptake experiment on a sample of 1 g of Saharan Dust. Curves (a), (b), (c) and (d) correspond to the raw MS signals monitored at m/e 46, m/e 30, m/e 63 and m/e 18, respectively, using an orifice diameter of 8 mm and [N 2 O 5 ]](https://thumb-eu.123doks.com/thumbv2/123doknet/14555211.537400/13.892.67.432.98.272/figure-typical-experiment-saharan-correspond-monitored-respectively-diameter.webp)
