HAL Id: hal-01346003
https://hal.sorbonne-universite.fr/hal-01346003
Submitted on 18 Jul 2016HAL is a multi-disciplinary open access archive for the deposit and dissemination of sci-entific research documents, whether they are pub-lished or not. The documents may come from teaching and research institutions in France or abroad, or from public or private research centers.
L’archive ouverte pluridisciplinaire HAL, est destinée au dépôt et à la diffusion de documents scientifiques de niveau recherche, publiés ou non, émanant des établissements d’enseignement et de recherche français ou étrangers, des laboratoires publics ou privés.
Open cracks depth sizing by multi-frequency laser
stimulated lock-in thermography combined with image
processing
Steve Beuve, Zihi Qin, Jean-Paul Roger, Stéphane Holé, Christine Boué
To cite this version:
Steve Beuve, Zihi Qin, Jean-Paul Roger, Stéphane Holé, Christine Boué. Open cracks depth sizing by multi-frequency laser stimulated lock-in thermography combined with image processing. Sensors and Actuators A: Physical , Elsevier, 2016, �10.1016/j.sna.2016.06.028�. �hal-01346003�
Open cracks depth sizing by multi-frequency laser stimulated lock-in thermography combined
with image processing
Steve Beuve1, Zihi Qin1, Jean-Paul Roger2,3, Stéphane Holé1,4,5, Christine Boué1,4,5
1
Sorbonne Universités, UPMC Univ Paris 06, F-75005 Paris, France
2
CNRS, UMR 7587, F-75005, Paris, France
3
Institut Langevin, PSL Research University, ESPCI ParisTech, 1 rue Jussieu, F-75005, Paris, France
4 LPEM, PSL Research University, ESPCI-ParisTech, 10 rue Vauquelin, F-75005 Paris, France 5 CNRS, UMR 8213, F-75005 Paris, France
Highlights
the multi-frequency lock-in infrared thermography method is used to evaluate perpendicular crack
depths.
the experimental curves of the spatial second derivative (Laplacian) of the amplitude and of the phase
of the infrared signal are analyzed as a function of the thermal diffusion length.
direct depth indicators depending on both the Laplacian of amplitude and phase images are introduced.
experimental measurements validate the method for crack depths ranging from about 0.5 to 3 mm in
metallic material.
Abstract
The multi-frequency lock-in thermography is coupled with efficient image processing to analyse
infrared open crack footprint. It has been shown that the evolution of the Laplacian of modulated
surface temperature amplitude image as a function of the diffusion length allows to estimate the depth
of surface open defects but requires calibration abacus obtained by finite element method simulations. In this work, a method is proposed to avoid the tedious use of abacus by introducing an indicator of the crack depth using a simple expression depending on the Laplacian of both amplitude and phase
images. This multi-frequency method is presented through numerical simulations. Besides, the
analysis of experimental results obtained on artificial and real open vertical cracks in metallic samples
show that the depth of the defects can be directly estimated.
Keywords: lock-in; thermography; crack depth; modulation frequency; infrared images; non
destructive control.
1. Introduction
Structures submitted to cyclic mechanical loading can develop cracks which can be highly damaging.
The depth of a crack is an important information to access its dangerousness. But this information is
not easy to obtain. Liquid penetrant, the most conventional method to detect open cracks [1], cannot
methods like ultrasonically stimulated thermography, eddy current stimulated thermography or laser
thermographic imaging [2-5]. But these techniques, which are based on the analysis of the generated
local rise of the crack temperature, need calibration procedures, a reference response and/or blackened
sample to evaluate the crack depth [6-16].
Lock-in thermography uses lateral thermal flows in order to detect vertical cracks [12-15]. The
amplitude and phase of infrared images obtained by the diffusion of lateral thermal flows provide
information concerning defects with a good contrast for vertical cracks. Reference [17] proposes an
analytical solution of the temperature distribution to deduce the crack width for infinite vertical cracks.
In this work a lock-in thermography procedure is used for depth evaluation of surface-breaking cracks
in metals without surface preparation and with no calibration procedure. The implementation of the
approach is described in [18-21]: taking advantage of the thermal diffusion length to probe different
regions of the sample, the analyse of the amplitude images at the modulation frequency allows to
provide crack depth determination but this requires abacus or back simulations to obtain quantitative
information. The improvement provided by this work is to process the phase images in addition to the
amplitude images to directly allow the determination of depth indicators, avoiding thus the calibration
abacus used up to now.
In the first part of this article, the study is led from results of 3D FEM numerical simulations to
introduce two depth indicators (A and ) which rely on the evolution of the second spatial derivative
of both amplitude and phase images as a function of the thermal diffusion length.
In the second part of this article, experimental results obtained on constant controlled "cracks" in steel
and aluminum blocks are analyzed and a global depth indicator Ih calculated from A and is
2. Multi-frequency lock-in infrared thermography method 2.1. Principle of the method
The presented method uses a modulated heat excitation associated with lock-in thermography. When a
modulated circular laser spot excitation heats the sample surface, the 3D heat transfer equation in
solids in the absence of internal heat generation can be used to evaluate the temperature distribution in
the whole solid [22]. The lock-in processing of the signals allows a retrieval of both amplitude and
phase of the sinusoidal infrared radiation component from the surface sample at the heating
fundamental frequency. The unwanted continuous heating (DC) component is thus filtered out.
The second spatial derivatives (Laplacian) of both amplitude and phase images highlight the thermal
disturbance caused by the presence of a vertical crack. Crack pixels are extracted from the Laplacian
of the amplitude image according to the numerical procedure presented in [23].
In a modulated heating process, the thermal diffusion length, which can be written as
f
(1)
where is the thermal diffusivity of the specimen, can be adjusted by the modulation frequency f of the thermal excitation source and used as a 3D probe of the crack depth h. The crack signature is
analyzed via the changes of the Laplacian of the amplitude and phase images as a function of the
thermal diffusion length .
The absolute value of the Laplacian of the amplitude image normalized by its asymptotic value is
denoted
Λ
Nand the value of the Laplacien of the phase image is denotedΛ
. In [18,19], it is shown thatΛ
N
μ
at the crack pixels reach their maximal value at a thermal diffusion length increasing withh and that the evolution of
Λ
N
μ
is independent of the crack width. So the evolution ofΛ
N with is then an indicator of the crack depth. In [19], simulatedΛ
N
μ
for various excitation frequencies are used as an abacus to deduce the depth of real cracks. However, these simulations are timemore quickly, the results do not depend on modeling accuracies. It is thus a great interest to have a
direct indicator, independent of the material and its surface condition, to estimate the crack depth.
2.2. Simulated experiments
The objective of this work is to combine the analysis of
Λ
N
μ
andΛ
μ
of crack responses to easily deduce quantitative indicators of the crack depth without any simulation abacus.The heat source is focused onto the surface in a circular and uniform spot of radius r at a distance d0 of
a linear crack perpendicular to the surface of width w, length L and constant depth h. The heat source
is intensity modulated at a frequency f. Amplitude and phase images of the modulated surface
temperature at the frequency f are calculated for different h values by 3D FEM numerical simulations.
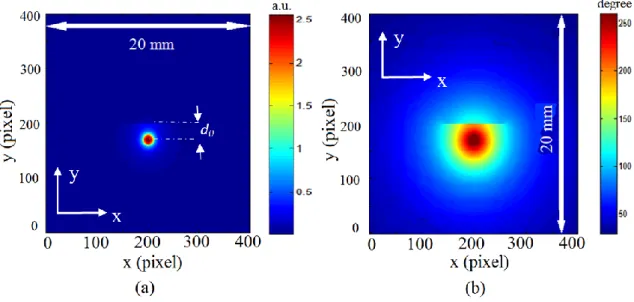
Figure 1 shows an example of amplitude (Figure 1a) and phase (Figure 1b) images of 400*400 pixels
(1 pixel sees 50m*50m) obtained at f = 0.8 Hz. The linear crack footprint is clearly visible in the figures above the heat source. A set of pixels P(x,y) located on the crack which faces the heating zone
are extracted from the Laplacian of the amplitude image with a basic numerical processing described
in [23] (Figure 2a). Figure 2b shows the Laplacian of the phase for these P(x,y) pixels at f=0.8 Hz .
The distance between a pixel P(x,y) and the center of the heating spot is denoted as d(x,y).
2.2.1 One point analysis
The evolution of the Laplacian of the amplitude ΛNas a function of the thermal diffusion length at the closest pixel P to the heating spot (d(x,y)=d0) is reported in Figure 3. Simulation results are presented
for four depths h as a function of i=
f
i for a frequency ranging from 0.05 Hz to 1.5 Hz.The polynomial fits fh
μ of ΛN
i show a shift along the axis which depends on the simulateddepth h. Afterward in this work, the value of A corresponding to fh
μA 0.7 is then considered as a first indicator for the crack depth evaluation.The evolution of the absolute value of the Laplacian of the phase images at the same pixel P can also
which is of the order of the crack depth. is thus retained as a second indicator for the crack depth evaluation.
Figure 5 shows that the indicator deduced from the simulations seems to be more dependant on the crack depth h than the indicator A.
2.2.2. Synthesis of crack point analysis
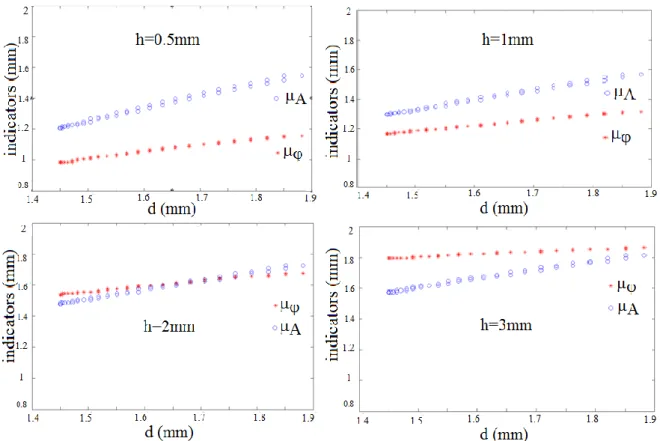
Let's consider the responses of 50 selected pixels on the crack at f = 1.5 Hz. Figure 6 displays A and
as a function of the distance d between a selected pixel and the center of the heating spot for the four simulated depths h.
One notices in Figure 6 that A is more d dependant than. Therefore a combination of A and is proposed to minimize the influence of d and thus directly estimate the local depth for each selected
pixels.
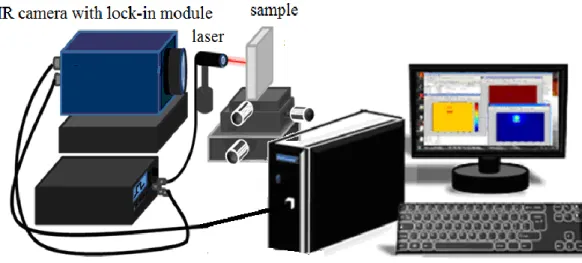
3. Experimental results for the evaluation of the depth 3.1 Experimental set-up and methodology
The experimental set up (Figure 7) includes a heat source (a diode-pumped Ytterbium laser with
830 nm wavelength and tuneable power), a signal generator which modulates the intensity of the heat
source at frequency f, and an infrared camera (Jade III, CEDIP, FLIR). The camera has an array
(240*320 pixels) of InSb detectors sensitive in the 3-5 µm wavelength range.
The laser beam is focused onto the surface in the vicinity of the crack in an approximately uniform and
circular spot of 1 mm diameter. No surface preparation is required for the studied samples. The laser
power is adjusted to the thermal response of the samples.
The generated infrared signals measured by the camera and the reference frequency f are sent to a
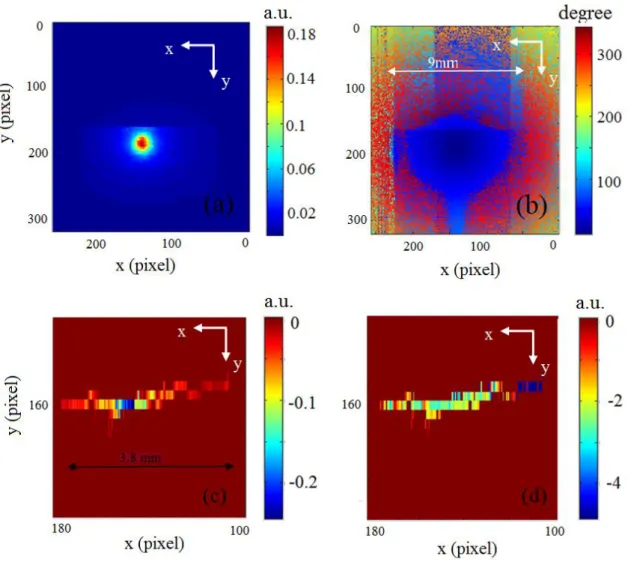
emission induced at the surface of the inspected sample is then extracted with a fairly good contrast
(Figure 8a and Figure 8b).
The Laplacian of amplitude and phase images (Figure 8c and 8d) are proceeded according to the
procedure described in the former section to calculate A and from the polynomial fits of
) (
N
Λ and Λ()(Figure 9). Notice that local diffusivity of each sample can be directly extracted from measurements [24], in a homogeneous area sufficiently far away from the crack.
3.2 Experimental measurements with controlled artificial cracks
Artificial cracks with controlled dimensions are good samples to validate experimentally the simulated
results presented in section 2.
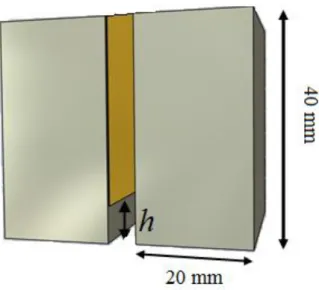
Two 40*40*20 mm3 steel and aluminum alloy plates separated by a brass sheet of 30 m thickness are assembled with screws to simulate a sample with a vertical open crack (Figure 10). In the presented
results, the brass sheet was cut in z direction so as to leave an air gap of controlled constant depth
between two steel plates (Samples F, thermal diffusivity equal to 3.7±0.2 10-6 m2/s) or two aluminum alloy blocks (sample G, thermal diffusivity equal to 40±2 10-6 m2/s) as described in Table 1. The laser power is 4 W .
Figure 11 shows A andas a function of the distance d obtained for the four studied samples. One can observe that A and follow the same trends as simulation results (Figure 6) : A and are both dependant on h and is less d dependant than A but is noisier than A in the presented
experimental results.
3.3 Global depth indicator
In order to minimize the dependence on d of µA and µ and to give an enhanced robustness to the
depth assessment at each selected pixel, a new depth indicator Ih depending on µA, µ and d is defined
as: ) , ( * ) , ( * ) , ( ) , ( y x d a y x y x y x Ih A (2)
where a is an adjustment parameter. For depth range from 0.5 mm to 3 mm and for the experimental
conditions, a=2 is well adapted as shown hereafter.
Figure 12 shows the depth indicator Ih obtained with the presented multi-frequency lock-in
thermography method using (2) with a=2 for the four samples. The results are presented in x,y plane
with the same color scale to give a comparative and visual indication of the depth for each selected
pixels of the 4 cracks. The experimental results seem coherent with the expected h values.
Figure 13 displays the average value over the selected pixels P(x,y) of (x,y), (x,y) and Ih(x,y), respectively denoted as ~A,
~ and
h
I
~ obtained for the four samples as a function of expected depths.
Linear regressions through the origin are calculated for the three indicators. The R-squared coefficient
R2 which represents the correlation between the predictive value and the average of the indicators
show that I~h indicator is the better indicator (R2 near 1). The negative R2 coefficient obtained for ~A
is nonsense and indicates that the linear fitting through the origin is not appropriate. As A and are correlated measurements, the error bars of the I~h indicators are smaller than the error bars of ~A and
~ indicators. One can see that the indicator I~h is comparable to the expected depth h, though a bias
exists for small depths.
The results validate the method to evaluate constant crack depths within the tested depth range from
0.7 to 2.5 mm.
3.4 Inconel samples with real fatigue cracks
Five open vertical fatigue cracks of 35 to 65 m widths in a highly reflecting 130*27*9 mm3
Inconel
plates (samples A, B, C, D, E) are opened over the entire width of the samples. Depths are measured
on the 2 lateral sides of the sample using optical microscopy [18] (Table 2). The measured thermal
diffusivity of the Inconel sample is equal to 3.3±0.1 10-6m2/s. The laser power is 2 W.
Figure 15 presents the averaged indicators ~A , ~ and h I ~
calculated from selected pixels of the crack
as a function of expected averaged depth h. Linear regressions through the origin are calculated for the three indicators. The R-squared coefficient R2 is nearer to 1 for
~ than for
h
I
~ and has no sense for
A
~ . If the result obtained for sample E (h>3mm) is ignored, the linear regression for
h
I
~
gives comparable results to those obtained for steel and aluminum samples (figure 13): R2 = 0.92 and y= 0.92 x.
Consequently, I~h seems to be a good direct indicator of the depth h at least for h lesser than 3 mm.
Although it seems that the sensitivity of the measurement reaches its limit for Sample E, the proposed
multi-frequency lock-in thermography approach appear to be promising to locally probe local crack
depth without sample modelling .
Conclusion
In this work, the multi-frequency lock-in infrared thermography method is used to evaluate perpendicular crack depths. A specific empirical data analysis is presented using the experimental curves of the spatial second derivative (Laplacian) of both amplitude and phase infrared images as a function of the thermal diffusion length. Two direct depth indicators A and are introduced and their evolution as a function of the crack depth h and the distance d of the crack to the heating spot are analyzed. A combination of A, and d is used to make a depth indictor Ih independent of distance d. It can be seen as a compromise which enhances the robustness of the depth evaluation.
Measurements were carried out on Inconel alloy samples with calibrated 0.5 mm to 3.5 mm crack depths. The measurement duration depends on the number of used frequencies. Typically for metals, one can consider 5 different frequencies between 0.05 Hz and 1.5 Hz which lead to 10 minutes measurement duration. The distance of heat source to the inspected crack and the frequencies selected to probe the volume of the sample must be thoroughly chosen so that the sensibility is optimal. This distance depends on the thermal diffusivity of the sample. The depth range for the studied material is from about 0.5 to 3 mm.
Acknowledgments
The authors would like to thank Areva Intercontrole for providing Inconel samples with various calibrated fatigue cracks
References
[1] L. Cartz. Nondestructive Testing, ASM International, Materials Park, Ohio 1995.
[2] D.P. Almond, B. Weekes, T. Li, S.G. Pickering, E. Kostson, J. Wilson, G. Y. Tian, S. Dixon, S. Burrows, Thermographic techniques for the detection of cracks in metallic components. Insight - Non-Destructive Testing and Condition Monitoring, Vol 53, Number 11, November 2011, pp. 614-620 (7)
[3] J.-C . Krapez, L. Legrandjacques, F. Lepoutre, D. Balageas, optimization of the photothermal camera of crack detection , QIRT 1998 Archives: Documents and sessions presented during the 4th conference on QIRT (Lodz, Poland), 1998
[4] B. A. Auld and J. C. Moulder, Review of Advances in Quantitative Eddy Current Nondestructive Evaluation, Journal of Nondestructive Evaluation, Vol. 18, No. 1, 1999 [5] A. Dillenz, T. Zweschper, G. Riegert, G. Busse, “Progress in phase angle thermography”. Rev.
of Sci. Instrum vol. 74, pp. 417-419, 2003.
[6] M. Morbidini, P. Cawley, A calibration procedure for sonic infrared nondestructive evaluation. Journal of Applied Physics 106, 023504, 2009
doi: 10.1063/1.3169518
[7] B. Weekes , D. P.Almond, P. Cawley, Tim Barden, Eddy-current induced thermography— probability of detection study of small fatigue cracks insteel,titanium and nickel-based super alloy, NDT&E Int. 49 47–56, 2012
[8] J. Schlichting, Ch. Maierhofer and M. Kreutzbruck, Crack sizing by laser excited thermography, NDT&E Int. 45, 133-140, 2012
[9] T. Li, D. P. Almond, Rees S., crack imaging by scanning pulsed laser spot thermography, NDTE Int 44(2), 216-25, 2011
[10] O. Wysocka-Fotek, W. Oliferuk, M. Maj, Reconstruction of size and depth of simulated defects in austenitic steel plate using pulsed infrared thermography, Infrared Physics & Technology 55 363–367, 2012
[11] S. Lugin, Detection of hidden defects by lateral thermal flows. NDT&E Int. Vol 56 pp: 48-55, 2013
[12] T. Sakagami, S. Kubo, Y. Teshima, 'Fatigue crack identification using near-tip singular temperature field measured by lock-in thermography', SPIE Proceedings Series, 4020, pp. 174– 181, 2000
[13] C. Wallbrink, S. A. Wade, and R. Jones, “The effect of size on the quantitative estimation of defect depth in steel structures using lock-in thermography” J. Appl. Phys. 101, 104907 , 2007 [14] M. Choi, K. Kang, J. Park, W. Kim, K. Kim, Quantitative determination of a subsurface defect
of reference specimen by lock-in infrared thermography, NDT&E Int., 41, p. 119–124, 2008 [15] D. Peng , R. Jones, Lock-in thermographic inspection of squats on rail steel head
Infrared Physics & Technology 57 89–95, 2013
[16] A Mendioroz, A Castelo, R Celorrio, A Salazar, Characterization of vertical buried defects using lock-in vibrothermography:I. Direct problem, Meas. Sci. Technol. 24 065601 (11pp), 2013
[17] N. W. Pech-May, A. Oleaga, A. Mendioroz, A. J. Omella, R. Celorrio, A. Salazar, Vertical cracks characterization using lock-in thermography: I infinite cracks, Meas. Sci. Technol. 25, 115601 (10pp), 2014
[18] M. Streza, Y. Fedala, J.-P. Roger, G. Tessier, C. Boué, Heat transfer modeling for surface crack depth evaluation, Meas. Sci. Technol. 24, 045602 (6pp), 2013
[19] Y. Fedala, M. Streza, J.-P. Roger, G. Tessier, C. Boué, Open cracks depth sizing by laser stimulated Infrared lock-in thermography, J. Phys. D: Appl. Phys. 47, 465501 (6pp), 2014 [20] C. Boué, G. Tessier, J.-P. Roger, M. Streza, Procédé d’évaluation de la profondeur d’une
fissure French Patent Application n° 12 58940, PCT/FR2013/052185, CNRS – UPMC, 2013 [21] C. Boué, G. Tessier, J.-P. Roger, M. Streza, Method for assessing the depth of a crack, US
Patent, publication number 2015-0241212, 2015
[22] H.S. Carslaw, J.C. Jaeger, Conduction of Heat in Solids, 2nd ed, Oxford Press, 1959. p.16 [23] Y. Fedala, M. Streza, F. Sepulveda, J.-P. Roger, G. Tessier, C. Boué, Infrared lock-in
thermography crack localization on metallic surfaces for industrial diagnosis, Journal of Non Destructive Evaluation, DOI 10.1007/s10921-013-0218-4, 2013
[24] C. Boué , S. Holé, Infrared thermography protocol for simple measurements of thermal diffusivity and conductivity, Infrared Phys. Tech. 55 376-79, 2012
Steve Beuve and Zihi Qin were students of sensors, instrumentation & mesurements master at Pierre & Marie Curie University, Paris, France.
Z. Qin
Christine Boué received her Ph.D. degree in electrical engineering in 1991 from the University Pierre et Marie Curie in association with the Ecole Supérieure de Physique et de Chimie Industrielles, Paris France. During her Ph.D. thesis, she studied the distribution of space charges in piezoelectric polymers. She is currently an Associate Professor at Sorbonne Universités-UPMC (France) since 1992 where she teaches electronics, microcontroller interfacing, signal processing. Her research topics concern thermal imaging and non-destructive testing by synchronous infrared thermography. e-mail: [email protected]
Stéphane Holé joined Laboratoire d'Électricité Générale of École Supérieure de Physique et de Chimie Industrielles (Paris, France) to study an instrument for measuring fast development of space charges in insulators under rapid voltage variations. It was the topic of his PhD he received in 1996. Currently Professor at Université Pierre et Marie Curie, he leads the Instrumentation Group in Laboratoire de Physique et d'Étude des Materiaux since 2007. His research topics are various such as space charge in insulators and semiconductors (main topic), electrostatic, magnetostatic and ultrasonc sensors. He received the Jack Hollingum Award in 2002 and 2004, and obtained his Habilitation in 2007. He teaches solid state physics, electronics and sensor physics. He is coordinator of the sensors, instrumentation & mesurements master at Pierre & Marie Curie University since 2009.
e-mail: [email protected]
Jean Paul Roger is associate professor at the Langevin Institute, ESPCI ParisTech (France). He received the PhD degree in physical sciences from Pierre and Marie Curie University in 1988. His main research fields are: thermal characterization of materials, thin films and structures using optically based photothermal techniques (mirage detection, photoreflectance microscopy, dynamic ellipsometry), and development of interferometric, reflectance and ellipsometric microscopy imaging techniques to measure the displacement fields of actuated micromechanical systems and/or to map films growth.
e-mail: [email protected]
Figure 1: (a) amplitude image, (b) phase image.
Simulation parameters are w = 30 m, h = 1 mm, L = 6 mm, r = 0.5 mm, d0 = 1.5 mm, = 3.3 10-6 m2/s,
Figure 2: Pixels P(x,y) extracted from the Laplacian of Figure 1 images (f = 0.8 Hz), (a) Laplacian of the amplitude. (b) Laplacian of the phase. a.u.: arbitrary unit.
Figure 3: SimulatedΛN
i and polynomial fit fh
μ at the pixel P (d(x,y)=d0) for different depth h. Simulation parameters are r = 0.5 mm, = 3.3 10-6 m2/s, dFigure 4: simulated Λ i and polynomial fits at the pixel P (d(x,y)=d0) for different depths h. Simulation parameters are r = 1 mm, = 3.310-6 m2/s, d
Figure 8: example of a fatigue crack. (a) Amplitude image, (b) Phase image, (c) Laplacian of the amplitude of the selected P(x,y) pixels calculated using Figure 8a, (d) Laplacian of the phase for the selected pixels calculated using Figure 8b. f = 0.05 Hz, 1 pixel corresponds to 50 m*50 m. a.u.: arbitrary unit.
Figure 9: (a) Experimental ΛNand Λ and polynomial fits as a function of for the selected pixels in the sample of figure 8. (b) Deduced A and for the selected pixels along the x direction.
Figure 10: simulation of a controlled depth crack in a steel or aluminum alloy sample. The brass sheet exhibits a constant h cut.
Figure 12: Ih for the selected pixels in x,y plane. 1 pixel represents 80 m*80 m, a
The color indicates (negative) Ih evaluation of each selected pixels. (a) Steel sample F1, expected depth around 0.7 mm, (b) Aluminum alloy sample G, expected depth around 1 mm, (c) Steel sample F2, expected depth around 1.5 mm, (d) steel sample F3, expected depth around 2.5 mm.
Figure 13: ~A, ~ indicators (left) and
h I
~
indicator (right) as a function of expected h values obtained on the
steel and aluminum alloy samples. Estimate slope of linear regression through the origin and R-squared coefficient R2 are added for each indicators.
Figure 14: Ih for the selected pixels as a function of pixel location in (x,y) plane,
1 pixel represents 50 m*50 m. (a) Inconel sample A, expected depth around 0.4 mm, (b) Inconel sample B, expected depth around 1.6 mm, (c) Inconel sample D, expected depth around 2.1 mm, (d) Inconel sample E, expected depth around 3.2 mm.
Figure 15: ~ , A ~ indicators (left) and I~h indicator (right) as a function of expected h values obtained on the
Inconel alloy samples. Estimate slope of linear regression through the origin and R-squared coefficient R2 are
Table 1: crack sizes of steel and aluminum alloy samples
Controlled depth h (mm) crack width (m) measured by optical microscopy
F1 - steel 0.7±0.1 30± 5
G - aluminum alloy 1±0.1 30± 5
F2 - steel 1.5±0.1 30± 5
Table 2: crack sizes of Inconel alloy samples Inconel Depth (mm) on the two lateral
sides of the sample
averaged depth (mm) deduced from the values of the first columns
crack width (m) Sample A 0.2±0.1 0.6±0.1 0.4 20± 10 Sample B 1±0.1 2.1±0.1 1.6 40± 10 Sample C 1.1±0.1 3.1±0.1 2.1 35± 5 Sample D 1.7±0.1 2.4±0.1 2.1 65± 5 Sample E 2.8±0.1 3.6±0.1 3.2 45± 5