Supplemental material
Kvainickas et al.,
https://doi.org/10.1083/jcb.201812110
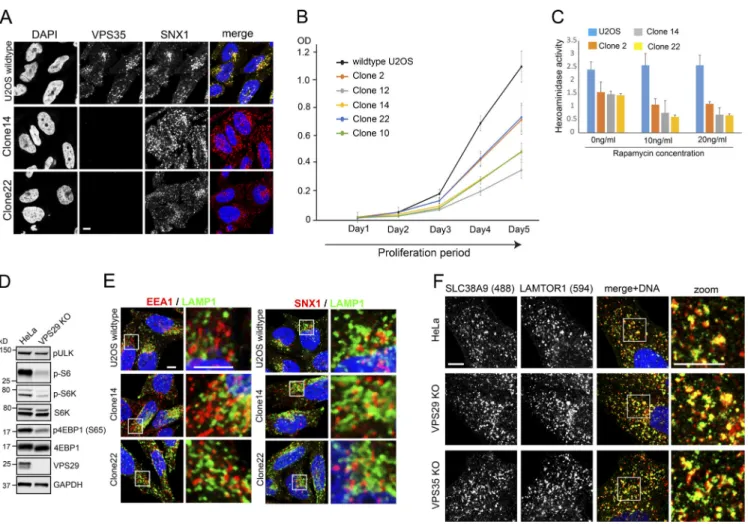
Figure S1. Retromer-deficient cell lines display changes in TFEB but not in TSC2 or SLC38A9 localization. (A) Parental U2OS and two TALEN-generated clonal VPS35 KO cell lines were fixed and stained for endogenous VPS35 (Alexa Fluor 488, green) and the retromer-associated protein SNX1 (Alexa Fluor 594, red) and DNA (DAPI, blue). Note that SNX1 is retained on endosomes, whereas VPS35 is lost from the KO cells. (B) Five clonal U2OS VPS35 KO cell lines and parental U2OS were tested for their proliferation rates with a colorimetric hexosaminidase assay over 5 d. The quantification stems from four technical replicates. (C) Parental U2OS and three VPS35 KO clonal lines were treated with low concentrations of the mTORC1 inhibitor rapamycin and tested for their proliferation rates over 72 h. The bars represent the final amount of cells after 72 h of rapamycin treatment as tested by hexosaminidase activity in lysed monolayers. The quantification was done over five technical replicates. (D) Parental and VPS29 KO cells generated with CRISPR/Cas9 were lysed and the phosphorylation of the indicated mTORC1 substrates was analyzed by Western blotting. (E) Parental U2OS cells and two clonal VPS35 KO cell lines were fixed and stained for the early endosome marker EEA1 (Alexa Fluor 594, red, left panel) or SNX1 (Alexa Fluor 594, red, right panel) and the late endocytic marker LAMP1 (Alexa Fluor 488, green, both panels). (F) FLAG SLC38A9 (Alexa Fluor 488, green) was transduced into parental and retromer-deficient HeLa cells and costained with the endogenous ragulator component LAMTOR1 (Alexa Fluor 594, red). Scale bars represent 5 µm. Error bars = SD.
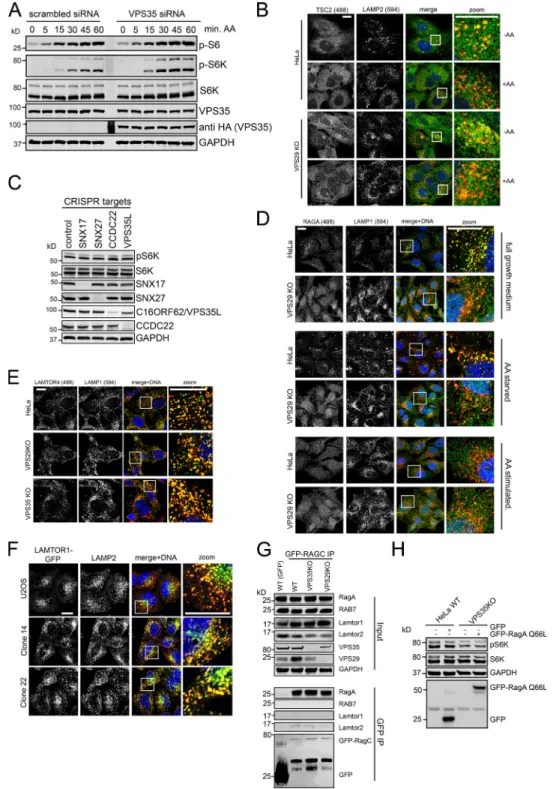
Figure S2. Analysis of growth factor and amino acid signaling in retromer-deficient cells. (A and B) U2OS cells were treated with siRNA against VPS35, starved in serum-free medium overnight and stimulated with dialyzed FBS (10%) for the indicated time points. mTORC1 substrate phosphorylation was assessed by Western blotting and quantified across three independent experiments. (C) Parental and VPS29 KO HeLa cells were starved in serum-free DMEM overnight and stimulated with 100 ng/ml EGF for the indicated time points. mTORC1 substrate phosphorylation was assessed by Western blotting. (D) U2OS cells were treated with VPS35-specific siRNA, starved in EBSS for 3 h and stimulated with amino acids (serum-free DMEM) for the indicated times. mTORC1 substrate phosphorylation was quantified by Western blotting across three independent experiments. (E) U2OS cells were treated with siRNA against VPS35, starved in EBSS for 3 h, and stimulated with amino acids for 45 min. The cells were then fixed and stained for endogenous mTOR (Alexa Fluor 488, green) and LAMP2 (Alexa Fluor 594, red). Scale bars represent 10 µm. Error bars = SD.
Figure S3. Additional data on amino acid signaling in retromer-deficient cells. (A) U2OS cells expressing siRNA-resistant HA-VPS35 were transfected with siRNA against VPS35, starved in EBSS, and stimulated with amino acids. mTORC1 substrate phosphorylation was assessed by Western blotting. (B) Parental and VPS29 KO HeLa cells were starved in amino acid–free DMEM for 3 h and stimulated with amino acids for 45 min as indicated. The cells were then fixed and stained for endogenous TCS2 (Alexa Fluor 488, green) and LAMP2 (Alexa Fluor 594, red). (C) HeLa cells were transfected with Cas9 and pools of three mixed gRNAs against the indicated genes. 6 d after transfection, cells were starved in serum- and amino acid–free DMEM for 3 h and stimulated with amino acids for 45 min. mTORC1 substrate phosphorylation and KO efficiencies were determined by Western blotting. (D) Parental and VPS29 KO HeLa cells were kept in full-growth medium, starved in amino acid–free DMEM, or starved and stimulated with amino acids for 45 min. The localization of endogenous RAGA (Alexa Fluor 488, green) relative to LAMP1 (Alexa Fluor 594, red) was analyzed through immunostaining. (E) Parental and retromer-deficient HeLa cells were costained for the endogenous ragulator component LAMTOR4 (Alexa Fluor 488, green) and LAMP1 (Alexa Fluor 594, red). (F) Parental and retromer-deficient HeLa cells were infected with a lentivirus encoding LAMTOR1-GFP. The cells were then fixed in PFA and costained for endogenous LAMP2 (Alexa Fluor 594, red). (G) Parental and retromer-deficient HeLa cells were infected with a lentivirus encoding GFP-RAGC. GFP-RAGC was then precipitated from the cells and precipitates were analyzed for the presence of endogenous RAGA. (H) Parental and VPS29 KO HeLa cells were transduced with a lentivirus encoding myc-tagged RAGA-Q66L as indicated. The cells were then starved in amino acid–free DMEM and stimulated with amino acids for 45 min. Scale bars represent 10 µm.
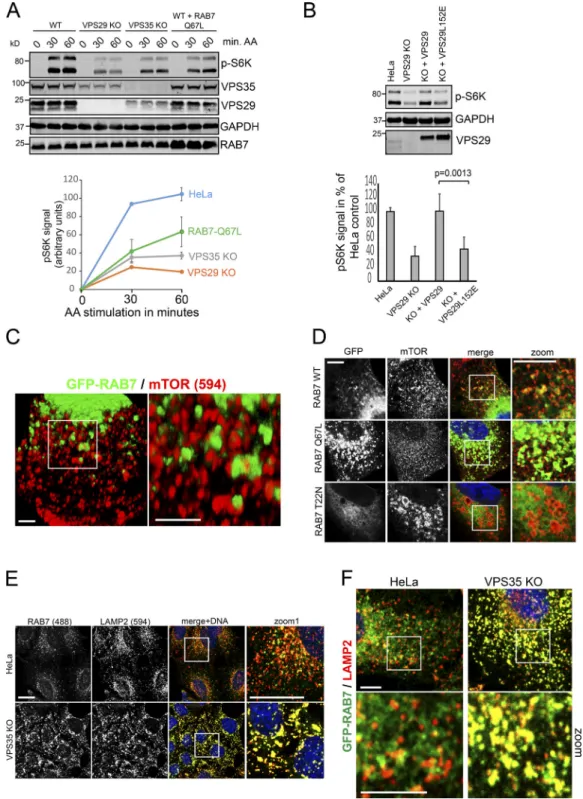
Figure S4. Hyperactivated RAB7a antagonizes lysosomal mTORC1 recruitment and signaling. (A) Parental HeLa cells, VPS29 and VPS35 KO cells, as well as HeLa cells infected with a lentivirus expressing untagged RAB7-Q67L (constitutively active mutant) at roughly endogenous levels were starved in serum- and amino acid–free DMEM and stimulated over the indicated periods with amino acids (MEM recipe). mTORC1 substrate phosphorylation (pS6K1) was quantified over three independent experiments. Note that RAB7-Q67L suppressed mTORC1 substrate phosphorylation. (B) Clonal VPS29 KO cells were infected with a lentivirus encoding WT and TBC1D5 binding–deficient VPS29-L152E, starved in EBSS, and stimulated with amino acids. mTORC1 substrate phosphorylation was assessed by Western blotting. The quantification was done across three independent experiments. (C) HeLa cells were infected with lentiviruses encoding GFP-RAB7, fixed, and costained for endogenous mTOR (Alexa Fluor 594, red). Scale bar represents 1 µm. (D) HeLa cells were infected with lentiviruses encoding GFP-RAB7 WT, constitutively active GFP-RAB7 (RAB7-Q67L), and dominant-negative GFP-RAB7 (RAB7-T22N). The cells were fixed and costained for endogenous mTOR (Alexa Fluor 594, red). Scale bar represents 5 µm. (E) Parental HeLa and VPS35 KO cells were costained for endogenous RAB7 (Alexa Fluor 488, green) and LAMP2 (Alexa Fluor 594, red), and colocalization was analyzed by confocal microscopy. Scale bar represents 10 µm. (F) GFP-RAB7 was expressed with a lentivirus in parental and VPS35 KO HeLa cells and costained for endogenous LAMP2. Scale bar represents 5 µm. Error bars = SD; P values stem from a two-tailed, unpaired t test between the indicated conditions.
Provided online is one table in Excel. Table S1 lists all gRNA, primer, and RNAi sequences.
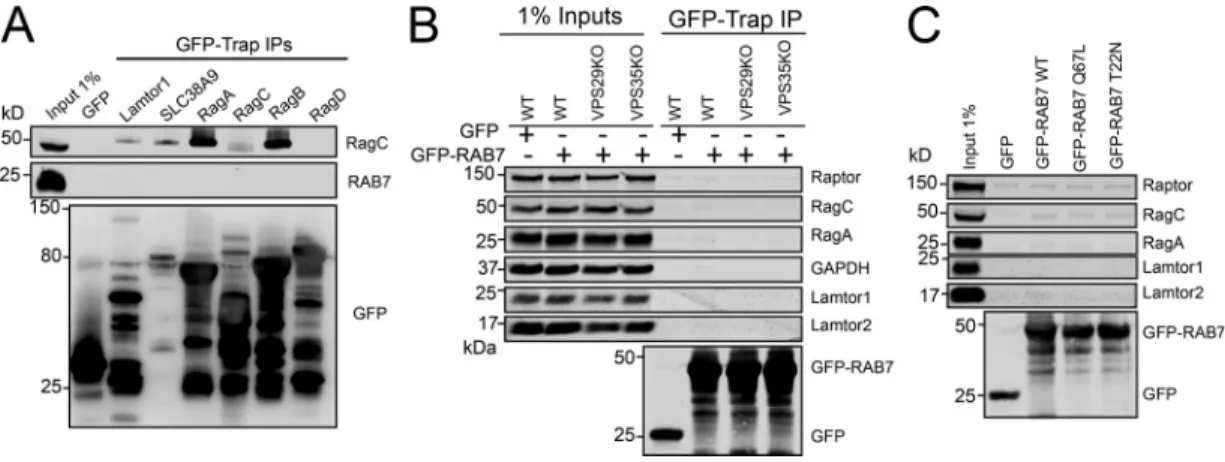
Figure S5. RAB7 does not interact with ragulator, RAGs, or mTORC1. (A) The indicated GFP-tagged proteins were overexpressed in HEK293 cells and precipitated by GFP-Trap. The precipitates were then analyzed for the presence of endogenous RAB7a. (B) Parental and retromer-deficient HeLa cells were infected with a lentivirus encoding GFP-RAB7a. GFP-RAB7a was then precipitated by GFP-Trap, and the precipitates were analyzed for the presence of the indicated RAGs, ragulator, and mTORC1 components. (C) The indicated GFP-RAB7 variants were transiently overexpressed in HEK293 cells and precipitated by GFP-Trap. The precipitates were then analyzed for the presence of the indicated RAGs, ragulator, and mTORC1 components.