HAL Id: hal-00298339
https://hal.archives-ouvertes.fr/hal-00298339
Submitted on 15 Jun 2007
HAL is a multi-disciplinary open access
archive for the deposit and dissemination of
sci-entific research documents, whether they are
pub-lished or not. The documents may come from
teaching and research institutions in France or
abroad, or from public or private research centers.
L’archive ouverte pluridisciplinaire HAL, est
destinée au dépôt et à la diffusion de documents
scientifiques de niveau recherche, publiés ou non,
émanant des établissements d’enseignement et de
recherche français ou étrangers, des laboratoires
publics ou privés.
Unpredictability of internal M2
H. van Haren
To cite this version:
H. van Haren. Unpredictability of internal M2. Ocean Science, European Geosciences Union, 2007, 3
(2), pp.337-344. �hal-00298339�
www.ocean-sci.net/3/337/2007/
© Author(s) 2007. This work is licensed under a Creative Commons License.
Ocean Science
Unpredictability of internal M
2
H. van Haren
Netherlands Institute for Sea Research (NIOZ), P.O. Box 59, 1790 AB Den Burg, The Netherlands Received: 22 February 2007 – Published in Ocean Sci. Discuss.: 20 March 2007
Revised: 22 May 2007 – Accepted: 30 May 2007 – Published: 15 June 2007
Abstract. Current observations from a shelf sea,
continen-tal slopes and the abyssal North-East Atlantic Ocean are all dominated by the semidiurnal lunar (M2) tide. It is shown
that motions at M2vary at usually large barotropic and
coher-ent baroclinic scales, >50 km horizontally and >0.5 H verti-cally. H represents the waterdepth. Such M2-scales are
ob-served even close to topography, the potential source of baro-clinic, “internal” tidal waves. In contrast, incoherent small-scale, ∼10 km horizontally and ∼0.1 H vertically, baroclinic motions are dominated around f, the local inertial frequency, and/or near 2≈S2, the semidiurnal solar tidal frequency.
represents the Earth’s rotational vector. This confirms ear-lier suggestions that small-scale baroclinic M2-motions
gen-erally do not exist in the ocean in any predictable manner, ex-cept in beams very near, <10 km horizontally, to their source. As a result, M2-motions are not directly important for
gen-erating shear and internal wave induced mixing. Indirectly however, they may contribute to ocean mixing if transfer to small-scale motions at f and/or S2and at high internal wave
frequencies can be proven. Also far from topography, small-scale motions are found at either one or both of the latter frequencies. Different suggestions for the scales at these par-ticular frequencies are discussed, ranging from the variability of “background” density gradients and associated divergence and focusing of internal wave rays to the removal of the in-ternal tidal energy by non-linear interactions. Near f and S2
particular short-wave inertio-gravity wave bounds are found in the limits of strong and very weak stratification, which are often observed in small-scale layers.
1 Introduction
In many parts of the ocean the semidiurnal tidal frequency band contains most energetic motions (e.g., Fig. 1). These energetic motions reside at a few deterministic, highly pre-dictable frequencies. Exceptions of weak tidal currents are Correspondence to: H. van Haren
for example found in some parts of the western North-Atlantic Ocean (Wunsch, 1975; Fig. 1) and in nearly the en-tire Mediterranean Sea (Perkins, 1972).
Recent studies on tidal motions focus on the dissipation of lunar (M) gravitational energy by the world’s tides and on their importance for the large-scale meridional overturn-ing in the ocean (Munk and Wunsch, 1998). Observational evidence (Polzin et al., 1997; Ledwell et al., 2000; Egbert and Ray, 2000) suggests that dissipation of tidal energy is to be found not only in shelf seas, but especially also, about 1/3 of the total tidal energy dissipation, in the ocean basins through “internal” waves breaking, e.g., above sloping to-pography. Surface “barotropic” tidal energy is transferred to internal “baroclinic” wave motions supported by verti-cal density stratification after interaction with large-sverti-cale to-pography (e.g., Baines, 1982). This implies a scale transfer from the large barotropic scales, >O(100 km) horizontally and O(H) the water depth vertically, to the small baroclinic scales, O(1–100 km) horizontally and <O(0.1H) vertically (Wunsch, 1975; Garrett and St. Laurent, 2002).
However, it is suggested that not very far from their to-pographic source, after O(100 km) into the ocean interior, nearly all small-scale baroclinic motions are dissipated. Only the largest, O(100 km) horizontally and O(0.5H) vertically, baroclinic scales remain (e.g., St. Laurent and Garrett, 2002; Rainville and Pinkel, 2006). The latter seems not in agree-ment with the notion that internal tides are highly intermit-tent in time. Intermittency implies a rather broadband spec-tral appearance, in stark contrast with the highly determinis-tic, narrowband or sharply “peaking”, surface tides (Wunsch, 1975; van Haren, 2004). Furthermore, it seems at odds with the idea that internal tides are relevant for deep-ocean mix-ing: at such large vertical scales O(0.5H) shear and associ-ated diapycnal mixing cannot be important. However, deep open-ocean mixing is evidenced in microstructure observa-tions (e.g., Polzin et al., 1997; Walter et al., 2005). Indirectly, energy transfer to small scales of high-frequency “solitary” waves every tidal cycle (Gerkema, 2001) may lead to local-ized mixing.
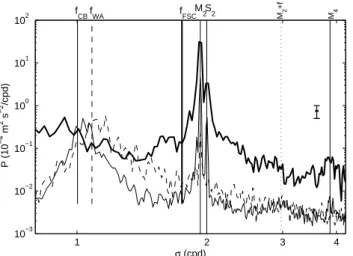
338 H. van Haren: Unpredictability of internal M2 1 2 3 4 10−3 10−2 10−1 100 101 102 P (10 −4 m 2 s −2 /cpd) σ (cpd) M2S2 M4 M2 +f f FSC f CBfWA van Haren
Fig. 1. Moderately smoothed kinetic energy spectra from 140 days of near-bottom (8 m) Aanderaa RCM-8 current meter data in
the Faeroe-Shetland Channel (FSC; thick line) at 61◦N, –3.3◦W,
H=1040 m. For reference, spectra are given from yearlong cur-rent meter data in the Canary Basin (CB; thin solid line; moder-ately energetic but peaked at semidiurnal constituents) and West-ern Atlantic Ocean (WA; thin dashed line; smooth spectrum, weak tides), respectively. Both data sets are from open ocean basins,
at z=−3000 m (H≈5200 m) and near latitude ϕ=30◦N. Aanderaa
RCM-5 data are measured at 32.7◦N, –70.8◦W in 1982, whilst
Aanderaa RCM-11 data are obtained at 30.00◦N, –23.1◦W in
2005. The vertical bar indicates the 95% confidence limits. The middle horizontal bar indicates the effective fundamental band-width, at tidal frequencies.
In this paper, I elaborate on the discrepancy between sur-face and internal, or more precisely large and small-scale, co-herent and incoco-herent, tidal motions from observations. As will be demonstrated, these observations especially show a lack of distinct small-scale semidiurnal lunar (M2) energy.
Observations are from different sites (Fig. 2), ranging from the shallow central North Sea, via the smooth slopes of the moderately deep, very energetic Faeroe-Shetland Channel to the rough slopes and the abyssal plain in the Bay of Biscay. At all sites, M2dominates the total kinetic energy. First,
his-toric observations are discussed in Sect. 2, which show ear-lier evidence or lack of internal small-scale M2. In Sects. 3
and 4, sites, data and their handling, including the split be-tween surface and internal tidal motions, are discussed. In Sect. 5 observations are presented. Interpretation and impli-cations are discussed in Sect. 6.
2 Historic observations revisited
In the summer-stratified central North Sea where H=45 m, the spatial structure of M2and other tidal currents is largely
due to barotropic flows, modified by varying eddy viscosity. It is not due to internal waves despite the strong stratification (van Haren and Maas, 1987; Howarth, 1998). This lack of
N W E 45° 45° 50° 50° 55° 55° 60° 60° -15° -15° -10° -10° -5° -5° 0° 0° 5° 5° 10° 10° INP PROCS BBB 100 m 100 0 m 100 m 50 m 100 0 m 40 00 m
Fig. 2. North-east Atlantic Ocean and north-west European shelf
with sites of current meter mooring arrays from projects: PRO-cesses at a Continental Slope (PROCS), Integrated North Sea Pro-gram (INP) and Bay of Biscay Boundary layers (BBB).
internal tides is reflected in the relatively weak tidal vertical shear S=(∂u/∂z, ∂v/∂z), for horizontal current components (u, v), which is negligible in the strong stratification closest to the surface. Instead, apparent dominant baroclinic mode-1 motions are found at the local inertial frequency f, exhibit-ing large |S| across large near-surface stratification (Fig. 3). Note that these inertial motions too are basically barotropic motions governed by viscosity and a lateral boundary condi-tion (Millot and Cr´epon, 1981). The observed spectral en-hancement at the frequency M2+f suggests a coupling
be-tween the viscosity modified barotropic tidal motions and the geostrophically adjusted, presumably atmospherically in-duced, inertial motions (van Haren et al., 1999).
A lack of small-scale baroclinic tidal motions is not re-stricted to shelf seas like the North Sea. Sherwin (1991) suggests that internal waves in the Faeroe-Shetland Chan-nel (H≈1000 m) are largely neglected, ever since 1932 when “Helland-Hansen suggested that, although the Wyville-Thomson ridge could generate an internal tide, most of the observed (tidal) variation further down the channel was due to tidal advection”. Helland-Hansen (1932) concluded this following careful tidal analysis of temperature data observed
during one of the first deep-sea process studies, early in the twentieth century. Helland-Hansen’s three observational sites were at the 500 m isobath on both sides of the Faeroe-Shetland Channel. Recent observations, only ∼20 km away from one of these sites on the Shetland side of the Channel, show that semidiurnal tidal motions are strongly affected by 3–4 days periodic sub-inertial variations in the density and current vorticity field (Hosegood and van Haren, 2006).
On larger ocean scales, Gould and McKee (1973) pre-sented remarkable observations on a disparity between M2
and semidiurnal solar tidal (S2) motions above the
continen-tal slope in the Bay of Biscay (H≤4000 m). The top of this slope is considered one the world’s major sources for in-ternal tides. Using vertical modal decomposition of three-weeks current observations, they showed that kinetic energy at M2was fractionally distributed as (0.55, 0.15, 0.15, 0.15)
over modes (0, 1, 2, 3), respectively. Thus, most energy at M2 was found in barotropic mode 0, rather than in
baro-clinic modes 1–3 (Gould and McKee did not resolve higher modes). In contrast, equally energetic S2was distributed as
(0.1, 0.7, 0.1, 0.1), with most energy in the first baroclinic mode. Gould and McKee (1973) suggested that the observed difference between M2 and S2 resulted from local
topog-raphy and its effects on wave propagation of the two tidal components. Although such difference in baroclinic tidal constituents observations is understandable even near their source, because of the dispersion of internal waves at differ-ent frequencies, the favouring of relatively smaller, albeit still fairly large, scales at S2is not well understood.
Apparent disparity between scales of motions at M2 and
[f,] S2 is also the subject here. A selection of data from
the above regions will be discussed, focusing on “internal” motions. This requires separation of internal signals from ubiquitous “barotropic” semidiurnal motions. The latter are defined as motions driven by surface pressure gradients due to the tidal potential. Such pressure gradient-induced mo-tions are theoretically characterized by little variation over large spatial scales, O(1000 km) horizontally and >H verti-cally, little Doppler shifted and all energy is found at a sin-gle, sharp harmonic frequency. However, barotropic tidal currents do vary over relatively small spatial scales O(10– 100 km) horizontally, when modified, e.g., by density varia-tions, small-scale topography or bottom friction. Frictional influence may be found over only a relatively small vertical range in the abyssal ocean, but it can cover a substantial part of the water column in shallow seas like the North Sea.
3 Defining baroclinic motions
Formally, barotropic oscillatory current U is defined for each total current component u as,
U (z, t ) = z2 X z1 udz/(z1−z2), (1) 1 2 3 4 5 6 7 8 910 10−3 10−2 10−1 100 101 102 103 P (10 −4 m 2 s −2 /cpd) σ (cpd) M 2S2 2f M 3f 4f 4 M6 M8 M2 +f f
van Haren Fig. 3
Fig. 3. Nearly raw kinetic energy spectra from 8 days of barotropic
currents (shaded), defined according to (1) between 10 and 30 m, and baroclinic currents (2) at z=−16 m in strong stratification (heavy solid line). Data are from upward looking 600 kHz ADCP sampling 1z=0.5 m intervals whilst moored in a frame fixed to the
bottom in the central North Sea (INP) at 54.4◦N, 4.0◦E during
summer.
similar for v, for “suitable” vertical distance 1z=z1–
z2>0.5 H. As is verified, the amplitude and phase of a
par-ticular constituent of U may be equally well, to within 10% relative accuracy, be achieved from harmonic analysis over a suitable length of time t ≫T , the tidal period. We define baroclinic motions as,
u′=u − U. (2)
Thus, barotropic and baroclinic motions are split according to their specific spatial and temporal dimensions, which may be different for different environments. For example, in the central North Sea the vertical extent of ∼0.3–0.4 H of the frictional bottom boundary layer is considered. Above slop-ing bottoms, topographic length scales and variations in strat-ification are considered.
A simpler, somewhat more arbitrary, split is also used here by computing finite spatial current differences. By definition, finite shear S=(1u/1z, 1v/1z) depends on the vertical length scale 1z. Hence, as long as 1z<H shear can be used to discriminate barotropic from baroclinic mo-tions. However, considering either vertical internal wave modes, above a flat bottom, or internal wave rays, as is more appropriate above sloping bottoms, varying vertical length scales will yield different baroclinic motions included in the shear. Likewise, finite horizontal gradients 1u/1x, y and 1v/1x, y will separate baroclinic from barotropic motions when 1x, y<10 km, say (Briscoe, 1975).
340 H. van Haren: Unpredictability of internal M2
4 Data
Data are used from current meters and acoustic Doppler cur-rent profilers (ADCP’s) that were moored in the flat bottom central North Sea, above the continental slope and into the abyssal plain in the Bay of Biscay, and at a sloping side in the Faeroe-Shetland Channel (Fig. 2). To avoid instrumen-tal bias of data, analysis is restricted to observations using only Aanderaa RCM-8 mechanical current meters and RDI-ADCP’s at frequencies 75 and 600 kHz. Prior to analysis, the stability of the clocks of the instruments is verified by com-parison with a single standard, before mooring deployment and after recovery, and also by frequency determination of the dominant harmonic M2. Records are accepted when time
is stable to within half the sampling period, over the entire record.
In the Faeroe-Shetland Channel, observed total currents are up to 0.6–0.9 m s−1. The bottom slope is generally weak
(∼2–4◦), very gentle and showing zones of varying rough and smooth structure. This ocean channel north of the British Isles is relatively narrow, 200 km wide, and moderately deep, H<1300 m. Moorings were deployed along a transect per-pendicular to the Shetland continental slope between H = 500 and 1000 m (60.8◦N, 03.0◦W and 61.0◦N, 03.3◦W). Here, two weeks data will be discussed from the periods May 1997 and April 1999. To avoid some of the fisheries hazards, all moorings were shorter than 100 m above of the bottom, with current meters less than 50 m above the bottom. The cross-slope distance between the moorings was typically 1x=10 km, whilst the vertical instrument separation and the ADCP’s vertical bin size resolution varied between 1z=10 and 35 m.
In the Bay of Biscay, moorings were located along a tran-sect for which H=1500–4800 m, down the continental slope into the abyssal plain (46.7◦N, 05.4◦W–45.8◦N, 06.8◦W). Current meter devices were located between the bottom and up to 500 or 1000 m above it. This continental slope is ex-tremely rugged and canyon-like, compared to the Faeroe-Shetland Channel. Currents are somewhat weaker, varying between 0.15 and 0.6 m s−1.
5 Observations
In the strongly stratified near-surface (z∼–10 m) layers of thickness 1z=1–5 m in the North Sea, shear varies rapidly with depth. The sample in Fig. 3 not only shows dominant baroclinic f and M2+f, but also rare “sub-peaks” at 2f, 3f,
4f, in sharp contrast with sub-peaks at M2, M4, M6, M8 in
the barotropic signal. However, the amplitude of the baro-clinic peaks varies considerably within a few m in the ver-tical, commensurate the variations in S supported by the equally varying stratification. The absence of M2-signal
at the smaller baroclinic vertical scales is also observed in the deep-ocean, with the exception of the stratified bottom
boundary layer above a slope (Gemmrich and van Haren, 2002) and in internal tidal beams very close to their source.
As the internal tide source is found between H=300 and 800 m at the continental slope in the Bay of Biscay (Pingree and New, 1991), the present 1z=48 m ADCP-vertical cur-rent difference data reveal strong deterministic M2 and S2
around 740 m, but not around 1040 m (Fig. 4a). Given a 2% tidal beam slope, and assuming that the deeper observations are made just outside the internal tide beam, the horizontal distance between the ADCP and the source at the slope is <12 km. In these data with relatively large kinetic energy Ek(M2)≫ Ek(f), tidal – foremost M2rather than S2– shear
is observed to vary by a decade in magnitude over a few 100 m vertically. Outside the beam, S is no longer signifi-cantly peaking at M2and |S(f)|=|S(M2)|.
A similar vertical current difference spectrum as the lat-ter is observed in the ocean inlat-terior above the abyssal plain >110 km from the continental slope, even over O(10) times larger vertical scales (Fig. 4b). Using 1z=400 m, which is the vertical distance between consecutive current meters on a mooring at 600 and 1000 m above the bottom, the disparity in kinetic energy between M2and S2reduces by half a decade
in vertical current difference data. The vertical current differ-ences peak near, but not exactly at M2and S2: 1.01M2and
0.99S2. This suggests an interaction with a motion at 0.02
cpd, typical for the long-term variations in the area, but dif-ferently for M2and S2. Even larger peak shifting is observed
in other areas, like the Faeroe-Shetland Channel.
In the topographically less complex Faeroe-Shetland Channel kinetic energy is dominant at synoptic scales, ∼2–5 cycles per day; 1 cpd=2π /86 400 s−1; having amplitudes of
0.1–0.2 m s−1, and at M
2 (Hosegood and van Haren, 2006;
Figs. 1, 5, 6 here). In contrast, vertical (Fig. 5) and “horizon-tal”, cross-slope (Fig. 6) current differences across typical scales of 200 m and 10 km, respectively, are mostly domi-nated at 2.0–2.2 cpd=(1.0–1.1)S2. Using small vertical scales
1z≤50 m, occasionally equal or larger variance is observed around local f (Fig. 5), with a gradual change in peak fre-quency from ∼f to ∼S2when 1z increases from 20 to 200 m.
These observations suggest that most “incoherent” or rela-tively small-scale internal tidal energy is near S2, relatively
far from M2, whilst the mixing inducing shear resides around
f. The question remains whether f-shear is induced by tidal motions. Note that Ek(f) is small in this area, it is not extend-ing as a significant peak above the spectral continuum.
Over typically 10 km in the cross-slope direction (Fig. 6), the dominant current difference variance near S2 is
ac-companied by relatively large variance at different frequen-cies, varying from a relatively broad semidiurnal band to 0.9f=1.57 cpd, depending on time and location. In some of the 1999-data (Fig. 6b) S2varies 180◦in phase across 10 km
in the cross-slope direction at 35 m above the bottom be-tween H=500 and 700 m. This is also found at other heights, not shown. During other observational periods and in other areas, such S2 phase change is observed over distances of
10−4 10−3 10−2 P (10 −4 s −2 /cpd) M2S2
f
(
a
)
1.4 1.6 1.8 2 10−2 100 P (10 −4 m 2 s −2 /cpd) σ (cpd)(
b
)
Fig. 4. Nearly raw spectra from 11 months of current
measure-ments in the Bay of Biscay (BBB). (a) Vertical current shear across
1z=48 m from 75 kHz ADCP, between [–764 and –716] m (shaded)
and [–1068 and –1020] m (heavy solid line). The upward looking ADCP was moored above the continental slope (at 500 m above
H=1600 m; 46.7◦N, –5.4◦W). (b) Kinetic energy from current
me-ter at –3800 m (shaded) and current difference over 400 m vertically
(heavy solid line) above the abyssal plain (H=4800 m; 45.8◦N, –
6.8◦W). Note the difference in f between (a) and (b), due to a small
change in latitude.
20–30 km. In the Faeroe-Shetland Channel, all observations across the range of scales investigated, about half the local continental slope equivalent to 1x∼50 km horizontally and 1z∼400 m vertically, imply that motions at M2are
homoge-neous across these scales despite strong internal forcing and stratification. The large spatial variations in spring-neap cy-cle (as suggested by Gerkema, 2002) are all attributable to relatively small spatial scales at S2, not M2. The
outstand-ing question is whether the small-scale baroclinic semidi-urnal tidal motions [mainly near S2]represent free waves,
phase-locked forced motions or Doppler shifted motions.
6 Discussion
The strong discrepancy in observed scales between motions at or near tidal constituents M2and S2 is not a priori
obvi-ous as both are thought to be large-scale barotropic sources
1 2 3 4 10−1 100 101 102 103 104 105 106 107 P (10 −4 m 2 s −2 /cpd) σ (cpd) M 2S2 M2M4 +f f ∆z=20 m ∆z=50 m ∆z=100 m ∆z=200 m
van Haren Fig. 5
Fig. 5. Nearly raw vertical current difference spectra from 13 days of upward looking 75 kHz ADCP observations between [–
550 and –350] m in the Faeroe-Shetland Channel (60.9◦N, –3.1◦W,
H=600 m). Vertical current differences are computed between ob-servations at z=−550 m and data from higher-up, at increasing dis-tance: 1z=20 m (heavy solid line), 50 m (solid line; offset verti-cally by one decade), 100 m (two decades off-set), 200 m (three
decades). For reference, kinetic energy at z=−350 m is shown
above (shaded; arbitrary vertical scale). The heavy solid vertical lines are at 1.57 cpd (0.9 f) and 2.08 cpd. The heavy dashed lines indicate 1.33 cpd (0.75f) and 2.3 cpd (1.3f).
converting their energy to small baroclinic scales in a near-similar fashion. Their frequency separation is so small that they are equally considered “near-inertial”. Specifically, we are concerned with the observed sequence of increasing scales for the order f, S2, M2. This contrasts with an
ex-pected order of f, M2, S2considering the internal wave band
bounds. Below, several possible reasons are discussed for the observed scale differences.
Vertical small-scales at f are known to exist in the ocean ever since the observations by Leaman and Sanford (1975). Small near-inertial scales are expected, because f constitutes the short vertical wave limit of the internal gravity wave band f<σ <N in the traditional approximation. N represents the buoyancy frequency. However, their generation is still not fully understood. Locally, near-inertial waves may be gen-erated, for example following the geostrophic adjustment of fronts. These fronts can be set-up by any external, spatially varying forcing. Apart from atmospheric disturbances, local
342 H. van Haren: Unpredictability of internal M2 100 102 P (10 −4 m 2 s −2 /cpd) M 2S2 f 2f M2M4 +f
(
a
)
100 102 P (10 −4 m 2 s −2 /cpd)(
b
)
1 2 3 4 100 102 P (10 −4 m 2 s −2 /cpd) σ (cpd)(
c
)
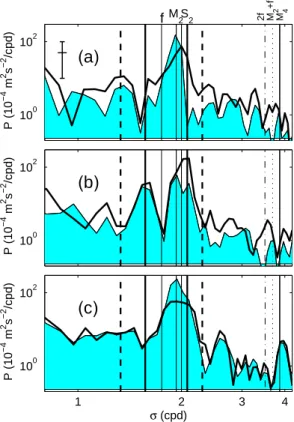
Fig. 6. Nearly raw kinetic energy (shaded) and “horizontal” slope
following current difference (heavy solid lines) spectra from 13 days of current meter observations at 34 m above the bottom in the Faeroe-Shetland Channel. (a) Data from April 1997, with kinetic energy at location H=500 m and current difference between obser-vations at locations H=500 and 700 m. (b) as (a), but for data from April 1999. The vertical heavy solid and dashed lines are as in Fig. 5. (c) as (b) but for data at location H=800 m and the difference between observations at locations H=800 and 1000 m.
interior forcing may be due to semidiurnal tidal waves. But, the relative importance of tidal input in generating f is not yet known and requires further investigation.
Tidal energy can be redistributed through the spectrum following non-linear, resonant or non-resonant, interaction processes. Wave-wave interaction creates higher harmon-ics, whilst parametric subharmonic instability, or “subhar-monic resonance” SR, enhances energy at smaller scales at half the frequency. As a result, free internal waves, gener-ated in large N from M2, can propagate freely equatorward
from |ϕ|=28.8◦(Hibiya et al., 2002), whilst those by S2for
|ϕ|<30◦. Although these interactions create small-scale mo-tions, they do not specifically create them around f, unless f coincides with M1or S1at a “critical latitude”, or S2.
Fur-thermore, due to SR it is especially the large-scale, most energetic M2 that is drained following the interaction, with
the smaller scales possibly retained at half the primary fre-quency.
Alternatively and without detailing the generation of tidal small scales, it may be that observed small-scale S2
actu-ally represent Doppler-shifted small-scale M2-motions. In
an environment where strong sub-tidal currents prevail one expects Doppler shifting of internal wave frequencies in Eu-lerian current measurements with respect to a fixed frame of reference, provided the Doppler shifting sub-tidal current acts as the source of the internal wave beams. However, the latter constraint is generally not satisfied, when the in-ternal tide is generated at a fixed location at a fixed distance from the current meter. This suggested lack of importance of Doppler shifting is reflected in the observations, as broad-ening or smearing of harmonic peaks is not observed, whilst shifts to particular, harmonic frequencies f and S2cannot be
substantiated.
As another alternative, M2-motions may interact with
sub-tidal N-variations, creating motions at non-constituent fquencies (van Haren, 2004), including some local f. We re-call the observations in the Faeroe-Shetland Channel where small-scales are found at ∼0.9f and ∼1.05S2, whilst M2–
f≈0.1f≈0.18 cpd ≈1.05S2–M2. In the Bay of Biscay, peak
shifts of 0.02 cpd coincide in value with typical long-term variations in currents (van Haren, 2004). Internal wave prop-agation along beams depends on sub-inertial variations in background conditions. Thus, such frequency shifts can be explained by considering typical ocean variations in these pa-rameters: f, low-frequency vorticity ζ and N, all a function of (x, y, z, t).
Local effective inertial frequency may vary by such amounts due to low-frequency vorticity variations ζ =∂vlf/∂x–∂ulf/∂y, e.g. due to meso-scale eddies passing, that the short-wave limit may shift to feff=f+ζ /2 (Mooers,
1975). Typical ocean values are |ζ |=0.1f for meso-scale eddies, and 0.01–0.02f is inferred for the deep Bay of Biscay (van Haren, 2004). Near continental slopes in the Faeroe-Shetland Channel they may increase to |ζ |=0.5f (Hosegood and van Haren, 2006). There, (near)S2
occasion-ally becomes the low-frequency short-internal wave limit, at ∼5 days periodicity in April 1999. On the contrary, the rather peaking appearance of observed 0.9f and S2-shear and
current difference is not expected from such rather broad feff – distribution that periodically varies its sign with time
thereby rather smearing peaks.
Nevertheless, a particular short-wave limit, which may lead to a peak in shear like at f, is found at S2 or more
exactly at 2=1.0027S2 for gyroscopic waves: internal
inertio-gravity waves under homogeneous conditions N=0 [when they propagate in meridional direction] (LeBlond and Mysak, 1978). Whilst such conditions are only found on large scales in convective regimes that are not quite com-mon in the usually stably stratified ocean, small-scale layer-ing of N=0 can be quite ubiquitous, e.g. induced by internal wave straining or breaking. Recall that such small-scale lay-ering in stratification is highly associated with laylay-ering in shear, so that the two, vertical and horizontal (Gerkema and Shrira, 2005), short inertio-gravity wave limits [f, N], un-der large stratification, and [0, 2], unun-der zero stratification,
may delimit the shear-bounds. In very weak, but non-zero stratification these inertial-gravity wave bounds are [1.33, 2.3] cpd≈[0.75, 1.3]f for N=f. At the particular values de-limiting the inertial-tidal band observed here, being 0.9f and 1.04S2, a theoretical lower bound of 0.9f is found for N=1.5f
whilst an upper bound of 2.08 cpd for N=0.5f, at ϕ≈60.9◦N. For the formula see LeBlond and Mysak (1978) or Gerkema and Shrira (2005). The different limiting values of stratifica-tion for the upper and lower inertio-gravity wave bounds are commensurate earlier findings in the Irminger Sea, of super-f waves trapping in layers where N<f and sub-f waves trap-ping in N>f (van Haren, 2006).
For proof, we need more information on open ocean shear at the 1–10 m scales that result from fine-scale straining. In addition to the present analysis, data may be investigated in isotherm-following coordinates, but it is noted that 1-m shear-layering in the central North Sea did not reveal greatly different spectral results when considered in Eule-rian or isotherm-following coordinates (van Haren, 2000). Also, the above results should be verified in other ocean ar-eas, e.g. the Mediterranean Sea and Western Atlantic Ocean, where Ek(M2) is relatively weak.
7 Conclusions
In a variety of North-Eastern Atlantic Ocean environments currents are investigated that are dominated by highly pre-dictable semidiurnal lunar tidal M2. The spatial
variabil-ity of these M2-currents is low compared to that of other
constituent motions. M2-currents have scales >O(100 km)
horizontally and ≥0.5H vertically, which are dominant barotropic or lowest mode coherent baroclinic. These scales are not only observed in the open ocean, but also very close to continental slopes. Smaller M2-scales are only observed
in a tidal beam, near one of the prominent sources of internal tides.
As a result, small-scale M2-motions are generally
unpre-dictable as they are lost in noise. They are not directly of im-portance for shear-induced ocean mixing, except in a internal beam in the vicinity, <10 km horizontally, of its source.
Instead, small spatial scales or potentially large shear are observed away from M2, near f and S2, and also, to second
order, at inertial-tidal higher harmonics. The specific fre-quencies at which large shear is found, and the lack of domi-nant advective currents acting as internal tidal wave sources, rule out the importance of Doppler shifting.
The near-inertial (1±0.2)f and near-semidiurnal solar (1±0.1)2≈ (1±0.1)S2bands are special, because they
con-stitute the short-wave limits of the inertio-gravity wave band under weak stratification. The former frequencies may be fed from M2at critical latitudes equatorward of |ϕ|≈30◦, whilst
both may be fed via interaction with variations in background stratification and vorticity at all latitudes. There, the ob-served peaks may represent wave and shear trapping.
Acknowledgements. I enjoyed the assistance of the crew of the R. V. Pelagia, who participated in the deployment and recovery of all NIOZ-moorings. Members of NIOZ-MTM designed and constructed the deep-ocean moorings. J. Thieme and T. Hillebrand helped preparing and deploying the instruments. M. Hiehle made Fig. 2. I thank H. van Aken for the use of current meter data from his project BBB. The Western Atlantic Ocean data in Fig. 1 are
from the OSU deep-water archive. This work is supported by
different grants (INP, BBB, PROCS, LOCO) from the Netherlands organization for the advancement of scientific research, NWO. Edited by: J. M. Huthnance
References
Baines, P. G.: On internal tide generation models, Deep-Sea Res., 29, 307–338, 1982.
Briscoe, M. G.: Preliminary results from the trimoored internal wave experiment (IWEX), J. Geophys. Res., 80, 3872–3884, 1975.
Egbert, G. D. and Ray, R. D.: Significant dissipation of tidal energy in the deep ocean inferred from satellite altimeter data, Nature, 405, 775–778, 2000.
Garrett, C. and St. Laurent, L.: Aspects of deep ocean mixing, J. Oceanogr., 58, 11–24, 2002.
Gemmrich, J. R. and van Haren, H.: Internal wave band eddy fluxes in the bottom boundary layer above a continental slope, J. Mar. Res., 60, 227–253, 2002.
Gerkema, T.: Internal and interfacial tides: beam scattering and local generation of solitary waves, J. Mar. Res., 59, 227–255, 2001.
Gerkema, T.: Application of an internal tide generation model to baroclinic spring-neap cycles, J. Geophys. Res., 107, 3124, doi:10.1029/2001JC001177, 2002.
Gerkema, T. and Shrira, V. I.: Near-inertial waves in the ocean: be-yond the “traditional approximation”, J. Fluid Mech., 529, 195– 219, 2005.
Gould, W. J. and McKee W. D.: Vertical structure of semi-diurnal tidal currents in the Bay of Biscay, Nature, 244, 88–91, 1973. Helland-Hansen, B.: Physical oceanography and meteorology, In:
Report on the scientific results of the “Michael Sars” North At-lantic deep-sea expedition 1910, vol. 1, Bergen Museum, Bergen, Norway, 1932.
Hibiya, T., Nagasawa, M., and Niwa, Y.: Nonlinear
en-ergy transfer within the oceanic internal wave spectrum at mid and high latitudes, J. Geophys. Res., 107(C11), 3207, doi:10.1029/2001JC001210, 2002.
Hosegood, P. and van Haren, H.: Sub-inertial modulation of semi-diurnal currents over the continental slope in the Faeroe-Shetland Channel, Deep-Sea Res. I, 53, 627–655, 2006.
Howarth, M. J.: The effect of stratification on tidal current profiles, Cont. Shelf Res., 18, 1235–1254, 1998.
Leaman, K. D. and Sanford, T. B.: Vertical propagation of inertial waves: a vector spectral analysis of velocity profiles, J. Geophys. Res., 80, 1975–1978, 1975.
LeBlond, P. H. and Mysak, L. A.: Waves in the Ocean, Elsevier, New York, 602 pp, 1978.
Ledwell, J. R., Montgomery, E. T., Polzin, K. L., St. Laurent, L. C., Schmitt, R. W., and Toole, J. M.: Evidence for enhanced mixing
344 H. van Haren: Unpredictability of internal M2 over rough topography in the abyssal ocean, Nature, 403, 179–
182, 2000.
Millot, C. and Cr´epon, M.: Inertial oscillations on the continen-tal shelf of the Gulf of Lions-Observations and theory, J. Phys. Oceanogr., 11, 639–657, 1981.
Mooers, C. N. K.: Several effects of a baroclinic current on the cross-stream propagation of inertial-internal waves, Geophys. Fluid Dyn., 6, 245–275, 1975.
Munk, W. and Wunsch, C.: Abyssal recipes II: energetics of tidal and wind mixing, Deep-Sea Res., 45, 1977–2010, 1998. Nagasawa, M., Niwa, Y., and Hibiya, T.: Spatial and temporal
dis-tribution of the wind-induced internal wave energy available for deep water mixing in the North Pacific, J. Geophys. Res., 105, 13 933–13 943, 2000.
Perkins, H.: Inertial oscillations in the Mediterranean, Deep Sea Res., 19, 289–296, 1972.
Pingree, R. D. and New, A. L.: Abyssal penetration and bottom reflection of internal tidal energy in the Bay of Biscay, J. Phys. Oceanogr., 21, 28–39, 1991.
Polzin, K. L., Toole, J. M., Ledwell, J. R., and Schmitt, R. W.: Spa-tial variability of turbulent mixing in the abyssal ocean, Science, 276, 93–96, 1997.
Sherwin, T. J.: Evidence of a deep internal tide in the Faeroe-Shetland Channel, in: Tidal Hydrodynamics, edited by: Parker, B. B., John Wiley, 469–488, 1991.
Rainville, L. and Pinkel, R.: Propagation of low-mode internal waves through the ocean, J. Phys. Oceanogr., 38, 1220–1236, 2006.
St. Laurent, L. and Garrett, C.: The role of internal tides in mixing the deep ocean, J. Phys. Oceanogr., 32, 2882–2899, 2002. van Haren, H.: Properties of vertical current shear across
stratifica-tion in the North Sea, J. Mar. Res., 58, 465–491, 2000.
van Haren, H.: Incoherent internal tidal currents in the deep-ocean, Ocean Dyn., 54, 66–76, 2004.
van Haren, H.: Asymmetric vertical internal wave propagation, Geophys. Res. Lett., 33, L06618, doi:10.1029/2005GL025499, 2006.
van Haren, H., Maas, L., Zimmerman, J. T. F., Ridderinkhof, H., and Malschaert, H.: Strong inertial currents and marginal inter-nal wave stability in the central North Sea, Geophys. Res. Lett., 26, 2993–2996, 1999.
van Haren, J. J. M. and Maas, L. R. M.: Temperature and current fluctuations due to tidal advection of a front, Neth. J. Sea Res., 21, 79–94, 1987.
Walter, M., Mertens, C., and Rhein, M.: Mixing estimates from a large-scale hydrographic survey in the North Atlantic, Geophys. Res. Lett., 32, L13605, doi:10.1029/2005GL022471, 2005. Wunsch, C.: Internal tides in the ocean, Rev. Geophys. Space Phys.,
13, 167–182, 1975.