Publisher’s version / Version de l'éditeur:
Analytical Chemistry, 82, 10, pp. 4188-4193, 2010-04-27
READ THESE TERMS AND CONDITIONS CAREFULLY BEFORE USING THIS WEBSITE. https://nrc-publications.canada.ca/eng/copyright
Questions? Contact the NRC Publications Archive team at
NRC Publications Archive
Archives des publications du CNRC
This publication could be one of several versions: author’s original, accepted manuscript or the publisher’s version. / La version de cette publication peut être l’une des suivantes : la version prépublication de l’auteur, la version acceptée du manuscrit ou la version de l’éditeur.
For the publisher’s version, please access the DOI link below./ Pour consulter la version de l’éditeur, utilisez le lien DOI ci-dessous.
https://doi.org/10.1021/ac100439j
Access and use of this website and the material on it are subject to the Terms and Conditions set forth at
Resolving the germanium atomic weight disparity using multicollector
ICPMS
Yang, Lu; Meija, Juris
https://publications-cnrc.canada.ca/fra/droits
L’accès à ce site Web et l’utilisation de son contenu sont assujettis aux conditions présentées dans le site LISEZ CES CONDITIONS ATTENTIVEMENT AVANT D’UTILISER CE SITE WEB.
NRC Publications Record / Notice d'Archives des publications de CNRC: https://nrc-publications.canada.ca/eng/view/object/?id=effdbdaf-ef0a-445a-a54d-373a5ec81ebe https://publications-cnrc.canada.ca/fra/voir/objet/?id=effdbdaf-ef0a-445a-a54d-373a5ec81ebe
Resolving the germanium atomic weight disparity using multicollector
ICP-MS
Lu Yang* and Juris Meija
Institute for National Measurement Standards, National Research Council Canada, Ottawa, Ontario, Canada, K1A 0R6.
Email: lu.yang@nrc-cnrc.gc.ca
ABSTRACT
Two most recent mass spectrometric measurements of natural isotopic composition
germanium gave discordant Ge atomic weight values of 72.6276(64)k=2and 72.6390(69)k=2,
respectively, a decade ago. Each measurement was performed with a different mass spectrometry platform, gas source isotope ratio mass spectrometry and thermal ionization mass spectrometry, respectively. Herein we report results obtained by multicollector inductively coupled plasma mass spectrometry yielding an atomic weight of germanium 72.6296(19)k=2which is in support of the upcoming 2009 Standard Atomic Weight
adjustment by IUPAC. Germanium isotope ratios were calibrated using a regression mass bias correction model and NIST SRM 994 gallium isotopic reference material. In this model, no assumptions are made regarding the mass bias differences between gallium and germanium or between the isotopes of germanium. Isotope ratios of 0.5620(21),
0.7515(16), 0.2125(7) and 0.2121(12) were obtained for n(70Ge)/n(74Ge), n(72Ge)/n(74Ge),
n(73Ge)/n(74Ge) and n(76Ge)/n(74Ge), respectively, with expanded uncertainties (k = 2)
estimated in accordance with the ISO/BIPM Guide to the Expression of Uncertainty in Measurements.
INTRODUCTION
Determination of the atomic weight of germanium has always been somewhat of a
challenge – uncertainties as to its precise atomic weight appeared even before the discovery of this element in 1886. In 1864 John Newlands predicted the existence of germanium as a mean of the triad Si–?–Sn with an atomic weight of 73.1De Boisbaudran2surmised the
existence of an element having atomic weight 72.28 and Mendeleyev’s predictions of the atomic weight for ekasilicon varied from 70 (1869) to 72 (1871).3,4(A common
misconception is that Mendeleyev was first to predict the existence of this element in 1869.)
Early mass spectrometric measurements of germanium using thermal ionization mass spectrometry gave the average atomic weight value 72.63 whereas the average atomic weight determined by chemical methods was 72.59.5, 6Since these mass spectrometric
measurements were not calibrated, the Commission on Atomic Weights recommended the ‘chemical’ value in 1961.5The first fully calibrated germanium isotope ratio measurements
appeared only a decade ago, in 1999, and the atomic weights derived were discordant: 72.6276(64) and 72.6390(69).7, 8These two measurements were undertaken with different
mass spectrometry platforms: gas source isotope ratio mass spectrometry (GSMS) and thermal ionization mass spectrometry (TIMS), respectively and both analysed high-purity germanium standards. Hence, the difference in results is likely due to the measurement process. The Commission on Isotopic Abundances and Atomic Weights sided with the value of Chang et al.7and recommended the 1999 Standard Atomic Weight 72.64(1).9
However, at its 2009 Vienna meeting, the Commission reconsidered its previous decision and chose the value of Kipphardt et al.8resulting in the 2009 Standard Atomic Weight of
germanium 72.63(1) which will be soon released.10This action was supported by the
re-evaluation of the historical (1950s) crystallographic data by John Arblaster, Ar(Ge) =
72.625(2).10However, crystallographic data provide only atomic weight of Ge and no
isotopic composition. To help resolve the lingering atomic weight dilemma between the results of Chang et al.7and Kipphardt et al.8, we report absolute isotope ratio
these two studies – a multicollector inductively coupled plasma mass spectrometry (MC-ICP-MS).
Traditionally TIMS has been the technique of choice for achieving the highest accuracy and precision for isotope ratio measurements despite the investment of extensive sample preparation and long measurement time necessary to achieve reliable data.11Recent
developments in MC-ICP-MS has brought a new dimension to this field. In addition to its simple and robust sample introduction, high sample throughput and high mass resolution, the relative precision of the isotope ratio measurements can be as low as ten parts per million, which is comparable to TIMS. However, the much larger mass bias observed with MC-ICP-MS has to be recognized and properly corrected for to achieve accurate isotope ratio measurements. Such a task, however, remains a challenge in analytical chemistry. To date, there is a limited number of applications of MC-ICP-MS for germanium isotope ratio measurements and all of these studies circumvent the challenges of absolute isotope ratio determination by reporting isotope ratios relative to an arbitrary standard (delta scale).12-15
In this study we have undertaken absolute isotope amount ratio measurements of the Sigma-Aldrich germanium standard by MC-ICP-MS using a state-of-the-art regression mass bias correction model based on the utilization of temporal drift between the measured Ge and Ga isotope ratios in their log space without any untestable assumptions.
EXPERIMENTAL SECTION
Instrumentation. A Thermo Fisher Scientific Neptune MC-ICPMS (Bremen, Germany) equipped with nine Faraday cups and a combination of cyclonic and Scott-type spray chambers with a self-aspirating nebulizer MCN50 (Elemental Scientific, Omaha NE, USA) made from perfluoroalkoxy polymer and operating at 50 µL min–1was used in all
measurements. The plug-in quartz torch with sapphire injector was fitted with a platinum guard electrode. Low resolution mode was employed to perform isotope ratio
measurements. Optimization of the Neptune was performed as recommended by the
manufacturer and typical operating conditions are summarized in Table 1. The gain on each Faraday cup was monitored daily to ensure correction for its efficiency.
Reagents and solutions. Reagent grade nitric acid (Fischer Scientific Canada, Ottawa ON, Canada) was purified in-house prior to use by sub-boiling distillation of reagent grade
feedstock in a quartz still. Environmental grade HF was purchased from Anachemia Science (Montreal QC, Canada). High-purity (18 MΩ cm) deionized water was obtained from a NanoPure mixed bed ion exchange system fed with reverse osmosis domestic feed water (Barnstead/Thermolyne Corp, Iowa, USA). Gallium metal isotopic reference material, NIST SRM 994, was purchased from the National Institute of Standards and Technology (Gaithersburg MD, USA). A 2000 µg g–1stock solution of SRM 994 was
prepared by quantitative dissolution of Ga in warm concentrated nitric acid and then diluted with water. A 2500 µg g–1stock solution of germanium was prepared by quantitative
dissolution of high purity Ge metal (99.999%, Sigma-Aldrich, Oakville ON, Canada) in a mixture of HNO3and HF followed by diluted with water.
Sample preparation and analysis. Sample preparation was conducted in a Class-100 clean room. Replicate solutions of 4 µg g–1Ge were prepared by diluting the Ge stock solution in
2% HNO3 followed by spiking with the gallium stock solution, yielding a mass fraction of
500 ng g–1for Ga.
Samples were introduced into the plasma in a self-aspiration mode at a flow rate of 50 μL min–1. Intensities of Ge and all other measured isotopes of interest (see below) obtained
from a blank solution of 2 % HNO3were subtracted from those of all samples. A static run
was employed to collect 69Ga, 70Ge, 70Ge, 71Ge, 72Ge, 73Ge, 74Ge and 76Ge isotopes
simultaneously using the Faraday cup configuration shown in Table 1. Ten to thirteen measurements were made on each sample solution. The duration of each session of
measurements was on the order of 10-13 h. Data sets reported here were collected between September and December of 2009. As no significant amounts of Zn and Se were found in the diluted Ge solutions there was no need for corrections of minor isobaric interferences from 70Zn on 70Ge or 74Se on 74Ge. Data acquisition parameters are summarized in Table 1.
Table 1. MC-ICP-MS operating conditions Instrument settings
Reflected forward power 1250 W
Plasma gas flow rate 15.0 L Ar min–1
Auxiliary gas flow rate 1.00 L Ar min–1
Carrier gas flow rate 1.080 L Ar min–1
Sampler cone depth (H, Ni) 1.1 mm
Skimmer cone depth (Ni) 0.8 mm
Lens settings Optimized for maximum analyte signal
intensity
Data acquisition parameters
Faraday cup configuration L3 (69Ga), L2 (70Ge), L1 (71Ge), C (72Ge), H1
(73Ge), H2 (74Ge), H3 (76Ge)
Mass resolution ~300
Sensitivity 6.2 V for 72Ge at 1 µg Ge g–1
Blank signal (2% HNO3) 1.6 mV for 72Ge
Signal integration time 33.5 s
Number of integrations, cycles, blocks
1, 10, 5
RESULTS AND DISCUSSION
Mass bias correction. Internal mass bias correction for determination of isotope ratios using MC-ICP-MS commonly employs a pair of isotopes of another “suitable” or reference element and the Russell equation.11Among such pairs of elements are Hg-Tl,16Pb-Tl,17
Sr-Zr18or B-C19. The Russell equation equates to the following:20-21
, , f i i j i j j m R r m . (1)
Here Ri,j= n(iE)/n(jE), ri,jis the measured (uncorrected) isotope ratio, f is the fractionation
function and mi, mjare the nuclide masses. Throughout the manuscript we use the notation Ri,j= n(iE)/n(jE) where E is the element of interest. Assuming identical mass bias for two
isotope ratio (Rk,l) is known for the reference element:16-19 ln ln ln ln , , , , i j k l m m m m k l i j i j k l
R
R
r
r
(2)In the recent years, however, it has been recognized that the isotope fractionation behavior, i.e. the value of f in MC-ICP-MS differs from element to element.11Consequently, the
isotope ratios derived in this manner can be erroneous. Errors of up to half a per cent have been noted when the202Hg/200Hg ratio is calibrated via205Tl/203Tl using Eq. 2.22-23Besides,
the ‘corrected’ isotope ratios using the Eq. 2 can be concentration dependent, which clearly invalidates the use of such a correction model for high precision measurements.23
The performance ‘ceiling’ of the thirty-year old Russell equation (Eq. 2) is now clearly realized; in the Ga-Ge system, for example, it is able to correct isotope ratios of germanium only to the second decimal digit. With absolute values of isotope ratios being of interest, an alternative approach was employed. To wit, the employed process of Ge isotope ratio determination is described by simultaneously measuring the temporal drift of the Ge and Ga isotope signals. The intercept and slope of the observed log-linear regressions between the measured (uncorrected) isotope ratios ofiGe/74Ge vs. 69Ga/71Ga forms the basis for
calibration of germanium isotope ratio measurement results.11
The principle of the regression model can be obtained through a series of mathematical transformations, free of any untestable. First, the isotope ratio correction factor (K) is introduced here as a factor that links the observed isotope ratios (r) with the unbiased estimates of the isotope ratios (R):
Ri/74Ge K i/74 Ge r i/74 Ge R69/71Ga K 69/71 Ga r 69/71 Ga (3) The above expression holds no assumptions for it is merely a definition of the correction factors. The multiplicative relation between the variables K and r can be turned into an additive by the use of logarithms:
lnRi/74Ge lnr i/74 Ge lnK i/74 Ge lnR69/71Ga lnr 69/71 Ga lnK 69/71 Ga (4) Rearrangement of this expression leads to a log-linear regression between the measured isotope ratios of Ge and Ga:
i b slope, Ga 71 / 69 Ga 71 / 69 Ge 74 / , intercept Ga 71 / 69 Ga 71 / 69 Ge 74 / Ge 74 / Ge 74 / ln ln ln ln ln ln ln ln r K K R K K R r i a i i i i (5)
As evident from Figure 1, the measured drift of the iGe/74Ge and 69Ga/71Ga isotope ratios
shows well-defined log-linear relationships over a measurement session of 10-13 h in accordance with the Eq. 5. The corresponding intercept (ai) and slope (bi) of the log-linear
regression is calculated using the least squares approach and these estimates are then used to obtain the mass-bias corrected isotope ratios for germanium, n(AGe)/n(74Ge) = R
i/74
Ge , by algebraic rearrangement of Eq. 5:24
Ri/74Ge R 69/71
Ga
bieai (6)
No significant difference in Ge isotope ratios was observed in subsequent experiments with Ge mass fraction in the analyzed solutions from 0.2 to 5 µg g–1. Once the germanium
isotope amount ratios are obtained, Eq. 7 and 8 were used to obtain isotopic abundances and atomic weight of germanium, respectively:25
x
i
R
i/74GeR
Gej/74 j
(7) Ar(Ge) mixi i
(8)This isotope ratio calibration model, also known as the external empirical normalization, was first introduced by Maréchal et al.26for determination of the Zn isotope ratio using Cu
as a reference element and has been most recently used for the determination of Hg isotope ratios via Tl.22The logic and validation of this measurement process has been described in
Cu-Zn26, Hg-Tl22and Pb-Tl27, we believe that it can be applicable for high-precision
absolute isotope ratio measurements of any other element. Moreover, the universal
applicability of this model is also strongly supported by the lack of untestable assumptions in its mathematical framework.24
In this work, the NIST certified value28of 1.50676(39)
95%was used for R69/71Ga to obtain the
mass bias corrected Ri/74Ge .
y = 1.7262x - 1.2858 R2 = 0.9995 -0.6725 -0.6721 -0.6717 -0.6713 -0.6709 -0.6705 -0.6701 0.3553 0.3558 0.3563 0.3568 y = 0.8632x - 0.6407 R2 = 0.9993 -0.3343 -0.3340 -0.3337 -0.3334 -0.3331 -0.3328 -0.3325 0.3553 0.3558 0.3563 0.3568 y = -0.8588x - 1.1991 R2 = 0.9992 -1.5059 -1.5056 -1.5053 -1.5050 -1.5047 -1.5044 -1.5041 0.3553 0.3558 0.3563 0.3568 y = 0.506x - 1.7579 R2 = 0.9944 -1.5782 -1.5780 -1.5778 -1.5776 -1.5774 -1.5772 -1.5770 0.3553 0.3558 0.3563 0.3568 ln ( 70 G e/ 74 G e) ln ( 72 G e/ 74 G e) ln ( 76 G e/ 74 G e) ln ( 73 G e/ 74 G e)
Figure1. Temporal drifts of the germanium and gallium isotope ratios during a 13 h
measurement session. The log-linear regression plots are the basis for calibrating germanium isotope ratios via the n(69Ga)/n(71Ga) certified reference value (NIST SRM
994).
Spectral interferences. Potential spectral interferences from 40Ar29Si+, 70Zn+, 40Ar20Si+, 36Ar35Cl+, 36Ar36Ar+, 36Ar37Cl+, 36Ar35Cl+, 36Ar38Ar+, 76Se+, and 36Ar40Ar+on both Ga and
Ge isotopes could occur in samples containing these elements which would degrade the accuracy of calculated Ge isotope ratios and require elimination or correction. Semi-quantitative analysis of Ge sample solutions revealed that the mass fraction of such interfering elements as Zn and Se was less than 5 pg g–1. Such concentrations are
insignificant to form isobaric interferences since the mass fraction of Ga and Ge in the samples was 0.25 to 5 µg g–1, respectively. No significant Si was found in the test
solutions. Argon dimer and its associated polyatomic interferences were corrected by subtracting intensities measured from a 2% HNO3solution which was used for sample
preparation. In general, measured intensities for Ga and Ge isotopes in the 2% HNO3
solution were at least three to four orders of magnitude lower than those obtained from germanium samples, confirming insignificant contributions from Ar2+or its associated
interferences.
Uncertainty evaluation. Uncertainty propagation of the mass bias corrected
germanium isotope ratios (Eq. 6) was done in accordance with the ISO/BIPM “Guide to the Expression of Uncertainty in Measurement”.29The full uncertainty evaluation framework
for isotope ratio, isotopic abundance and atomic weight measurement results is described in great detail elsewhere.22, 24
Because the uncertainty associated with NIST SRM 994 Ga, n(69Ga)/n(71Ga) =
1.50676(39)k=2, has to be incorporated in the overall germanium isotope ratio measurement
uncertainty, the uncertainty of Ri/74Ge can be evaluated only by means of error propagation.
Note also that the regression parameters ai and bi in Eq. 6 cannot be considered
independent variables. Instead, these are perfectly anti-correlated variables, i.e. ρ(ai, bi) = –
u2(Ri/74) biRi/74u(RGa) RGa 2 Ri/742 (ua ln RGaub)2 (9)
To account for the correlation between the isotope ratios,30-31germanium isotope ratio
covariance matrix was evaluated from Eq. 6 using the variance-covariance propagation of the uncertainty contributions from the isotope ratio of gallium and the Ge-Ga regression parameter estimates:
T
reg
reg
T
R
R
R
R
J
u
J
J
J
reg
2
Ga , (10) where
74 / 76 76 74 / 70 70 Ga Ga 74 /1
R
b
R
b
R
R
R
i R
J
, (11) andJ
reg
R
i/74a
iR
i/74b
i
i70 76
R
i/74lnR
Ga i70 76
R
i/74
. (12)Here is a matrix direct sum operator. As an example,
i1 3
Ri R1 0 0 0 R2 0 0 0 R3 (13)Noting again that the estimates of the individual regression intercepts and slopes are perfectly anti-correlated,22, 24
2 2 i i i i i i b i b a i b a i a i regu
u
u
u
u
u
. (14)
x J
x
RJ
Tx (15) where
76 74 / 76 70 74 / 70x
R
x
R
x
J
(16)Last, the uncertainty of atomic weight measurement result was calculated as follows:22, 24
m
m
x
x
u
A2r(Ge)
T
m
T
x
(17) where x = [x70, …, x76]T and m = [m 70, …, m76]T. Using this approach, each regressionplot yields a set of Ge isotope ratios, isotope abundances and atomic weight with the corresponding uncertainties for each estimate. The average of all regression experiment results is then obtained which serves as the property value for all measurands. The combined uncertainty of the grand mean, uc, was obtained by combining the uncertainties
of the individual estimates and the variations between these means as per recent guidelines of NIST—the Type B model of the bias method.32The following equation was used:
uc sm2 1
p
ui2 (18)where smis the standard deviation of the p means (p = 12) and uiis the uncertainty of the
individual measurand estimates, i = [1…p].
Results. For the determination of germanium isotope ratios, replicate sample solutions of 4 µg g–1Ge and 0.50 µg g–1Ga were prepared and each was measured under the optimized
experimental conditions in a 10-13 h measurement session. During the three-month period between September and December 2009, many sets of isotope ratio log-linear regressions were acquired for 70Ge/74Ge, 72Ge/74Ge, 73Ge/74Ge and 76Ge/74Ge vs. 69Ga/71Ga, each
yielding the respective intercept and slope. Depending on the daily operating conditions and stability of the instrument, data sets with poor linearity between Ge isotope ratios and
69Ga/71Ga in their log space could obtained due to unexplained variations in
isotope ratio log-linear regressions with high coefficient of determination (r2≥ 0.99) for all
isotope ratios were selected for calculation of the final result. The mass bias corrected Ge isotope ratios were then obtained from Eq. 6 followed by the calculation of the isotopic abundances and the atomic weight using Eq. 7 and 8, respectively.
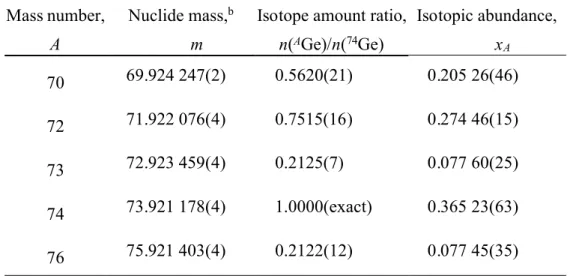
Table 2. Results for germanium isotope ratios, isotopic abundances and atomic weighta
Mass number, A
Nuclide mass,b
m
Isotope amount ratio, n(AGe)/n(74Ge) Isotopic abundance, xA 70 69.924 247(2) 0.5620(21) 0.205 26(46) 72 71.922 076(4) 0.7515(16) 0.274 46(15) 73 72.923 459(4) 0.2125(7) 0.077 60(25) 74 73.921 178(4) 1.0000(exact) 0.365 23(63) 76 75.921 403(4) 0.2122(12) 0.077 45(35)
Atomic weight, Ar(Ge) = 72.6296(19)
a. Values are presented in a concise notation whereby the expanded uncertainty is given in
parenthesis next to the least significant digits to which it applies; for example, x70= 0.205 26(46) is
the concise form of the expression x70= 0.20526 ± 0.00046. It is intended that the expanded
uncertainty encompasses every aspect that reasonably contributes to the uncertainty of the property value. A coverage factor of two (2) was applied.
b. Atomic masses used for calculation are from the 2003 Atomic mass evaluation.32
The atomic weight of 72.6296(19)k=2obtained by MC-ICP-MS in this study using the
regression mass bias correction model is in a good agreement with the value of
72.6276(64)k=2obtained by Kipphardt et al.8(GSMS) but is significantly different from
72.6390(69)k=2reported by Chang et al.7(TIMS). In our view, the results obtained by
variations in high purity Ge materials at the level of precision attained in this work.7,8,33
However, small variations of 70Ge/74Ge ratio spanning from –4.0 to +3.0 per mill relative to
Sigma-Aldrich Ge standard have been documented in various geological and
environmental samples.13-15, 34Since the atomic weight of Ge in this study was measured
for the same Sigma-Aldrich Ge material, the observed relative natural variations can be readily compared to the measurement uncertainty reported in this work. As shown in Figure 2, the expanded measurement uncertainty of the Ge atomic weight in this material effectively covers the observed variations of Ge isotope ratios.
Figure 2. Natural variations of Ge isotopic composition and the isotope ratios in the
Sigma-Aldrich Ge material. Range of natural variations, depicted as shaded bowtie, is compiled from Luais (2007)34, Siebert et al. (2006)13, Rouxel et al. (2006)14and Hirata et
al. (1997)15.
-6.0
-4.0
-2.0
0.0
2.0
4.0
6.0
A = 70 72 73 74 761
00
0
.δ
A /7 4vs
.
S
ig
m
a
-A
ld
ri
ch
G
e
Natural variations Sigma-Aldrich-6.0
-4.0
-2.0
0.0
2.0
4.0
6.0
A = 70 72 73 74 761
00
0
.δ
A /7 4vs
.
S
ig
m
a
-A
ld
ri
ch
G
e
Natural variations Sigma-AldrichTo achieve utmost transparency of the measurement results, this manuscript is
accompanied by an electronic supplementary data file (Microsoft Excel) containing all raw data and calculations contributing to the final germanium isotope ratios, isotopic
composition and atomic weight.
CONCLUSIONS
A precise and accurate method was employed for absolute germanium isotope ratio measurements wherein isotopic abundances and atomic weight were calibrated using a regression mass bias correction model. The atomic weight of 72.6296(19)k=2obtained in
this study agrees with the 72.6276(64)k=2by Kipphardt et al.8and is in support of the 2009
Standard Atomic Weight of germanium, 72.63(1).10Whereas TIMS has been historically
the authoritative technique for determining accurate isotopic composition of the elements, MC-ICP-MS was paramount in resolving the recent controversy regarding the atomic weight of zinc.35Likewise, with this account, we believe that the existing disparity in the
atomic weight of germanium will be resolved.
ACKNOWLEDGEMENT
Authors thank Ralph Sturgeon and Zoltán Mester for their valuable comments and discussion which have helped to improve this manuscript.
REFERENCES
1. Newlands, J. A. R. Chem. News 1864, 10, 59-60.
2. Lecoq De Boisbraudran, M. Chem. News, 1886, 54, 4-5.
3. Gordin, M. D. A well-ordered thing: Dmitrii Mendeleev and the shadow of the periodic table; Basic Books: New York, 2004.
4. Jensen, W. B. (ed) Mendeleev on the Periodic Law: Selected writings, 1869-1905; Dover: Mineola, NY, 2005.
5. Cameron, A. E.; Wichers, E. J. Am. Chem. Soc. 1962, 84, 4175-4197.
6. De Laeter, J. R.; Böhlke, J. K.; De Bièvre, P.; Hidaka, H.; Peiser, H. S.; Rosman, K. J. R.; Taylor, P. D. P. Pure Appl. Chem. 2003, 75, 683-800.
9. Coplen, T. B.; Pure Appl. Chem. 2001, 73, 667-683. 10. Wieser, M. E.; personal communication.
11. Yang, L. Mass Spectrom. Rev. 2009, 28, 990-1011.
12. Galy, A.; Pomies, C.; Day, J. A.; Pokrovsky, O. S.; Schott, J. J. Anal. At. Spectrom.
2003, 18, 115-119.
13. Siebert, C.; Ross, A.; McManus, J. Geochim. Cosmochim. Acta 2006, 70, 3986-3995. 14. Rouxel, O.; Galy, A.; Elderfield, H. Geochim. Cosmochim. Acta 2006, 70,
3387-3400.
15. Hirata, T. Geochim. Cosmochim. Acta 1997, 61, 4439-4448.
16. Blum, J. D.; Bergquist, B. A. Anal. Bioanal. Chem. 2007, 388, 353-359. 17. Gallon, C.; Aggarwal, J.; Flegal, A. R. Anal. Chem. 2008, 80, 8355– 8363. 18. Waight, T.; Baker, J.; Willigers, B.; Chem. Geol. 2002, 186, 99-116.
19. Santamaria-Fernandez, R.; Le Goff, T. J. Anal. At. Spectrom. 2010, in press. 20. Albarede, F.; Telouk, P.; Blichert-Toft, J.; Boyet, M.; Agranier, A.; Nelson, B.
Geochim. Cosmochim. Acta 2004, 68, 2725– 2744.
21. Kehm, K.; Hauri, E. H.; Alexander, C. M. O. D.; Carlson, R. W. Geochim. Cosmochim. Acta 2003, 67, 2879-2891.
22. Meija, J.; Yang, L.; Sturgeon, R.; Mester, Z. J. Anal. At. Spectrom. 2010, in press. 23. Yang, L.; Sturgeon, R. E. Anal. Bioanal. Chem. 2009, 393, 377-385.
24. Meija, J.; Yang, L.; Sturgeon, R.; Mester, Z. Anal. Chem. 2009, 81, 6774-6778. 25. De Laeter, J. R.; Böhlke, J. K.; De Bièvre, P.; Hidaka, H.; Peiser, H. S.; Rosman, K.
J. R.; Taylor, P. D. P. Pure Appl. Chem. 2003, 75, 683-800.
26. Marechal, C. N.; Telouk, P.; Albarede, F. Chem. Geol. 1999, 156, 251-273. 27. White, W. M.; Albarède, F.; Télouk, P. Chem. Geology 2000, 167, 257-270.
28. Machlan, L. A.; Gramlich, J. W.; Powell, L. J.; Lambert, G. M. Journal of Research of the National Bureau of Standards, 1986, 91, 323-331.
29. Guide to the Expression of Uncertainty in Measurement; ISO/BIPM: Geneva, Switzerland, 1995.
30. Meija, J.; Mester, Z. Metrologia, 2008, 45, 53-62.
31. Meija, J.; Mester, Z. Spectrochimica Acta B, 2007, 62, 1278-1284.
32. Levenson, M. S.; Banks, D. L.; Eberhardt, K. R.; Gill, L. M.; Guthrie, W. F.; Liu, H. K.; Vangel, M. G.; Yen, J. H.; Zhang, N. F. Journal of the Research of the national Institute of Standards and Technology, 2000, 105, 571-579.
33. Green, M. D.; Rosman, K. J. R.; De Laeter J. R. Intl. J. Mass Spectrom. 1986, 68, 15-24.
34. Luais, B. Earth Planet. Sci. Lett. 2007, 262, 21-36.
35. Ponzevera, E.; Quétel, C. R.; Berglund, M.; Taylor, P. D. P.; Evans, P.; Loss, R. D.; Fortunato, G. J. Am. Soc. Mass Spectrom. 2006, 17, 1413-1428.