HAL Id: hal-01472932
https://hal.inria.fr/hal-01472932
Submitted on 21 Feb 2017
HAL is a multi-disciplinary open access
archive for the deposit and dissemination of
sci-entific research documents, whether they are
pub-lished or not. The documents may come from
teaching and research institutions in France or
abroad, or from public or private research centers.
L’archive ouverte pluridisciplinaire HAL, est
destinée au dépôt et à la diffusion de documents
scientifiques de niveau recherche, publiés ou non,
émanant des établissements d’enseignement et de
recherche français ou étrangers, des laboratoires
publics ou privés.
The 2016 Signal Separation Evaluation Campaign
Antoine Liutkus, Fabian-Robert Stöter, Zafar Rafii, Daichi Kitamura,
Bertrand Rivet, Nobutaka Ito, Nobutaka Ono, Julie Fontecave
To cite this version:
Antoine Liutkus, Fabian-Robert Stöter, Zafar Rafii, Daichi Kitamura, Bertrand Rivet, et al.. The 2016
Signal Separation Evaluation Campaign. LVA/ICA 2017 - 13th International Conference on Latent
Variable Analysis and Signal Separation, Feb 2017, Grenoble, France. pp.323 - 332,
�10.1007/978-3-319-53547-0_31�. �hal-01472932�
The 2016 Signal Separation Evaluation
Campaign
Antoine Liutkus1, Fabian-Robert St¨oter2, Zafar Rafii3, Daichi Kitamura4,
Bertrand Rivet5, Nobutaka Ito6, Nobutaka Ono7, and Julie Fontecave8
1 Inria, speech processing team, Villers-l`es-Nancy, France
2
International Audio Laboratories Erlangen, Germany
3 Gracenote, Applied Research, Emeryville, USA
4
SOKENDAI (The Graduate University for Advanced Studies), Japan
5 GIPSA-lab, CNRS, Univ. Grenoble Alpes, Grenoble INP, Grenoble, France
6
NTT Communication Science Laboratories, NTT Corporation, Japan 7
National Institute of Informatics, Japan 8
UJF-Grenoble 1 / CNRS / TIMC-IMAG UMR 5525, France Abstract. In this paper, we report the results of the 2016 community-based Signal Separation Evaluation Campaign (SiSEC 2016). This edi-tion comprises four tasks. Three focus on the separaedi-tion of speech and music audio recordings, while one concerns biomedical signals. We sum-marize these tasks and the performance of the submitted systems, as well as provide a small discussion concerning future trends of SiSEC.
1
Introduction
Evaluating source separation algorithms is a challenging topic on its own, as well as finding appropriate datasets on which to train and evaluate various separation systems. In this respect, the Signal Separation Evaluation Campaign (SiSEC) has played an important role. SiSEC was held about every year-and-half since 2008, in conjunction with the LVA/ICA conference. Its purpose is two-fold.
The primary objective of SiSEC is to regularly report the progress of the source separation community, in order to serve as a reference for a comparison of as many methods as possible on the topic of source separation. This involves adapting both the evaluations and the metrics to current trends in the field.
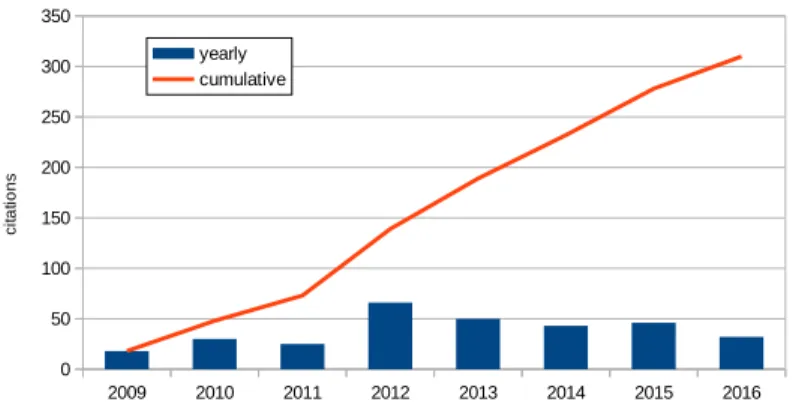
The second important objective of SiSEC is then to provide data the com-munity can use for the design and evaluation of new methods, even outside the scope of the campaign itself. These efforts lead to a significant, although moderate, impact of SiSEC in the community as depicted on Figure 1.
For the objective evaluation of source separation, two options are now widely accepted and used for SiSEC’2016. First, the BSS Eval toolbox [3] features the signal to distortion ratio (SDR), the source image to spatial distortion ratio (ISR), the signal to interference ratio (SIR), and signal to artifacts ratio (SAR) metrics. All are given in dB and are better with better separation. Second, the PEASS toolbox [4] was used in some tasks for providing four perceptually-motivated criteria: the overall perceptual score (OPS), the target-related per-ceptual score (TPS), the interference-related perper-ceptual score (IPS), and the artifact-related perceptual score (APS).
Fig. 1. The number of papers referring to SiSEC (source: Google Scholar).
This sixth SiSEC features the same UND and BGN tasks as proposed last year and summarized in sections 2 and 3, respectively. The BIO task presented in section 4 is new. Finally, the MUS task presented in section 5 features new data and accompanying software.
2
UND: Underdetermined-speech and music mixtures
The datasets for the UND task are the same as those described in detail in [1]. The results presented here include those found in previous editions, as well as a new contribution [25], that utilizes both generalized cross correlation (GCC, [33]) and nonnegative matrix factorization (NMF, [34]). GCC was used previously for sound source localization in reverberant environments [35]. NMF is a well-known mathematical framework for many applications, especially in the source sepa-ration task. For the acoustic signals, NMF can extract some spectral patterns (bases) and their activations (time-varying gains), and the source separation is achieved by clustering the bases into each source. Wood et al. combined GCC with NMF to localize individual bases over time, such that they may be at-tributed to individual sources. Computations of Wood’s algorithm were between 6 and 7 minutes per mixture on a dual 2.8 GHz Intel Xeon E5462 quad-core processor with 16 GB of RAM.
From the comparison of the results on Table 1, Wood’s algorithm could not outperform the best ever performance on this dataset. Other results for microphone spacings of 5 cm and 1 m with reverberation times of 130 ms and 250 ms may be found on the SiSEC 2016 website1.
3
BGN: Two-channel mixtures of speech and real-world
background noise
Just like for the UND task, we proposed the same dataset for the task ‘two-channel mixtures of speech and real-world background noise (BGN)’ as in SiSEC 2013 [1].
1
Table 1. Results for the UND task for convolutive mixtures averaged over sources: live-recorded data with 1 m microphone spacing and 250 ms reverberation time in dataset “test”
2mic/3src (female) 2mic/4src (female) 2mic/3src (male) 2mic/4src (male) System SDR ISR SIR SAR SDR ISR SIR SAR SDR ISR SIR SAR SDR ISR SIR SAR
OPS TPS IPS APS OPS TPS IPS APS OPS TPS IPS APS OPS TPS IPS APS Wood [25] 3.2 6.7 4.7 6.8 2.2 5.0 2.8 4.8 3.1 6.5 4.3 6.6 2.5 5.2 3.1 4.8 (SiSEC 2016) 10.6 8.6 9.0 23.3 27.4 43.7 35.3 47.1 9.7 8.8 9.9 24.2 29.6 47.9 41.7 44.5 Nguyen 6.1 9.9 9.3 9.6 4.0 7.5 7.1 7.1 5.9 10.1 9.8 8.2 2.5 5.8 4.1 5.4 (SiSEC 2015) 37.1 63.0 48.2 59.0 34.7 60.3 47.6 49.9 40.0 65.8 53.1 53.7 31.8 50.8 43.1 48.0 Cho [27] 5.5 9.5 8.1 9.4 4.3 7.8 6.8 7.5 5.5 9.5 8.2 9.1 3.2 6.6 4.7 6.2 (SiSEC 2013) 35.6 62.9 43.4 59.0 33.3 59.0 38.3 52.3 36.0 61.5 44.8 58.7 35.1 57.0 42.8 50.8 Adiloglu [28] 3.0 7.0 5.5 8.1 0.7 4.3 0.9 4.8 3.4 7.1 5.8 8.4 1.5 5.0 2.1 5.2 (SiSEC 2013) 28.4 53.7 35.2 60.8 29.2 46.4 29.4 53.3 26.4 51.4 31.8 63.0 32.7 52.2 36.1 56.1 Hirasawa [29] 2.2 4.2 4.3 4.0 1.2 3.2 0.9 2.6 1.7 3.8 2.8 3.6 0.9 3.0 0.4 1.9 (SiSEC 2011) 22.6 32.6 46.8 38.1 19.5 23.6 41.6 32.8 24.6 36.1 44.0 41.2 20.2 26.3 41.6 34.5 Iso [30] 6.1 9.8 8.7 10.9 – – – – 5.5 9.4 8.5 9.1 – – – – (SiSEC 2011) 30.4 59.6 45.1 64.8 – – – – 30.9 54.5 35.0 59.8 – – – – Cho [31] 3.2 7.4 4.4 8.1 0.0 3.1 -0.7 5.8 4.2 8.8 6.7 8.0 0.9 4.2 1.2 5.2 (SiSEC 2011) 22.0 27.8 20.8 43.6 21.7 24.7 20.0 40.5 37.4 63.3 46.4 55.5 25.2 32.4 25.0 46.4 Nesta (1) [32] 4.3 6.5 7.9 8.4 2.8 5.2 5.3 6.2 4.9 7.5 9.1 7.5 3.5 5.9 6.6 5.1 (SiSEC 2011) 38.1 63.1 52.0 56.3 35.5 54.7 49.5 45.8 41.2 63.5 55.0 52.5 35.7 56.3 53.6 42.2 Nesta (2) [32] 6.0 10.2 10.4 10.2 3.4 6.9 6.3 7.2 6.2 10.3 10.4 8.6 4.7 8.3 8.3 6.3 (SiSEC 2011) 37.3 60.8 50.5 60.2 33.6 49.5 45.0 50.1 39.8 60.1 52.1 55.2 35.7 54.5 51.1 49.6 Ozerov [15] 3.6 8.2 7.4 7.4 1.5 5.1 2.5 4.7 6.0 10.4 9.9 8.8 2.2 5.9 3.8 5.4 (SiSEC 2011) 36.0 63.5 48.1 56.2 30.6 47.5 38.1 49.5 39.6 61.3 51.7 58.2 37.4 55.9 50.3 51.7
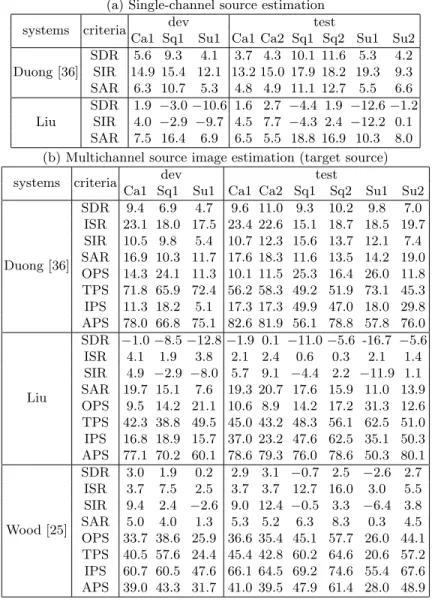
Three algorithms were submitted to the BGN task this year, as shown in Table 2. Duong’s method [36] is based on NMF with pre-trained speech and noise spectral dictionaries. Liu’s method performs Time Difference of Arrival (TDOA) clustering based on GCC-PHAT. Wood’s method [25] first applies NMF to the magnitude spectrograms of the mixture signals with channels concatenated in time. Each dictionary atom is then attributed to either the speech or the noise according to its spatial origin.
Considering the results in Table 2, we can see that all methods present some advantages. Whereas Duong’s method [36] clearly shows a significant superiority on BSS Eval metrics, this is much less clear when analyzing the PEASS percep-tual scores. Wood’s method [25] indeed gives the best OPS and IPS scores, suggesting a better overall and interference-related perceptual quality of esti-mates. Now analyzing APS scores, Liu’s method consistently gives results with few annoying artifacts. From all these facts and contradictions, we see the limi-tations of objective metrics and it seems clear that a real perceptual evaluation would be needed to draw further conclusions.
4
BIO: Separation of biomedical signals
Phonocardiography (PCG) is the recording of the sounds generated by the heart. It allows to evaluate some vital functions of the heart. However, the raw
record-Table 2. Results for the BGN task (a) Single-channel source estimation
systems criteria dev test
Ca1 Sq1 Su1 Ca1 Ca2 Sq1 Sq2 Su1 Su2
Duong [36] SDR 5.6 9.3 4.1 3.7 4.3 10.1 11.6 5.3 4.2 SIR 14.9 15.4 12.1 13.2 15.0 17.9 18.2 19.3 9.3 SAR 6.3 10.7 5.3 4.8 4.9 11.1 12.7 5.5 6.6 Liu SDR 1.9 −3.0 −10.6 1.6 2.7 −4.4 1.9 −12.6 −1.2 SIR 4.0 −2.9 −9.7 4.5 7.7 −4.3 2.4 −12.2 0.1 SAR 7.5 16.4 6.9 6.5 5.5 18.8 16.9 10.3 8.0
(b) Multichannel source image estimation (target source)
systems criteria dev test
Ca1 Sq1 Su1 Ca1 Ca2 Sq1 Sq2 Su1 Su2
Duong [36] SDR 9.4 6.9 4.7 9.6 11.0 9.3 10.2 9.8 7.0 ISR 23.1 18.0 17.5 23.4 22.6 15.1 18.7 18.5 19.7 SIR 10.5 9.8 5.4 10.7 12.3 15.6 13.7 12.1 7.4 SAR 16.9 10.3 11.7 17.6 18.3 11.6 13.5 14.2 19.0 OPS 14.3 24.1 11.3 10.1 11.5 25.3 16.4 26.0 11.8 TPS 71.8 65.9 72.4 56.2 58.3 49.2 51.9 73.1 45.3 IPS 11.3 18.2 5.1 17.3 17.3 49.9 47.0 18.0 29.8 APS 78.0 66.8 75.1 82.6 81.9 56.1 78.8 57.8 76.0 Liu SDR −1.0 −8.5 −12.8 −1.9 0.1 −11.0 −5.6 -16.7 −5.6 ISR 4.1 1.9 3.8 2.1 2.4 0.6 0.3 2.1 1.4 SIR 4.9 −2.9 −8.0 5.7 9.1 −4.4 2.2 −11.9 1.1 SAR 19.7 15.1 7.6 19.3 20.7 17.6 15.9 11.0 13.9 OPS 9.5 14.2 21.1 10.6 8.9 14.2 17.2 31.3 12.6 TPS 42.3 38.8 49.5 45.0 43.2 48.3 56.1 62.5 51.0 IPS 16.8 18.9 15.7 37.0 23.2 47.6 62.5 35.1 50.3 APS 77.1 70.2 60.1 78.6 79.3 76.0 78.6 50.3 80.1 Wood [25] SDR 3.0 1.9 0.2 2.9 3.1 −0.7 2.5 −2.6 2.7 ISR 3.7 7.5 2.5 3.7 3.7 12.7 16.0 3.0 5.5 SIR 9.4 2.4 −2.6 9.0 12.4 −0.5 3.3 −6.4 3.8 SAR 5.0 4.0 1.3 5.3 5.2 6.3 8.3 0.3 4.5 OPS 33.7 38.6 25.9 36.6 35.4 45.1 57.7 26.0 44.1 TPS 40.5 57.6 24.4 45.4 42.8 60.2 64.6 20.6 57.2 IPS 60.7 60.5 47.6 66.1 64.5 69.2 74.6 55.4 67.6 APS 39.0 43.3 31.7 41.0 39.5 47.9 61.4 28.0 48.9
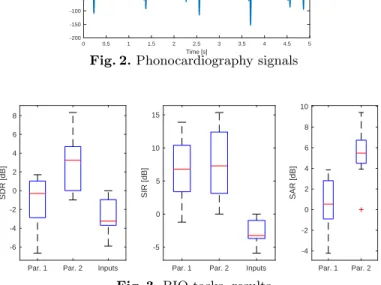
0 0.5 1 1.5 2 2.5 3 3.5 4 4.5 5 Time [s] -200 -150 -100 -50 0 50 100 150 200 PCG
Fig. 2. Phonocardiography signals
Par. 1 Par. 2 Inputs -6 -4 -2 0 2 4 6 8 SDR [dB]
Par. 1 Par. 2 Inputs -5 0 5 10 15 SIR [dB] Par. 1 Par. 2 -4 -2 0 2 4 6 8 10 SAR [dB]
Fig. 3. BIO tasks, results
ings of the PCG are not always directly exploitable because of ambient inter-ference (e.g., speech, cough, gastric noise, etc.). Consequently, it is necessary to denoise the raw PCG before their interpretation. An example of clean PCG is plotted on Figure. 2.
The aim of this challenge is to extract the heart activity from raw PCG recordings with a single microphone maintained by a belt on the skin, in front of the heart. 16 sessions have been recorded from 3 healthy participants in different conditions. The quality of the separation process has been evaluated by the BSS Eval toolbox. The SDR, SIR and SAR indexes were computed on sliding windows of 1 second with an overlap of 0.5 second. The performance was only retained for the indexes related to the heart sounds.
Two participants have submitted their results on this specific task:
– The first participant (Part. 1) proposed a method based on the alignment of Empirical Mode Decomposition (EMD) and Lempel-Ziv complexity measure to extract the denoised signal.
– The second participant (Part. 2) proposed a method based on the decomposi-tion of the signal using an ensemble empirical mode decomposidecomposi-tion (EEMD) and the selection of some IMFs to filter the signal. Finally, the estimated sig-nal is post-processed to reject additiosig-nal peaks based on the characteristics of PCG signals.
The results achieved by the submitted methods are plotted on Figure. 3 that shows the distribution of SDR, SIR and SAR for the two participants as well as
the noisy data. The red line is the median, the edges of the box are the 25th and 75th percentiles, the whiskers extend to the most extreme values and outliers are plotted by a red cross. In term of SIR, i.e., rejection of noise, Part. 2 is slightly better than Part. 1: the average SIR improvements are of 10.4 dB and 9.6 dB, respectively, while the average SIR on the noisy data is -3 dB. On the contrary, the Part. 2’s method leads to better results based on SDR and SAR than the Part. 1’s one: an average gain in SDR of 5.7 dB and 1.4 dB, and an average SAR of 5.5 dB and 0.5 dB. It is interesting to see that the two participants proposed methods based on empirical mode decomposition.
5
MUS: Professionally-produced music recordings
The MUS task attempts at evaluating the performance of music separation meth-ods. In SiSEC 2015 [2], a new dataset was introduced for this task, comprising 100 full-track songs of different musical styles and genres, divided into develop-ment and test subsets. This year, this dataset was further heavily remastered so that for each track, it now features a set of four semi-professionally engineered stereo source images (bass, drums, vocals, and other), summing up to realistic mixtures. This corpus was called the Demixing Secret Database (DSD100), as a reference to the ’Mixing Secrets’ Free Multitrack Download Library it was build from2. The duration of the songs ranges from 2 minutes and 22 seconds to 7
minutes and 20 seconds, with an average duration of 4 minutes and 10 seconds. Additionally, an accompanying software toolbox was developed in Matlab and Python that permits the straightforward processing of the DSD100 dataset. This software is open source and was publicly broadcasted so as to allow the participants to run the evaluation themselves3.
Similarly to the previous SiSEC editions, MUS was the task attracting the most participants, with 24 systems evaluated. Due to page constraints, we may not detail each method, but encourage the interested reader to refer to SiSEC’2016 website and to the references given therein.
Among the systems evaluated, 10 are blind methods: CHA [10], DUR [11], KAM [13], OZE [15], RAF [18, 17, 16], HUA [12], JEO [40]. Then, 14 are super-vised methods exploiting variants of deep neural networks: GRA [39], KON [41], UHL [38], NUG [14], and the methods proposed by F.-R. St¨oter (STO), consist-ing of variants of [38, 37] with various representations. Finally, the evaluation also features the scores of Ideal Binary Mask (IBM), computed for left and right channels independently.
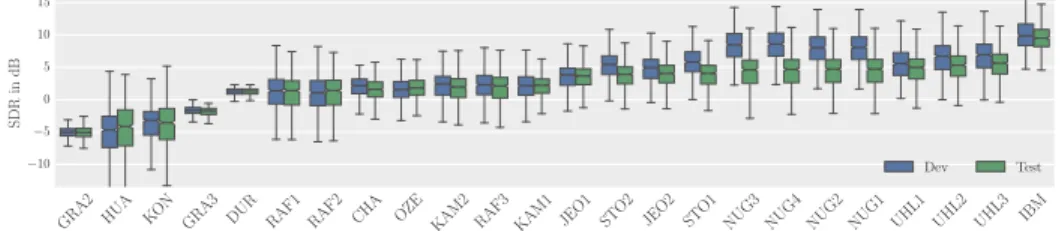
Due to space constraints again, Figure 4 shows the box plots for the SDR of the vocals only, over the whole DSD100 dataset and excluding those few 30 s excerpts for which the IBM method was badly behaved (yielding nan values for its SDR). More results may be found online. For the first time in SiSEC, 30 s excerpts of all separated results may also be found in the webpage dedicated to
2
www.cambridge-mt.com/ms-mtk.htm 3
the results4. The striking fact is that most proposed supervised systems
consid-erably outperform blind methods, a trend that is also noticeable on other SIR, SAR metrics. Also, systems like [38] which use additional augmentation data, seem to generalise better, resulting in a smaller gap between Dev and Test.
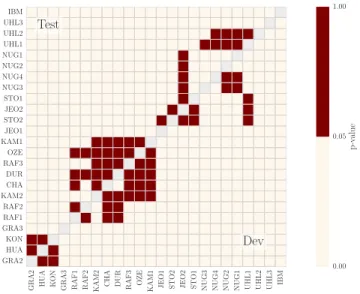
A Friedman test revealed a significant effect of separation method on SDR (Dev: χ2 = 1083.23, p < 0.0001, Test: χ2 = 1004.29, p < 0.0001). Inspired by recent studies [42], we also tested for each pair of method whether the difference in performance was significant. A post-hoc pairwise comparison test (Wilcoxon signed-rank test, two-tailed, Bonferroni corrected) is depicted in Figure 5.
From these pair-wise comparisons, it turns out that state-of-the art mu-sic separation systems ought to feature multichannel modelling (introduced in NUG) and data augmentation (UHL). As depicted by the best scores obtained by UHL3, performing a fusion of different systems is also a promising idea.
GRA2 HUA KON GRA3 DUR RAF1 RAF2 CHA OZE KAM2 RAF3 KAM1 JEO1 STO2 JEO2 STO1 NUG3 NUG4 NUG2 NUG1 UHL1 UHL2 UHL3 IBM −10 −5 0 5 10 15 SDR in dB Dev Test
Fig. 4. Results for the SDR of vocals on MUS task for Dev and Test.
6
Conclusion
In this paper, we reported the different tasks and their results for SiSEC’2016. This edition enjoyed a good participation on the long-run tasks, as well as several novelties. Among those, a new task on biomedical signal processing was proposed this year, as well as important improvements concerning the music separation dataset and accompaniment software.
In the recent years, we witnessed a very strong increase of interest in supervised methods for separation. A corresponding objective of SiSEC is to make it easier for machine learning practitioners to adapt learning algorithms to the task of source separation, widening the audience of this fascinating topic.
In the future, we plan to continue in this direction and focus on two important moves for SiSEC: first, the problem of quality assessment appears as largely unsolved and SiSEC should play a role in this respect. Second, facilitating re-producibility and comparison of research is a challenge when methods involve
4
GRA2 HUA K
ON
GRA3 RAF1 RAF2 KAM2 CHA DUR RAF3 OZE KAM1 JEO1 STO2 JEO2 STO1 NUG3 NUG4 NUG2 NUG1 UHL1 UHL2 UHL3 IBM GRA2 HUA KON GRA3 RAF1 RAF2 KAM2 CHA DUR RAF3 OZE KAM1 JEO1 STO2 JEO2 STO1 NUG3 NUG4 NUG2 NUG1 UHL1 UHL2 UHL3 IBM Test Dev 0.00 0.05 1.00 p-v alue
Fig. 5. P-values of Pair-wise difference of Wilcoxon signed-rank test of SDR vocals over method. (upper triangle: Test, lower triangle: Dev). Values p > 0.05 indicate no significant differences between the two group results.
large-scale machine learning systems. SiSEC will shortly host and broadcast sep-aration results of various techniques along datasets to promote easy comparison with state of the art.
References
1. N. Ono, Z. Koldovsky, S. Miyabe, and N. Ito, “The 2013 Signal Separation Eval-uation Campaign”, in Proc. MLSP, Sept. 2013, pp. 1–6.
2. N. Ono, Z. Rafii, D. Kitamura, N. Ito, and A. Liutkus, “The 2015 signal separation evaluation campaign”, In Proc. LVA/ICA, 2015.
3. E. Vincent, R. Griboval, and C. F´evotte, “Performance measurement in blind audio
source separation,” IEEE Trans. ASLP, vol. 14, no. 4, pp. 1462–1469, Jul. 2006. 4. V. Emiya, E. Vincent, N. Harlander, and V. Hohmann, “Subjective and objective
quality assessment of audio source separation,” IEEE Trans. ASLP, vol. 19, no. 7, pp. 2046–2057, Sep. 2011.
5. N. Mitianoudis, “A Generalised Directional Laplacian Distribution: Estimation, Mixture Models and Audio Source Separation,” IEEE Trans. ASLP, vol. 20, no. 9, pp. 2397–2408, 2012.
6. M. Bouafif and Z. Lachiri, “Multi-Sources Separation for Sound Source Localiza-tion,” in Proc. Interspeech Sept. 2014, pp. 14–18.
7. H. Sawada, S. Araki, and S. Makino, “Underdetermined Convolutive Blind Source Separation via Frequency Bin-Wise Clustering and Permutation Alignment,” IEEE Trans. ASLP, vol. 19, no. 3, pp. 516–527, 2011.
8. A. R. L´opez, N. Ono, U. Remes, K. Palom¨aki, and M. Kurimo, “Designing Multi-channel Source Separation Based on Single-Channel Source Separation,” in Proc. ICASSP, Apr. 2015, pp. 469-473.
9. N. Ito, S. Araki, and T. Nakatani, “Permutation-free convolutive blind source sep-aration via full-band clustering based on frequency-independent source presence priors,” in Proc. ICASSP, May 2013, pp. 3238–3242.
10. Tak-Shing Chan, Tzu-Chun Yeh, Zhe-Cheng Fan, Hung-Wei Chen, Li Su, Yi-Hsuan Yang, and Roger Jang, “Vocal activity informed singing voice separation with the iKala dataset,” in Proc. ICASSP, Apr. 2015, pp. 718–722.
11. J.-L. Durrieu, B. David, and G. Richard, “A musically motivated mid-level repre-sentation for pitch estimation and musical audio source separation,” IEEE Journal on Selected Topics on Signal Processing, vol. 5, no. 6, pp. 1180–1191, Oct. 2011. 12. P. Huang, S. Chen, P. Smaragdis, and M. Hasegawa-Johnson, “Singing-voice
sep-aration from monaural recordings using robust principal component analysis,” in Proc. ICASSP, Mar. 2012, pp. 57–60.
13. A. Liutkus, D. FitzGerald, Z. Rafii, and L. Daudet, “Scalable audio separation with light kernel additive modelling,” in Proc. ICASSP, Apr. 2015, pp. 76–80. 14. A. Nugraha, A. Liutkus, and E. Vincent, “Multichannel music separation with
deep neural networks,” Proc. EUSIPCO, 2016
15. A. Ozerov, E. Vincent, and F. Bimbot, “A general flexible framework for the han-dling of prior information in audio source separation,” IEEE Trans. ASLP, vol. 20, no. 4, pp. 1118–1133, Oct. 2012.
16. Z. Rafii and B. Pardo, “REpeating Pattern Extraction Technique (REPET): A simple method for music/voice separation,” IEEE Trans. ASLP, vol. 21, no. 1, pp. 71–82, January 2013.
17. A. Liutkus, Z. Rafii, R. Badeau, B. Pardo, and G. Richard, “Adaptive filtering for music/voice separation exploiting the repeating musical structure,” in Proc. ICASSP, Mar. 2012, pp. 53–56.
18. Z. Rafii and B. Pardo, “Music/voice separation using the similarity matrix,” in Proc. ISMIR, Oct. 2012, pp. 583–588.
19. S. Uhlich, F. Giron, and Y. Mitsufuji, “Deep neural network based instrument extraction from music,” in Proc. ICASSP, Apr. 2015, pp. 2135–2139.
20. Hakan Erdogan, John R. Hershey, Shinji Watanabe, and Jonathan Le Roux, “Phase-sensitive and recognition-boosted speech separation using deep recurrent neural networks,” in Proc. ICASSP, Apr. 2015, pp. 708–712.
21. L. Wang, “Multi-band multi-centroid clustering based permutation alignment for frequency-domain blind speech separation,” Digit. Signal Process., vol. 31, pp. 79– 92, Aug. 2014.
22. S. Miyabe, N. Ono and S. Makino, “Blind compensation of interchannel sampling frequency mismatch for ad hoc microphone array based on maximum likelihood estimation,” Elsevier Signal Processing, vol. 107, pp. 185–196, Feb. 2015.
23. N. Ono, “Stable and fast update rules for independent vector analysis based on auxiliary function technique,” in Proc. WASPAA, Oct. 2011, pp. 189–192. 24. H. Chiba, N. Ono, S. Miyabe, Y. Takahashi, T. Yamada and S. Makino,
“Amplitude-based speech enhancement with nonnegative matrix factorization for asynchronous distributed recording,” in Proc. IWAENC, Sept. 2014, pp. 204–208. 25. S. Wood and J. Rouat, “Blind speech separation with GCC-NMF,” in Proc.
In-terspeech, 2016.
26. M. Bouafif and Z. Lachiri, “Multi-sources separation for sound source localization,” in Proc. Interspeech pp. 14–18, 2014.
27. J. Cho and C. D. Yoo, “Underdetermined convolutive BSS: Bayes risk minimization based on a mixture of super-Gaussian posterior approximation,” in IEEE Trans. Audio, Speech, and Language Processing, vol. 23, no. 5, pp. 828–839, 2011. 28. K. Adiloglu and E. Vincent, “Variational Bayesian inference for source separation
and robust feature extraction,” Technical Report, INRIA, https://hal.inria.fr/hal-00726146, 2012
29. Y. Hirasawa, N. Yasuraoka, T. Takahashi, T. Ogata and H. Okuno, “A GMM sound source model for blind speech separation in under-determined conditions,” in Proc. International Conference on Latent Variable Analysis and Signal Separation, 2012. 30. K. Iso, S. Araki, S. Makino, T. Nakatani, H. Sawada, T. Yamada and A. Nakamura, “Blind source separation of mixed speech in a high reverberation environment,” in Proc. Hands-free Speech Communication and Microphone Arrays, pp. 36–39, 2011. 31. J. Cho, J. Choi and C. D. Yoo, “Underdetermined convolutive blind source separa-tion using a novel mixing matrix estimasepara-tion and MMSE-based source estimasepara-tion,” in Proc. IEEE MLSP, 2011.
32. F. Nesta and M. Omologo “Convolutive underdetermined source separation through weighted Interleaved ICA and spatio-temporal correlation,” in Proc. In-ternational Conference on Latent Variable Analysis and Signal Separation, 2012 33. C. H. Knapp and G. C. Carter, “The generalized correlation method for estimation
of time delay,” in IEEE Trans. Acoustics, Speech and Signal Processing, vol. 24, no. 4, pp. 320–327, 1976.
34. D. D. Lee and H. S. Seung, “Learning the parts of objects by non-negative matrix factorization,” in Nature, vol. 401, pp. 788–791, 1999.
35. C. Blandin, A. Ozerov and E. Vincent, “Multi-source TDOA estimation in rever-berant audio using angular spectra and clustering,” in Signal Processing, vol. 92, no. 8, pp. 1950–1960, 2012.
36. H.-T.T. Duong, Q.-C. Nguyen, C.-P. Nguyen, T.-H. Tran, and N.Q.K. Duong, “Speech enhancement based on nonnegative matrix factorization with mixed group sparsity constraint,” in Proc. ACM International Symposium on Information and Communication Technology, 2015, pp. 247–251.
37. F.-R. St¨oter, A. Liutkus, R. Badeau, B. Edler, and P. Magron, “Common Fate
Model for Unison source Separation,” in Proc. ICASSP, 2016.
38. S. Uhlich, M. Porcu, F. Giron, M. Enenkl, T. Kemp, N. Takahashi and Y. Mitsufuji, “Improving Music Source Separation Based On Deep Neural Networks Through Data Augmentation and Network Blending” submitted to ICASSP, 2017
39. E. Grais, G. Roma, A.J. Simpson, M. Plumbley, “Single-Channel Audio Source Separation Using Deep Neural Network Ensembles. ” Proc. AES 140, 2016, May.
40. I.-Y. Jeong and K. Lee “Singing voice separation using RPCA with weighted
l1-norm,” Proc. LVA/ICA, 2017
41. P. Huang, M. Kim, M. Hasegawa-Johnson, P. Smaragdis, Joint optimization
of masks and deep recurrent neural networks for monaural source separation. IEEE/ACM Transactions on Audio, Speech, and Language Processing, 23(12), 2136-2147. 2015
42. A. Simpson, G. Roma, E. Grais, R. Mason, C. Hummersone, M. Plumbley, A. Liutkus, “Evaluation of Audio Source Separation Models Using Hypothesis-Driven Non-Parametric Statistical Methods ” proc EUSIPCO 2016