HAL Id: hal-00375841
https://hal.archives-ouvertes.fr/hal-00375841v3
Submitted on 17 Nov 2009
HAL is a multi-disciplinary open access
archive for the deposit and dissemination of
sci-entific research documents, whether they are
pub-lished or not. The documents may come from
teaching and research institutions in France or
abroad, or from public or private research centers.
L’archive ouverte pluridisciplinaire HAL, est
destinée au dépôt et à la diffusion de documents
scientifiques de niveau recherche, publiés ou non,
émanant des établissements d’enseignement et de
recherche français ou étrangers, des laboratoires
publics ou privés.
Lévy flights of photons in hot atomic vapours
Nicolas Mercadier, William Guerin, Martine Chevrollier, Robin Kaiser
To cite this version:
Nicolas Mercadier, William Guerin, Martine Chevrollier, Robin Kaiser. Lévy flights of photons in hot
atomic vapours. Nature Physics, Nature Publishing Group, 2009, 5, pp.602. �hal-00375841v3�
N. Mercadier1, W. Guerin1, M. Chevrollier2, and R. Kaiser1∗
1
Institut Non Lin´eaire de Nice, CNRS and Universit´e de Nice Sophia-Antipolis, 1361 route des Lucioles, 06560 Valbonne, France,
2
Universidade Federal da Paraiba, Cx. Postal 508, 58051-900 Joao Pessoa-PB, Brazil (Dated: November 17, 2009)
Properties of random and fluctuating systems are often studied through the use of Gaussian distributions. However, in a number of situations, rare events have drastic consequences, which can not be explained by Gaussian statistics. Considerable efforts have thus been devoted to the study of non Gaussian fluctuations such as L´evy statistics, generalizing the standard description of random walks. Unfortunately only macroscopic signatures, obtained by averaging over many random steps, are usually observed in physical systems. We present experimental results investigating the elementary process of anomalous diffusion of photons in hot atomic vapours. We measure the step size distribution of the random walk and show that it follows a power law characteristic of L´evy flights.
Random walk of particles in a disordered or fluctuating medium is often well described by a diffusion equation, characterized by a linear increase in time of the mean square displacement of the particles: < r2 >= Dt, with
D the diffusion coefficient. One assumption for the dif-fusion equation to hold is that the size x of each step of the random walk is given by a distribution P (x) with a finite second moment < x2>, allowing to apply the
cen-tral limit theorem. When the step size distribution P (x) follows an asymptotic power law P (x) ∼ 1/xα, the
mo-ments of the distributions can however become infinite. It has been long established that for α < 3, the aver-age square displacement is governed by rare but large steps [1]. Such a class of random walk is called L´evy flights, corresponding to a superdiffusive behaviour where < r2>= Dtγ, with γ > 1. The broad range of
applica-tions of L´evy flights includes biology, economics, finance, catastrophe management and resonance fluorescence in astrophysical systems and atomic vapours [2, 3, 4, 5]. Large (non Gaussian) fluctuations also play a fundamen-tal role in many physical situations, in particular around phase transitions, having triggered considerable efforts to understand universal features of such phenomena [6, 7].
Anomalous transport of photons has been reported re-cently in engineered optical material [8]. Superdiffusive behavior of light has also been known in the context of ra-diation trapping in hot atomic vapors. Because this phe-nomenon occurs in many different systems, ranging from stars [9] to dense atomic vapours [10] such as gas lasers, discharges and hot plasmas, this field has been subject to intense studies for many decades, including seminal work by Holstein [11]. It has been realized very early [12] that frequency redistribution has a profound impact on the multiple scattering features of light. Whereas elas-tic scattering, which occurs in laser-cooled dilute atomic vapours [13, 14, 15], leads to normal diffusion with well defined scattering mean free path and diffusion
coeffi-∗Electronic address: Robin.Kaiser@inln.cnrs.fr
cient, inelastic scattering as in hot vapours can lead to situations where the central limit theorem no longer ap-plies and photon trajectories are expected to be L´evy flights. Unfortunately, in most systems where multiple scattering of light occurs, it is difficult to have direct ex-perimental access to the single step size distribution at the origin of the random walk and anomalous diffusion is usually inferred from macroscopic observations [8, 10].
In this Article we present experimental results inves-tigating the microscopic ingredient leading to a regime of superdiffusion in the multiple scattering of light in hot vapours of rubidium atoms. We have used a spe-cific geometrical arrangement to isolate a single step in the multiple scattering sequence. We measure the single step size distribution P (x), which follows a power law P (x) ∝ 1/xα, with α < 3. Therefore the photon
trajec-tories are L´evy flights, with an infinite variance of P (x). The random walk of light in atomic vapours is usu-ally characterized by the various moments of the step size distribution P (x). One can define a mean free path by ℓ = hxi =R∞
0 xP (x)dx and a diffusion
coeffi-cient from the variance σ2
xof the distribution. For
pho-tons at frequency ω, this step size distribution P (x, ω) is deduced from P (x, ω) = −∂T (x,ω)∂x , where T is the forward transmission given by the Beer-Lambert’s law T (x, ω) = e−x/ℓ(ω), with the frequency dependant mean
free path ℓ(ω). This results in an exponential distribution P (x, ω) = 1
ℓ(ω)e
−x/ℓ(ω). (1)
While these considerations give a good description for atoms close to zero temperature [13, 14, 15], most sam-ples in and outside laboratories present a Doppler broad-ening ∆ωD much larger than the natural linewidth Γ of
the optical transition. The normalized spectrum Θ(ω) of the light in the multiple scattering regime then influences the properties of its random walk [12]. For instance pho-tons with a frequency in the wings of the absorption line will travel over a much larger distance than photons at the center of the absorption line. The step size distribu-tion P (x) is obtained by a frequency average of P (x, ω)
2 [Eq. (1)] weighted by the spectrum Θ(ω):
P (x) = Z +∞ 0 Θ(ω) × 1 ℓ(ω)e −x/ℓ(ω)dω . (2)
The subsequent single step size distribution of light in an atomic vapour can be numerically computed given the knowledge of the emission spectrum Θ(ω) and of the ab-sorption spectrum 1/ℓ(ω) (see the Methods section). An analytical expression can be obtained in some limiting cases. For instance, assuming that the emission and ab-sorption spectra are purely Gaussian (as given by pure Doppler broadening and neglecting the atomic natural Lorentzian absorption line), then the single step size dis-tribution asymptotically follows [11, 16]:
P (x) ∼ 1 x2pln(x/ℓ
0)
, (3)
where ℓ−1
0 = natσ0 with nat the atomic density and σ0
the scattering cross section at the atomic resonance. This heavy tail distribution leads to L´evy flights of light. As explained above, the underlying mechanism of this power law is a frequency average of the Beer-Lambert transmis-sion, as different frequency components are not scattered after the same distance.
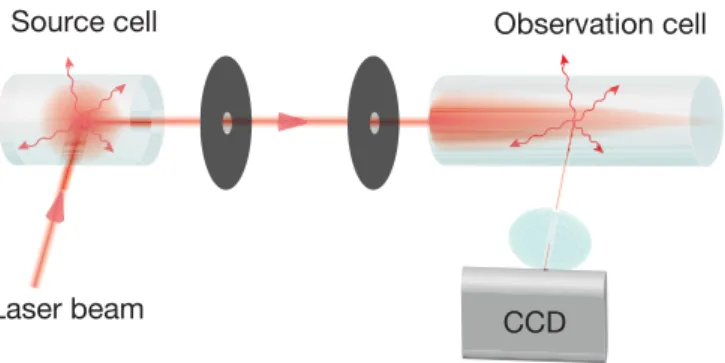
To measure this step size distribution, we have used a specific multicell arrangement as shown in Fig. 1. We image on a cooled charge coupled camera (CCD) the fluo-rescence of a natural isotopic mixture of rubidium atoms in a long cylindrical observation cell, illuminated along its axis. We thus measure the probability of a photon to be scattered after a distance x along the cell axis, i.e. the step size distribution P (x).
As a reference, we first measure P (x) in the case when the observation cell is illuminated by a monochromatic incident laser, locked to the F = 3 → F′
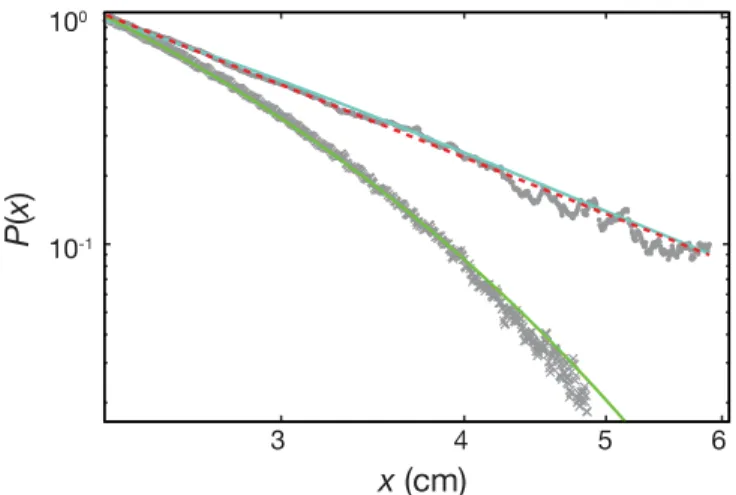
= 4 transition of the D2 line of rubidium 85. From the corresponding image [Fig. 2(a)] we extract an exponential step size dis-tribution as expected from Beer-Lambert’s law [Eq. (1) & Fig. 3]. This preliminary measurement allows the cal-ibration of the mean free path for resonant light and thus the atomic density, which can be varied by adjusting the temperature of the observation cell from 20◦
C to about 47◦
C. The atomic density thus varies from 9 × 10¹⁵ to
2 × 10¹⁷ m−3, and the mean free path changes
accord-ingly from 50 mm to 5 mm.
To measure L´evy flights of light we use a double cell configuration [Fig. 1]. Our 11 mW, 2 mm-waist laser beam is incident on a first, small cylindrical cell of ru-bidium of optical thickness 0.2, where photons undergo at most one scattering event with a well defined position. A 2 mm-diameter pencil of diffused light propagating in a direction orthogonal to the initial laser beam is then selected by two 12 cm-spaced diaphragms. This scheme produces photons with a frequency spectrum Θ(ω) given by the Doppler broadening. If we neglect the finite but small width of the atomic transition, the absorption spec-trum is also purely Doppler, and Eq. (3) holds. The scat-tered light then goes through the 7 cm-long observation
Source cell Observation cell
Laser beam CCD
FIG. 1: The experimental setup. A laser beam is in-cident on a so-called source cell filled with rubidium vapour. Scattered light propagating at orthogonal direction is selected with two diaphragms and illuminates a second, observation cell. The light scattered in this second cell is imaged on a cooled CCD camera. This fluorescence signal is proportional to the step size distribution function.
cell, with an angle of about 10◦
from the cell axis to avoid stray reflections at the center of the image. Raw images of the fluorescence signal are obtained after a 30 minutes exposure. Reproducible noise is then eliminated by sub-tracting a dark frame. The resulting image is shown in Fig. 2(b). We extract the corresponding step size dis-tribution P (x) (shown on a log-log scale in Fig. 3) by taking longitudinal slices along the incident direction of propagation. This signal is integrated over 30 lines of the CCD matrix (corresponding to 1.6 mm in the cell), then smoothened over 30 pixels along the x direction to increase the signal to noise ratio. In order to obtain the correct P (x) distribution, we need to correct the effect of multiple scattering on the signal. We thus subtract the intensity measured along a slice slightly off the line of sight of the diaphragms, which is due only to multiple scattering, from the intensity measured on the central slice (see the Methods section). We clearly identify a
FIG. 2: Fluorescence images Data are obtained after an exposure time of 30 minutes and dark frame subtraction, for (a) an incident laser beam at the atomic resonance frequency and (b) incident light provided by a first scattering cell. The temperature of the observation cell is 41◦C. The step size distribution is extracted from the intensity along the axis.
3 4 5 6 10-1 100
x (cm)
P
(x
)
FIG. 3: Single step size distributions P (x) plotted in log-log scale. For an incident monochromatic laser beam of frequency ω (crosses), P (x) shows an exponential decrease, as shown by the green continuous fitting line. For an incident Doppler-broadened field originated from a first scattering cell (dots), P (x) has a power law decrease, well fitted by P (x) ∼ 1/xα with α = 2.41 ± 0.12 (red dashed line), characteristic of L´evy flights. A microscopic model, taking into account all hyperfine levels and Raman transitions, is shown as the blue continuous line. Without any free parameter except the vertical intensity scale, the agreement with the experimental data is very satisfactory.
power law, which can be fitted by: P (x) ∼ 1
xα, with α = 2.41 ± 0.12. (4)
This decay is in clear contrast to the exponential decay for the monochromatic incident field. Note that within our range of parameters a fit with 1/(xαpln(x/ℓ
0)) is not
noticeably different from the pure power law fit of Eq. (4). We have also checked that varying the atomic den-sity in the observation cell from 7 × 10¹⁶to 2 × 10¹⁷m−3
has no impact on the measured value of α.
This result calls for two important comments. First, the exponent α is smaller than 3. We can thus not ig-nore the heavy tails of the step size distribution. The variance of P (x) is infinite, making this distribution char-acteristic of L´evy flights. Second, we measure an impor-tant difference compared to the prediction α = 2 ex-pected when the natural width Γ of the atomic tran-sition is neglected [Eq. (3)]. Even though this width Γ/2π = 6 MHz is much smaller than the Doppler broad-ening ∆ωD/2π ∼ 220 MHz, one cannot neglect the
ef-fect of the natural Lorentzian line shape on the atomic absorption profile. In the opposite limit of negligible Doppler broadening (∆ωD ≪ Γ) one expects to recover
the cold-atom limit, where all momenta of the step size distribution are finite. It is thus not surprising that the actual case of a finite natural width does increase the ab-solute value of the exponent from the ideal Doppler limit, where α = 2. A power law fit to the step size distribution
P (x) obtained by including this finite natural width in the numerical integration of Eq. (2) yields an exponent of 2.3, close to the experimental value. We have also im-plemented a more refined model, taking into account all hyperfine levels of rubidium atoms including the hyper-fine Raman transitions (see the Methods section). The result of this numerical calculation is in excellent agree-ment with the experiagree-mental data as shown in Fig. 3. Although the finite natural line width is only a few per-cents of the Doppler width, it surprisingly changes the power law exponent by 15%. The measured difference to α = 2 has a particular significance, as for α ≤ 2, even the mean free path is no longer defined, in contrast to α > 2 where hxi is still finite.
The knowledge of the single step size distribution for photons which have been scattered only once by hot atoms is however not sufficient to describe the multiple scattering regime. Indeed, the spectral characteristics of the photons depend on their previous history. For in-stance, at angles close to forward scattering, the Doppler broadening is very small and the scattering can be con-sidered to be almost elastic. This feature is described by a partial frequency redistribution of the photons during their multiple scattering process [10] and can be under-stood as a memory effect in the random walk sequence. In order to have experimental access to the step size dis-tribution (and therefore to its exponent in case of power laws) in a multiple scattering regime, it is important to extract the single step size distribution of a photon that has been scattered several times by hot atoms.
To determine numerically the shape of the step size distribution Pn for photons after n scattering events, we
compute the evolution of the spectrum Θn of scattered
light, taking into account Doppler broadening and aver-aging over the scattering angles [17]. Pnis then obtained
by using Eq. (2) with Θn (see the Methods section).
The numerics show that Pn quickly converges towards a
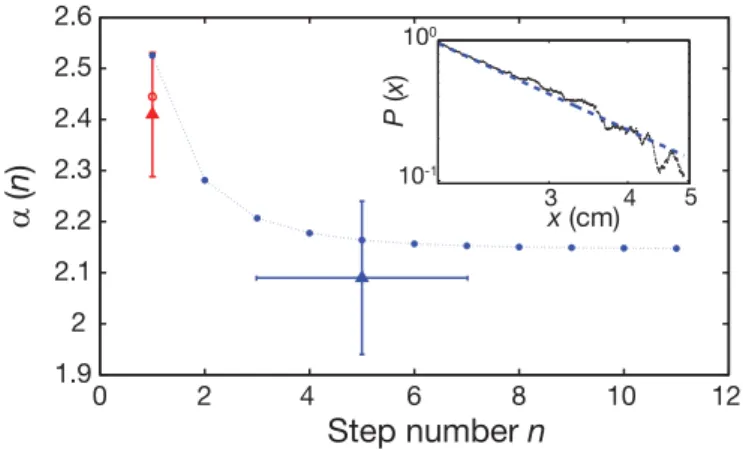
power law, which is independent of the initial frequency, and hence, that the step size distribution of light in the multiple scattering regime is well defined. The corre-sponding power law exponent α(n) is reported on Fig. 4.
In order to approach experimentally the situation of multiple scattering, we have implemented a triple cell geometry. In a first cell, with an on-resonance optical thickness on the order of 2, we prepare photons that have been scattered several times (n ∼ 4) when they leave the cell. Those photons have thus no memory of their ini-tial direction and their properties are well described by an angular average of the fluorescence spectrum. These photons are then sent towards the “source cell” of Fig. 1, which still has a low optical thickness. Photons thus undergo one more scattering event with a well defined position before they can arrive onto the observation cell. This experimental protocol allows us to produce photons which have done multiple scattering and forgotten their initial direction and frequency, as required for a steady state situation. We then record the image of the
fluores-4 0 2 4 6 8 10 12 1.9 2 2.1 2.2 2.3 2.4 2.5 2.6
α
(n
)
Step number n
3 4 5 10-1 100 x (cm) P (x )FIG. 4: Evolution of the power law exponent. The double cell configuration (n = 1) [Fig. 1] yields at 90◦ a pure Doppler-broadened spectrum and the measured α (red triangle) is α = 2.41 ± 0.12. For the triple cell configuration, photons are scattered about 5 times before entering the obser-vation cell. The measured exponent is then α = 2.09 ± 0.15 (blue triangle). The data and fit for this last configuration are shown in the inset. Vertical error bars represent the un-certainty of the power law fit. The blue dots are numerically computed with the real atomic structure and an angular aver-age of the Doppler-broadened frequency spectrum. For com-parison with the experiment, the open red circle is computed without angular average.
cence on the CCD. The signal in this geometry is much weaker than in the previous double cell geometry and is limited by photon shot noise and cosmic rays. From the median averaging of 6 images corresponding to an ex-posure time of 5 hours each, we are still able to extract the step size distribution P (x) after multiple scattering and obtain a value α = 2.09 ± 0.15 [Fig. 4]. This value, clearly below 3, excludes a diffusion approach to be used for multiple scattering of light in hot atomic vapours. This experimental result is in good agreement with our numerical estimation of the power law, taking into ac-count all details of the atomic transition [Fig. 4].
To conclude, we have directly measured the step size distribution of photons undergoing a random walk in hot atomic vapours. Despite a memory effect due to par-tial frequency redistribution, the step size distribution of photons in hot atomic vapours converges after a few steps to a power law with a diverging second moment. Therefore photon trajectories in such a system are L´evy flights. The experiments described in this article show how it is possible to obtain direct information on the mi-croscopic ingredient leading to superdiffusion of light in hot atomic vapours and open the path to study the role of other broadening mechanisms, such as pressure broad-ening or inelastic scattering at large intensities, where the absorption cross sections still have Lorentzian wings, as for natural broadening. However, in these cases, the emission spectra are very different as one no longer has coherent emission processes, and one expects in that case
that P (x) follows a power law with an exponent 1.5 lead-ing to an infinite mean free path [16]. Finally, truncated L´evy flights [18] could be considered to deal with finite-size samples or, on the other hand, with very large sys-tems, if the step size distribution exhibits a cutoff at long distance [17].
Methods
Correction of multiply scattered light. The required dynamic to determine the asymptotic behavior of P (x) needs a fine trade-off between the amount of single scattering and the need to avoid multiple scattering in the observation cell. This is adjusted by the cell temperature and the subsequent atomic density. At 41◦C, the temperature used for our measurements, this density is about 7 × 10¹⁶
m−3, as deduced from the laser beam attenuation. The mean free path for resonant photons is then ∼ 9 mm, and the effect of multiple scattering cannot be totally neglected. It can however be corrected. The intensity measured along the axis of the incident light beam can indeed be written I(x, 0) = I1(x, 0) + In≥2(x, 0), where I1 is the intensity due to single scattering of ballistic photons, In≥2 the one due to multiple scattering. Slightly off the axis, however, only In≥2 remains. Assuming a smooth variation of In≥2(x, d) at distances d much smaller than the mean free path of resonant light we use I2(x, d) ≃ I2(x, 0) to subtract higher order scattering along the center of the cell. Hence, we get P (x) ∝ I1(x, 0) ∝ I(x, 0) − I(x, d). Step size distribution measurements are thus obtained by subtracting intensity signals observed on and off the ballistic beam axis. A Monte Carlo simulation, which can track the position of a photon emerging from the observation cell and register the number of scattering it has performed, confirmed that this procedure efficiently filters single scattering events in the observation cell.
Numerical calculation of the step size distribution for real atoms. The step size distribution is computed from Eq. (2) with the knowledge of the frequency-dependent mean-free path ℓ(ω) (the inverse of which is the absorption spectrum) and the emission spectrum Θ(ω). The mean free path at frequency ω is given by 1 ℓ(ω)= nat Z +∞ −∞ σ“ω(1 −vx c ) ” PM,1(vx)dvx, (5) where natis the atomic density, PM,1is the Maxwell distribu-tion of atomic velocities vx along the direction of light prop-agation x in the observation cell, and σ is the atomic cross-section, taken at the Doppler-shifted frequency ω(1 − vx
c). The emission spectrum in the first cell is given by
Θ1(ω) ∝ Z +∞ 0 dω′ Z+∞ −∞ dvx Z +∞ −∞ dvyΘ0(ω′) σ “ ω′(1 −vy c ) ” ×PM,2(vx, vy) δ “ ω − ω′(1 −vy c)(1 + vx c) ” , (6)
where Θ0(ω′) is the spectrum of the incident laser propagat-ing along y, ωat= ω′(1 −
vy
c ) is the incident photon frequency in the atomic rest frame for atoms at velocity vyalong y, and ωat(1 +vcx) is the frequency in the laboratory frame of the photon emitted along x, towards the second cell. PM,2is the Maxwell distribution of atomic velocities along two directions.
The Dirac distribution inside the integral denotes the energy conservation during coherent scattering, the only change in frequency coming from Doppler shifts. We take as the laser spectrum Θ0 a Lorentzian of width 0.6 MHz. With two-level atoms, the cross-section σ is Lorentzian-shaped (natural width Γ/2π = 6.07 MHz) and we obtain the first order step size distribution by reporting Eqs. (1,5,6) into Eq. (2). Tak-ing into account all the levels of rubidium atoms is done by writing the scattering cross-section as the sum of all the pos-sible transitions weighted by their respective strength factors and with the hypothesis of an equipartition of atomic popu-lation among all possible states.
The multiple scattering regime is characterized by the nth order step size distribution function, which is computed by
using Θn(ω) instead of Θ(ω) in Eq. (2). The evolution of the spectrum, taking into account Doppler broadening and averaging over the scattering angles [17], is then given by
Θn(ω) = Z+∞ −∞ Θn−1(ω′) R(ω, ω′) Φ(ω′) dω ′, (7)
where Φ(ω′) ∝ 1/ℓ(ω′) is the absorption spectrum and R is the joint laboratory frame redistribution function of the scatterers, which gives the probability for a photon at a fre-quency ω′to be scattered at a frequency ω [10]. We take for the redistribution function R the average over all the possible transitions of the standard redistribution function of a Voigt absorption profile [10].
[1] L´evy, P. Theorie de l’Addition des Variables Aleatoires (Gauthier-Villiers, Paris, 1937).
[2] Bouchaud, J.-P. and Georges, A. Anomalous diffusion in disordered media: Statistical mechanisms, models and physical applications. Phys. Rep. 195, 127–293 (1990). [3] Shlesinger, M., Zaslavsky, G., Frisch, U., Eds., L´evy
Flights and Related Topics in Physics (Springer-Verlag, New York, 1995).
[4] Metzler, R. and Klafter, J. The random walk’s guide to anomalous diffusion: a fractional dynamics approach. Phys. Rep. 339, 1–77 (2000).
[5] Bouchaud, J.-P. and Potters, M. Theory of Finan-cial Risk and Derivative Pricing(Cambridge University Press, 2003).
[6] Botet, R. and Ploszajczak, M. Universal Fluctuations (World Scientific, Singapore, 2002).
[7] Goldenfeld, N. D. Lectures on Phase Transitions and the Renormalisation Group(Addison-Wesley, 1992). [8] Barthelemy, P., Bertolotti, J., and Wiersma, D. S. A
L´evy flight for light. Nature 453, 495–498 (2008). [9] Springmann, U., Multiple resonance line scattering and
the “momentum problem” in Wolf-Rayet star winds. As-tron. Astrophys. 289, 505–523 (1994).
[10] Molisch, A. F. and Oehry, B. P., Radiation Trapping in Atomic Vapours(Oxford University, Oxford, 1998). [11] Holstein, T. Imprisonment of Resonance Radiation in
Gases. Phys. Rev. 72, 1212–1233 (1947).
[12] Kenty, C. On Radiation Diffusion and the Rapidity of
Escape of Resonance Radiation from a Gas. Phys. Rev. 42823–842 (1932) .
[13] Fioretti, A., Molisch, A. F., Mutter, J. H., Verkerk, P. and Allegrini, M. Observation of radiation trapping in a dense Cs magneto-optical trap. Opt. Commun. 149, 415–422 (1998).
[14] Labeyrie, G. et al. Slow Diffusion of Light in a Cold Atomic Cloud. Phys. Rev. Lett. 91, 223904 (2003). [15] Labeyrie, G., Kaiser, R. and Delande, D. Radiation
trap-ping in a cold atomic gas. Appl. Phys. B 81, 1001–1008 (2005).
[16] Pereira, E. , Martinho, J. M. G. and Berberan-Santos, M. N. Photon Trajectories in Incoherent Atomic Radiation Trapping as L´evy Flights. Phys. Rev. Lett. 93, 120201 (2004).
[17] Alves-Pereira, A. R., Nunes-Pereira, E. J., Martinho, J. M. G. and Berberan-Santos, M. N. Photonic superdif-fusive motion in resonance line radiation trapping Par-tial frequency redistribution effects. J. Chem. Phys. 126, 154505 (2007).
[18] Mantegna, R. N. and Stanley, H. E. Stochastic Process with Ultraslow Convergence to a Gaussian: The Trun-cated L´evy Flight. Phys. Rev. Lett. 73, 2946–2949 (1994).
Acknowledgements
We acknowledge financial support from the program ANR-06-BLAN-0096 and funding for N.M. by DGA.