HAL Id: hal-01578674
https://hal.archives-ouvertes.fr/hal-01578674
Submitted on 29 Aug 2017
HAL is a multi-disciplinary open access
archive for the deposit and dissemination of
sci-L’archive ouverte pluridisciplinaire HAL, est
destinée au dépôt et à la diffusion de documents
Active infrared polarimetric imaging demonstrator by
orthogonality breaking sensing
François Parnet, Julien Fade, Noe Ortega-Quijano, Goulc’Hen Loas, Ludovic
Frein, Mehdi Alouini
To cite this version:
François Parnet, Julien Fade, Noe Ortega-Quijano, Goulc’Hen Loas, Ludovic Frein, et al.. Active
in-frared polarimetric imaging demonstrator by orthogonality breaking sensing. SPIE Optics+Photonics,
SPIE, Aug 2017, San Diego, United States. �10.1117/12.2273309�. �hal-01578674�
Active infrared polarimetric imaging demonstrator by orthogonality
breaking sensing
François Parnet*, Julien Fade, Noé Ortega-Quijano, Goulc’hen Loas, Ludovic Frein, Mehdi Alouini
Institut FOTON, Université de Rennes 1, CNRS UMR 6082, Rennes, France.
ABSTRACT
We report the design of a free-space active infrared polarimetric imaging demonstrator operating at 1.55 µm and based on a non-conventional approach: the orthogonality breaking sensing technique. Relying on the illumination of a scene with a specific light source, the imager offers an original tradeoff between image acquisition time (~ 1 s) and polarimetric consistency in comparison to standard polarimetric imagers such as division of time or division of amplitude systems. We will illustrate the capability of such an imager to enhance the visibility of hidden objects on homemade scenes.
Keywords: Active polarimetric imaging, polarization-maintaining fibers, radio-frequency photonics, dichroism
characterization
1. INTRODUCTION
Active polarimetric imaging is useful to enhance visibility of man-made objects among natural environment. While passive imaging is dependent of ambient illumination, active imaging can provide consistent results independently from the sunlight conditions. Moreover, the use of polarized light increases advantageously the available contrasts between non-depolarizing objects and a strongly depolarizing background in comparison to passive imaging. Towards target detection applications, the use of near infrared (NIR) illumination ensures a stealthy raster scan of the scene. At the same time, it reduces drastically the ocular hazard when operating with powerful illumination source, as the first layers of the eye absorb strongly infrared light thus preserving the retina. In the literature, most of the NIR active polarimetric imagers use the OSC technique1–5 since it is able to discriminate non-depolarizing man-made objects from a depolarizing natural environment with only two acquisitions using crossed polarizers at the analysis.
Recently, we have proposed an alternative technique to perform polarimetric measurement: the depolarization/dichroism sensing by orthogonality breaking (DSOB) technique, which enables the characterization of dichroism and/or depolarizing samples at high speed6–8. This technique relies on the use of a specific light source, namely a Dual-Frequency Dual-Polarization (DFDP) laser beam, that comprises two electromagnetic fields superimposed with orthogonal states of polarization and slightly shifted in frequency [with frequency detuning Δν lying in the radiofrequency range (MHz-GHz)]. When interacting with a diattenuator, potentially non-depolarizing or including partial depolarization (local dichroism heterogeneities), both states of polarization of the source may be partially projected onto each other, thus resulting in the breaking of the polarization orthogonality and the generation of a beatnote signal at the frequency shift Δν. Provided that the photodetectors bandwidth is greater than the frequency shift Δν, the beat note intensity can be measured, thus giving access to the dichroic/depolarization properties at high speed and high dynamic range due to heterodyne detection. In previous works8,9, we have demonstrated that using a DFDP light source with circular states of polarization, all dichroism properties could be obtained in one single acquisition. In contrast with standard polarimetric techniques, this alternative approach is free from polarizing elements at the emission and the analysis of the light, which makes it a good candidate for endoscopic polarimetric imaging through optical fibers6,10.
In this work, we report the design and the characterization of an active polarimetric imaging demonstrator based on the DSOB technique to enhance contrasts in real time on macroscopic scenes for target detection applications. We will show that this demonstrator offers an interesting trade-off between total acquisition time, resolution, and polarimetric consistency to enable imaging dynamic scenes (moving objects and/or through air turbulences). We will show imaging results on in-lab scenarios that illustrate the main advantages and drawbacks of the demonstrator.
2. DESCRIPTION OF THE DEMONSTRATOR
The imaging demonstrator comprises six building blocks denoted by letters (a) to (f) in the schematic view displayed on Figure 1. Below, we describe all these elements that allow registering DSOB images, but we provide first a brief overview of this setup.
Figure 1. Active DSOB polarimetric imaging demonstrator at 1.55 µm for 2 m in-lab imaging.
The DFDP coherent source at λ = 1,55 µm [Figure 1(a)] generates a beam with two linearly and orthogonally polarized electrical fields shifted in frequency by Δν = 80 MHz. The transverse electrical field can be expressed as: E
⃗⃗ (t)= E0⁄√2e-i2πυ1t(e⃗ 1+ei2πΔυte⃗ 2), with E0, the electrical field amplitude, Δν=ν1-ν2, the frequency shift between the two orthogonal electrical fields (assumed perfectly balanced in intensity), e⃗ 1 and e⃗ 2, the Jones vectors of the two linear states of polarization. A polarizing maintaining (PM) fibered splitter sends 10% of the DFDP beam to the reference stage [Figure 1(b)] that produces a local oscillator (LO) signal at the frequency Δν for signal demodulation. The other output of the splitter collimates in free space the major portion of the DFDP source whose linear states of polarization can be turned into circular through a removable quarter waveplate. The light beam is displaced and focused on the scene by a pair of galvanometric mirrors and beam-forming optics [Figure 1(c)]. The light backscattered by the scene is collected by the imaging system through the same optics while the raster scanning device demodulates the path of light to direct it towards the detection module [Figure 1(d)]. A high speed avalanche photodiode, whose bandwidth is 100 MHz, detects the light. The photodiode delivers a signal comprising mean (DC) and modulated (AC) components which are used to retrieve the mean intensity and the beatnote intensity respectively. The high frequency AC-component is demodulated through a homemade synchronous demodulation circuit [Figure 1(e)] so that two continuous quadratures I and Q are obtained in real time. Lastly, the three raw signals (DC, I and Q) are digitized by an analog-to-digital conversion module [Figure 1(f)] and are recorded on a computer, which also ensures automated control of the acquisition task and building-up of the images.
2.1 Dual-frequency dual-polarization fibered source at 𝝀 = 1.55 µm
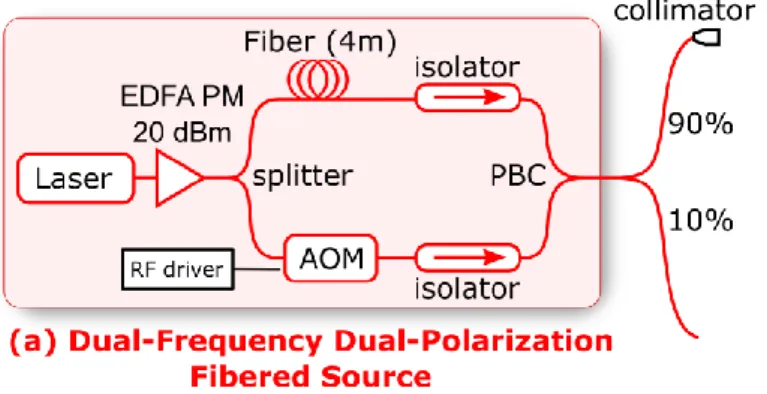
The DFDP laser beam at λ= 1.55 µm is generated from the propagation of a commercial single-mode laser through a polarization sensitive Mach-Zehnder (MZ) architecture (see Figure 2). An acousto-optic modulator (AOM), inserted in one arm, induces the frequency detuning Δν. Such DFDP source has been built in free space at λ= 488 nm for confocal microscopy7,8. We transposed this approach to develop a dedicated DFDP light source at λ= 1.55 µm with telecom optical fiber components that ensure easy alignment, robustness and compactness. Thus, a tunable continuous fiber laser (Yenista, Tunics 100HP-CL) is amplified by a homemade polarization maintaining erbium-doped fiber amplifier (EDFA) (output power of 20 dBm at λ= 1.55 µm). A PM splitter sends 70% of the beam power through a fibered AOM that introduce a frequency shift Δν of 80 MHz. Then, both arms are combined with a polarizing beam combiner (PBC) which superimposes both beams with orthogonal states of polarization to finally generate the desired DFDP beam. In-line polarizer isolators are included at the termination of each arm of the MZ architecture to increase polarization purity and to block reflections from entering the source. All fibered components of the MZ architecture are enclosed in a fitted box (200x150x30 mm) filled with foam to limit thermal and mechanical stress and thus reduce fluctuations of the optical path difference between the two arms that could hinder correct demodulation of the detected signal.
Figure 2. Dual-frequency dual-polarization (DFDP) fibered source at 𝜆 = 1.55 µm.
It is essential to note that the optical path length of both arms of such a MZ architecture should be precisely equalized. Indeed, with unbalanced arm lengths, a beatnote signal is produced from the interference of the beam with itself with a temporal delay. Thus, the front laser phase noise is probed, as illustrated with the beatnote signal from the reference stage [Figure 1(b)] on Figure 3(a). This is why strongly unbalanced Mach Zehnder interferometers are commonly used to characterize laser phase noise11. In this setup, such fluctuations could hinder correct demodulation of the signal, or at least reduce the available demodulation bandwidth. Figure 3(b) illustrates the importance of proper balancing of the two arms in order to cancel laser induced temporal jitter of the beatnote and thus to ensure correct demodulation of the beatnote signal. The required balance accuracy depends on the laser linewidth and was found to be few centimeters in our setup.
Figure 3. Comparison of the reference signal obtained with unbalanced (a) and well-balanced (b) arm lengths of the MZ architecture used to produce the DFDP illumination. Green curves (upper curves on each image) represent the electronic reference at 80 MHz obtained from the AOM driver. Yellow curves (lower curves on each image) show the beat note intensity delivered by a fibered photodiode after projection of the orthogonal polarizations of the DFDP beam through a polarizer.
2.2 Demodulation reference
10% of the DFDP light source is extracted with a PM splitter followed by a standard SMF-28 fiber, an in-line fiber polarization controller (PC) and a polarizer (PM isolator) (see Figure 4). These components enable maximal projection of the two states of polarization so that the detection of the beam on a fibered InGaAs photodiode gives rise to a reference signal at Δν = 80 MHz used as a local oscillator signal for the demodulation operation [see paragraph 2.5].
2.3 Scene illumination
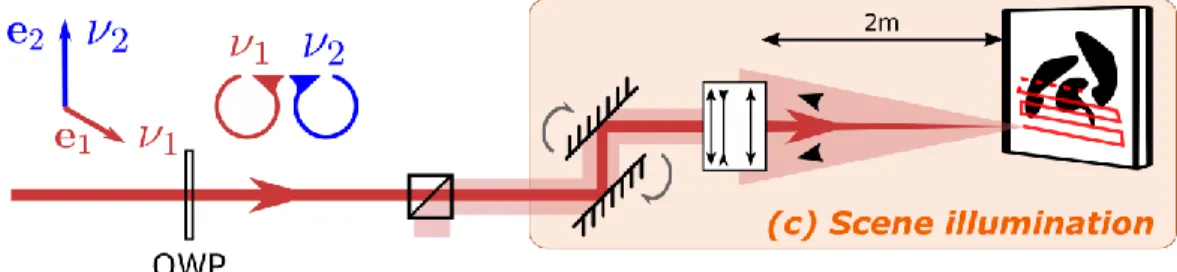
80% (experimental value) of the DFDP light source is directed to a collimation lens (Newport, F-H10-IR-APC) by the other output of the PM splitter so that the beam is collimated in free space to illuminate the scene (see Figure 5). A quarter waveplate (QWP) can be inserted in the path of light with its eigenaxes oriented at 45° from both orthogonal linear polarizations to turn linear states of polarization into circular (left/right) ones. The beam goes through a 50/50 polarization insensitive beamsplitter cube at 1.55 µm which sends backscattered light from the scene towards the photodetector. The transmission of the cube being measured to 44%, about 35% of the initial DFDP beam attains the raster scanning apparatus.
Figure 5. Scene illumination block of the demonstrator scheme.
The laser beam is swept on the scene by a pair of galvanometric mirrors (Cambridge Technology, 6220H) controlled by computer. The light is focused on the scene at a distance of 2 m from the beam-forming optics which comprise three lenses arranged in a Cooke triplet with respective focal lengths 175 mm, -75 mm and 150 mm and near infrared anti-reflection coating. This configuration ensures a focus depth of ± 10 cm as well as reduced optical aberrations. It can be noticed that laser scanning imaging maximizes the optical power deposited at each location of the scene while laser operation in the NIR range (1.55 µm) reduces considerably ocular hazards. Consequently, this imaging system could be adapted to long range imaging for real outdoor scenarios at the expense of an increase of the laser optical power. Light backscattered by the scene is partially collected by the beam-forming optics and then directed toward the photodiode by the galvanometric mirrors and the beamsplitter [reflection coefficient of 44% (experimental value)].
2.4 Detection
The collected light is focused by a 50 mm NIR anti-reflection coated lens on an avalanche photodiode (APD) that comprises an integrated transimpedance amplifier with a 100 MHz bandwidth (Princeton, PLA-641). The APD module includes two outputs, commonly used in differential mode, but that we diverted to retrieve separately the mean intensity (DC) and the beatnote intensity (AC) (see Figure 6). A low noise amplifier is used at the exit of the APD DC output to amplify the signal acquired by a factor 12, thus leading to an overall sensitivity of 3600 V/mW. This signal enables the construction of the standard intensity image. The AC output is filtered from its mean contribution and reaches a sensitivity of 170 V/mW. It gives access to the beatnote amplitude. However, we need to acquire the phase which is why we use a synchronous demodulation.
2.5 Demodulation/acquisition
In a previous implementation in a confocal microscope7, a lock-in detection was used to retrieve the amplitude and the phase of the AC signal using the electrical signal from the AOM driver as a LO. More recently, the LO signal injected in the lock-in detection was obtained optically to avoid phase shifts between the AOM driver and the AC signal over the acquisition time8.
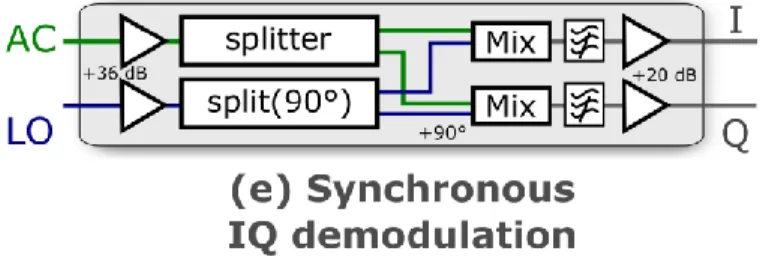
For the present setup, we replaced the lock-in detection by an optimized homemade quadrature demodulation circuit at 80 MHz (see Figure 7), thus enabling high speed acquisitions required for real time imaging. In this prototype, the LO and the RF signal from the APD module are first amplified by 36 dB. Then, power splitters divide the RF signal of interest and the LO in two, with one of the LO copy phase shifted by 𝜋/2. Two mixers multiply each copy of the RF signal with one LO, in order to produce the in-phase (I) and in-quadrature (Q) demodulated signals. These output signals are then filtered by a homemade 5th order Butterworth low-pass filter with a 250 kHz frequency cut-off. Finally, I and Q signals are amplified by 20 dB in order to take advantage of the full input voltage range (±5 V) of the 16 bits analog-to-digital converter (ADC) module.
Figure 7. Synchronous standard IQ demodulation scheme.
2.6 Image building-up
The three raw analog signals (DC, I and Q, expressed in volts) are digitized by this ADC module, which also controls the galvanometric mirrors orientation and thus the raster scanning operation. A LabVIEW program synchronizes the mirrors position and signals acquisition, while also giving the choice to the user of: the image resolution (number of pixels), the size of the region scanned (field of view) and the speed of scan (limited by the speed of the mirrors). This software control allows us to associate a measured value of the DC, I and Q signals with each location of the scene, thereby building three raw images (DC, I and Q images) after each scan of the scene. Then, the program computes: (i) a beatnote amplitude (|AC|) image, such that |AC|=(I²+Q²)1/2 ; (ii) a beatnote phase (𝜑) image with φ= atan(Q/I) ; and (iii) an
Orthogonality Breaking Contrast (OBC) defined as OBC= |AC| DC⁄ . All six images (DC, I, Q, |AC|, 𝜑 and OBC) are computed, displayed and finally recorded by the software.
3. CHARACTERIZATION OF THE DEMONSTRATOR
We have characterized the optical resolution, or instantaneous field of view (iFOV), of the demonstrator while varying the number of pixel in the images recorded. This allows us to find the best compromise between the acquisition speed and the image quality. We used a USAF resolution test target (76 cm x 76 cm), placed at a distance of 2 m from the beam-forming optics, and a polarizer was inserted in front of the detector to generate a non-null beatnote signal in order to determine the optical resolution for both DC and |AC| images. Above 512x512 pixels, the results plotted in Figure 8 indicate that the optical resolution of the demonstrator remains between 0.6 and 0.7 mm, corresponding to an iFOV lying between 0.3 and 0.35 mrad. Thereafter, the images will comprise 512x512 pixels in order to enable the scene acquisition and computation of all six images in 1.4 s while preserving good images quality.
Figure 8. Evolution of the optical resolution in DC and |AC| images with the number of pixels in the images.
The raw signals are perturbed by noise that we propose to analyze in this section. On the one hand, measurements are realized whilst the galvanometric mirrors are static so that the DFDP laser beam is focused on one position of the scene. The sample illuminated is an infrared polarizer (similar to a Polaroïd film) placed in front of a metallic plate. The temporal signals DC, I and Q are acquired during 1 s, which is close to the time required to raster scan the scene. To study the nature of the noise, we plot the histogram of each signal recorded in Figure 9. The three histograms are well approached by Gaussian distributions meaning that the temporal raw signals are dominated by additive noise.
Figure 9. Histograms (60 bins with 106 points) of DC, I and Q signals acquired on an infrared polarizer placed on metallic plate at a distance of 2 m from the demonstrator. Top-right inset of each histogram provides the mean (m), the variance (v), the skewness (s) and the excess kurtosis (k) calculated from the temporal signals. All three histograms have been fitted by Gaussian distributions (solid black curves) calculated from the mean and the variance.
On the other hand, we study the noise that affects the raw images acquired with the demonstrator. In this case, the scene is a metallic plate with a uniform surface in order to characterize the noise on homogeneous zones. The histograms are calculated with the complete images (512x512 pixels). Histograms could be reasonably well fitted with Gamma distributions12 that account for speckle noise (multiplicative noise).
Figure 10. Histograms (30 bins) from DC, I and Q images (512x512 pixels) captured on a homogeneous zone of a metallic plate. All histograms are fitted with Gamma distributions (dotted black lines). Top-right insets provide the same features as in Figure 9.
In summary, the optical resolution of the demonstrator is limited to 0.6 mm (iFOV of 0.3 mrad) and the raw signals DC, I and Q are characterized temporally (one position of the laser on the scene) by Gaussian noise whereas the images,
obtained by raster scanning, are dominated by a noise accurately fitted by Gamma distributions thus involving speckle noise.
4. IMAGING RESULTS ON ARTIFICAL SCENARIOS
We have built two synthetic scenes: a first one to validate the overall demonstrator, and a second one to assess its relevance in the context of target detection application.
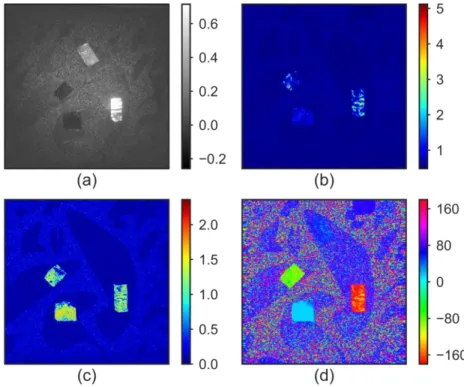
A picture of the first scene captured with a visible CCD camera is showed on Figure 11(a). The scene is divided into a depolarizing background made of wooden planks (depicted as the letter B) and a metallic plate where several elements upon it show dichroism (n°1), birefringence (n°2, 3, 7, 9) or depolarizing (n°4, 5, 6, 8, 11) behaviors at 1.55 µm. The scene is placed at a distance of 2 m from the beam-forming optics and the DFDP source is circularly polarized. The region scanned is 130 mm large and the illumination power deposited locally on the scene reaches 8 mW. Reflective elements (metallic pieces n°4, 5 and adhesive tapes n°2, 3, 7) at 1.55 µm appear among the dark background in the DC image [Figure 11(b)], whereas they vanish in the OBC image [Figure 11(c)] as they preserve the polarimetric orthogonality of the source. Hence, birefringent, non-depolarizing and depolarizing effects result in the absence of contrast in the OBC image9. Indeed, only two infrared polarizers (n°1) are strongly contrasted in the OBC image while being not visible in the DC image. Moreover, the phase image [Figure 11(d)] gives the infrared polarizers orientation, as reported in a previous work8, and may help at differentiating multiple elements in the scene since local changes in the low quadrature signals (I and Q) can result in strong phase variations. Here, it is worth noting that the absence of calibration between DC and AC gain values in the detection setup lead to non-physical maximum OBC values of roughly 2.0 in Figure 11(c).
This first scene validates the capability of the demonstrator based on the DSOB modality to enhance contrast on dichroic elements while being insensitive to birefringence effects. Moreover, no contrast appears between purely non-depolarizing (metallic plates) and the strongly non-depolarizing wooden background, as expected in such a confocal configuration9.
Figure 11. (a) Picture of the first scene captured with a visible CCD camera. Multiple elements, numbered from 1 to 11, with different polarimetric behaviors are arranged on a metallic plate which is surrounded by wooden planks identified by the letter B (for background). DC (b), OBC (c) and phase 𝜑 (d) images of the scene acquired in 1.4 s with 512x512 pixels. Units of colorbars express respectively volts, arbitrary units and degrees.
We have built a second scene captured by a visible and an infrared camera (InGaAs NIR CCD camera, 640x512 pixels) on Figure 12. The scene is made of three infrared polarizers deposited on aluminum sheets (denoted by to ) and one black anodized aluminum adhesive () hidden among black patterns printed on a white paper sheet. The polarizers are oriented at 0° (), 45° (), 90° () from the horizontal state of polarization of the source.
Figure 12. Visible and near infrared full-field images of the second scene. The scale bar represents 50 mm.
First, we identify the polarimetric behavior of the scene with an Orthogonal States Contrast (OSC) imaging approach which is well adapted to target detection application1,4,5,13 but requires two acquisitions. For this reason, we have slightly modified the illumination stage of the demonstrator to perform a full field OSC imaging technique. First, an incoherent illumination (spontaneous emission from the EDFA amplifier), with single horizontal polarization, was used to enlighten the whole scene by removing the front lens from the forming optics. The NIR camera is set close to the beam-forming optics and it captures the scene with a camera lens (160 mm focal length). A rotating NIR polarizer is inserted before the camera lens to allow recording parallel (𝐼𝑝𝑎𝑟) and then perpendicular (𝐼𝑝𝑒𝑟) states of polarization with respect to the source polarization. Figure 13(a) displays the OSC image calculated by: OSC=(Ipar-Iper)/(Ipar+Iper). On the one hand, while the polarizer shows a positive strong contrast (OSC = 0.7) among the strongly depolarizing background (OSC≈0.1), the two other polarizers ( and ) are represented by low negative contrasts (OSC=-0.1). In fact, the OSC is strongly dependent to the diattenuation orientation which could be detrimental for detection capabilities in some configurations where the contrast would completely vanish. On the other hand, the black anodized aluminum adhesive (non-depolarizing) is well contrasted (OSC = 0.4) among the surrounding depolarizing background (OSC≈0.1).
Then, we compare the OSC image to the DSOB images [Figure 13(b)-(d)] obtained with the demonstrator in a single raster scan of the scene. The measurement configuration is similar to the first scene (DFDP source circularly polarized, 512x512 pixels, and 130 mm region scanned).
In the DC image [Figure 13(b)], specular reflections from the aluminum sheets hidden behind the polarizers can be denoted. Concerning the OBC [Figure 13(c)], all three polarizers are uniformly contrasted above the dark patterns from the depolarizing background while only one was strongly visible in the OSC image. As stated with the first scene, the phase image [Figure 13(d)] allows the polarizers orientation to be retrieved using the following equation: 𝜃 = (𝜑 + 𝜋)/2 (with 𝜃, the orientation of the diattenuation). Indeed, phase values between polarizers and , and polarizers and are separated by approximately 90° which corresponds to a relative orientation difference of 45° according to the previous equation. As illustrated experimentally with the previous scene, the demonstrator is insensitive to pure depolarization such that the remaining areas of the scene should entail a uniform OBC value. Indeed, the non-depolarizing black aluminum adhesive shows no contrast among its surrounding background. However, the black and white patterns remain visible in the OBC map. This fact is most probably due to incorrect dark noise compensation (on the DC signal), which mainly affects the low OBC contrast regions of the raw images.
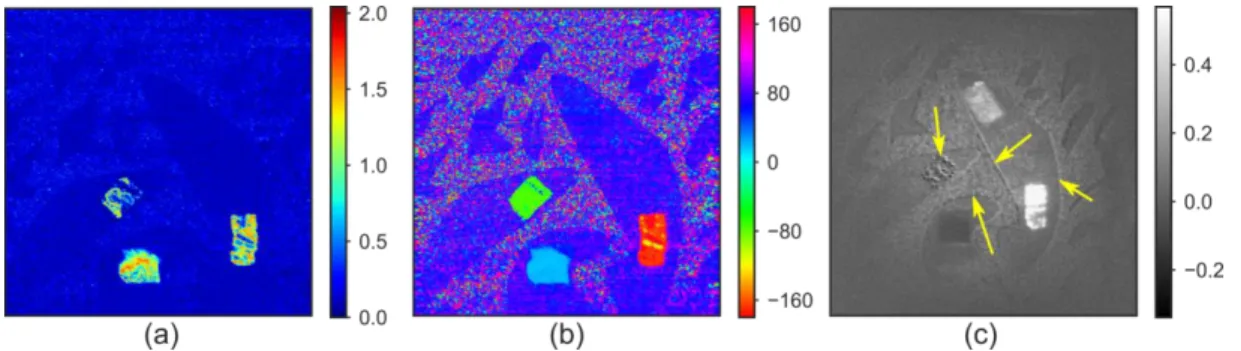
Towards target detection applications, it is essential to study scenarios with motion in the scene such as moving objects with potential air turbulence (long distance imaging). With standard polarimetric techniques, this can result in polarimetric artifacts in contrast images built with sequential acquisitions (for instance, with the OSC approach). We illustrate one benefit of the DSOB modality where the polarimetric information is accessed in a single acquisition by raster scan and is by essence immunized to polarimetric artifacts in comparison to standard imaging techniques. We use again both imaging modalities while air turbulence is generated in the path of light by placing a hot plate between the scene and the illumination/detection system.
Since the polarimetric information is acquired at each position of the laser on the scene, the turbulence induces geometrical distortions in the OBC and phase images, presented in Figure 14(a) and (b). It can be noted that there is no significant change of the phase values on the polarizers regions thus highlighting polarization consistency of the measurements. With the DSOB modality, no polarimetric artifacts appear. Conversely, the computation of sequential acquisitions with the OSC technique results in the presence of polarimetric artifacts at the edges of the dark patterns and among the polarizer , as illustrated with yellow arrows in Figure 14(c). These artifacts may lead to incorrect decisions (false or missed detection) in target detection applications.
Figure 14. Comparison between the DSOB modality OBC (a), phase φ (b) images and the OSC image (c) in the presence of air turbulence.
5. CONCLUSION
In this work, we have reported the demonstration and the characterization of an in-lab active infrared imaging system based on the DSOB technique. In comparison to an OSC imaging system, we pointed out that this alternative approach is suited to reveal dichroic elements independently from their orientation in a single acquisition, without loss of polarimetric information through air turbulence, and within a relatively short acquisition time (~1 s). In future works, we will study alternative modalities, based on the orthogonality breaking technique, to reveal and isolate different polarimetric contrasts such as depolarization, birefringence and dichroic contrasts while keeping advantage of the single acquisition operation. We will also involve more realistic scenarios for target detection application. The use of a pulsed
REFERENCES
[1] Breugnot, S. and Clémenceau, P., “Modeling and performances of a polarization active imager at λ=806 nm,” Opt. Eng. 39(10), 2681 (2000).
[2] Zhang, X., Jiang, Y., Lu, X. and Shen, L., “Implementation and imaging of a modified laser polarimetric remote sensing system,” 7th Int. Symp. Instrum. Control Technol. Sensors Instruments, Comput. Simul. Artif. Intell.
7127, 712705 (2008).
[3] Lavigne, D. a., Breton, M., Fournier, G., Pichette, M. and Rivet, V., “A new passive polarimetric imaging system collecting polarization signatures in the visible and infrared bands,” Infrared imaging Syst. Des. Anal. Model. Test. XX 7300, 730010-730010–730019 (2009).
[4] Alouini, M., Goudail, F., Grisard, A., Bourderionnet, J., Dolfi, D., Bénière, A., Baarstad, I., Løke, T., Kaspersen, P., Normandin, X. and Berginc, G., “Near-infrared active polarimetric and multispectral laboratory demonstrator for target detection.,” Appl. Opt. 48(8), 1610–1618 (2009).
[5] Laurenzis, M., Lutz, Y., Christnacher, F., Matwyschuk, A. and Poyet, J.-M., “Homogeneous and speckle-free laser illumination for range-gated imaging and active polarimetry,” Opt. Eng. 51(6), 61302 (2012).
[6] Fade, J. and Alouini, M., “Depolarization remote sensing by orthogonality breaking,” Phys. Rev. Lett. 109(4), 43901 (2012).
[7] Schaub, E., Fade, J., Ortega-Quijano, N., Hamel, C. and Alouini, M., “Polarimetric contrast microscopy by orthogonality breaking,” J. Opt. 16(12), 122001 (2014).
[8] Ortega-Quijano, N., Fade, J., Schaub, E., Parnet, F. and Alouini, M., “Full characterization of dichroic samples from a single measurement by circular polarization orthogonality breaking,” Opt. Lett. 40(7), 1270–1273 (2015). [9] Ortega-Quijano, N., Fade, J., Roche, M., Parnet, F. and Alouini, M., “Orthogonality-breaking sensing model
based on the instantaneous Stokes vector and the Mueller calculus,” J. Opt. Soc. Am. A 33(4), 434–446 (2016). [10] Parnet, F., Fade, J. and Alouini, M., “Orthogonality breaking through few-mode optical fiber,” Appl. Opt.
55(10), 2508–2520 (2016).
[11] Richter, L. E., Mandelberg, H. I., Kruger, M. S. and McGrath, P. A., “Linewidth Determination From Self-Heterodyne Measurement With Subcoherence Delay Time,” Quantum Electron. Lett. 22, 2070–2074 (1986). [12] Goodman, J. W., [Statistical Optics], Wiley (2000).
[13] Lavigne, D. A., Breton, M., Pichette, M., Larochelle, V. and Simard, J.-R., “Evaluation of active and passive polarimetric electro-optic imagery for civilian and military targets discrimination,” Polariz. Meas. Anal. Remote Sens. VIII 6972(May 2010), 69720X–69720X–9 (2008).