Supporting Information
for Adv. Mater. Interfaces, DOI: 10.1002/admi.202000129
Polymerization-Induced Wrinkled Surfaces with Controlled
Topography as Slippery Surfaces for Colorado Potato Beetles
Johannes B. Bergmann, Dafni Moatsou, Venkata A.
Surapaneni, Marc Thielen, Thomas Speck, Bodo D. Wilts, and
Ullrich Steiner*
1
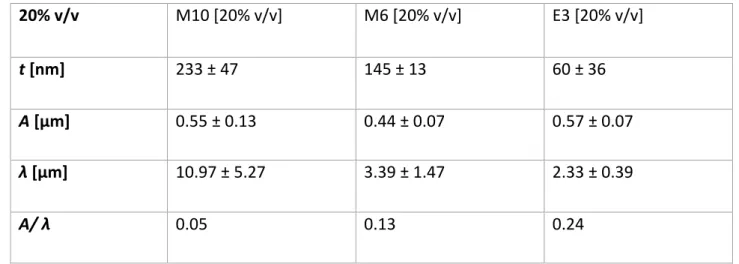
Table T1: Film thickness t, wrinkle amplitude A, wavelength λ and the resulting aspect ratio AR for the three different acrylate films of Figure S4, for a monomer solution concentration of 20% v/v.
20% v/v M10 [20% v/v] M6 [20% v/v] E3 [20% v/v]
t [nm] 233 ± 47 145 ± 13 60 ± 36
A [µm] 0.55 ± 0.13 0.44 ± 0.07 0.57 ± 0.07
λ [µm] 10.97 ± 5.27 3.39 ± 1.47 2.33 ± 0.39
A/ λ 0.05 0.13 0.24
Table T2: Film thickness t, wrinkle amplitude A, wavelength λ and the resulting aspect ratio AR for the three different acrylate films of Figure S4, for a monomer solution concentration of 40% v/v.
40% v/v M10 [40% v/v] M6 [40% v/v] E3 [40% v/v]
t [nm] 356 ± 36 231 ± 11 225 ± 36
A [µm] 1.31 ± 0.29 0.69 ± 0.15 1.5 ± 0.17
λ [µm] 12.67 ± 7.02 4.09 ± 1.15 5.08 ± 0.73
2
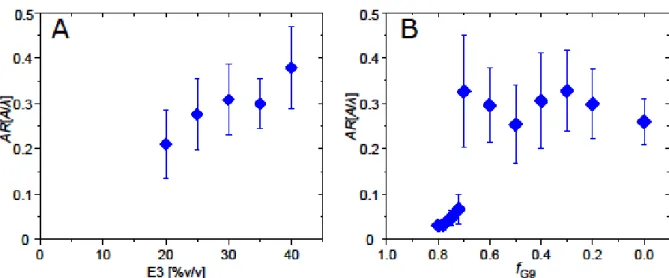
Figure S1: Wrinkle aspect ratios as a function of (A) E3 monomer solution concentration and (B) fG9
3
Figure S2: FTIR spectra of E3 monomer film prior to plasma polymerisation and plasma polymerised samples of films cast from various E3 solution concentrations.
The disappearance of the C=C peak at 1636 cm−1 was monitored to determine the monomer to
polymer conversion. The C=O stretching band at 1729 cm−1 was chosen as an internal
standard. After plasma treatment, all polymer films displayed a significant decrease of the peak at 1636 cm-1, indicating near-complete polymerisation.
4
Figure S3: Glass transition temperature Tg as a function of the G9/E3 mixing ratio fG9.
Figure S4: Chemical structures of three acrylates and the corresponding SEM images of films obtained after plasma treatment for two solution concentrations.
5
Figure S5: Film thickness t as a function of spin-coating speed for films coated from a 20% v/v monomer solution concentration.
Figure S6: Static water contact angles of water droplets on wrinkled polymer surfaces cast from solutions with varying E3 concentrations, as prepared and after hydrophobisation.
6
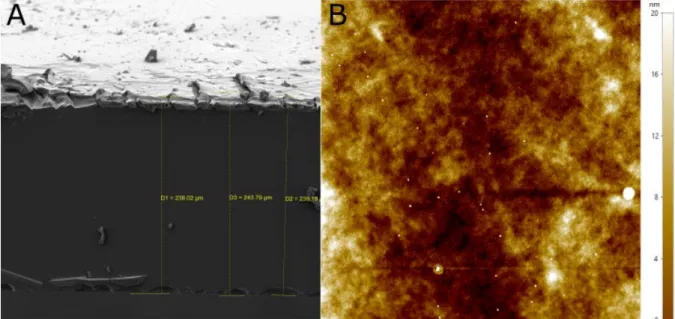
Figure S7: (A) SEM micrograph of crosssection of a thermally polymerized E3 film. (B) AFM image of the surface of a thermally polymerized E3 film.
The flat polymer film was obtained as follows. Similar to the preparation of wrinkled surfaces, a solution of pure E3 diacrylate containing 2.5 % w/v of thermal initiator azobis(isobutyronitril) (AIBN) was prepared and drop-casted onto a glass substrate (5 x 5 cm). It was then immediately placed into a nitrogen-flushed pre-heated oven set to 72 °C and allowed to cure under a nitrogen blanket for 3 hours. The polymerization was quenched by introducing air to the oven chamber and cooling the sample. The sample thickness was measured by SEM (t= 240 nm) and the roughness (Ra = 4 nm) was determined by AFM.
7
Equation (1) is obtained by combining equation (S1) with equation (S2), resulting in a relation between εc and t.
Calculation of Relative Traction Forces
Relative traction forces as displayed in Figure 3 were calculated as follows: 𝐹𝐹𝑟𝑟𝑟𝑟𝑟𝑟 =𝐹𝐹𝐹𝐹𝑠𝑠
𝑔𝑔 (𝑆𝑆3)
With Frel displaying relative traction force, Fs traction forces measured on wrinkled/flat
samples and Fg traction forces measured on glass reference surfaces, respectively.
Supplementary References
1. Cerda, E. & Mahadevan, L. Geometry and Physics of Wrinkling. Phys. Rev. Lett. 90, 4
(2003).
2. Chung, J. Y., Nolte, A. J. & Stafford, C. M. Surface wrinkling: A versatile platform for measuring thin-film properties. Adv. Mater. 23, 349–368 (2011).