ORIGINAL ARTICLE
A subset of metzincins and related genes constitutes
a marker of human solid organ fibrosis
Silke Rödder&Andreas Scherer&Meike Körner&
Hans-Peter Marti
Received: 7 December 2010 / Revised: 20 January 2011 / Accepted: 23 January 2011 / Published online: 20 February 2011 # Springer-Verlag 2011
Abstract Metzincins and functionally related genes play important roles in extracellular matrix remodeling both in healthy and fibrotic conditions. We recently presented a transcriptomic classifier consisting of 19 metzincins and related genes (MARGS) discriminating biopsies from renal transplant patients with or without interstitial fibrosis/ tubular atrophy (IF/TA) by virtue of gene expression measurement (Roedder et al., Am J Transplant 9:517–526,
2009). Here we demonstrate that the same algorithm has
diagnostic value in non-transplant solid organ fibrosis. We used publically available microarray datasets of 325 human heart, liver, lung, kidney cortex, and pancreas microarray samples (265 with fibrosis, 60 healthy controls). Expression of nine commonly differentially expressed genes was confirmed by TaqMan low-density arrays (Applied Bio-systems, USA) in 50 independent archival tissue specimens with matched histological diagnoses to microarray patients. In separate and in combined, integrated microarray data analyses of five datasets with 325 samples, the previously published MARGS classifier for renal post-transplant IF/TA had a mean AUC of 87% and 82%, respectively. These data
demonstrate that the MARGS gene panel classifier not only discriminates IF/TA from normal renal transplant tissue, but also classifies solid organ fibrotic conditions of human pancreas, liver, heart, kidney, and lung tissue samples with high specificity and accuracy, suggesting that the MARGS classifier is a cross-platform, cross-organ classifier of fibrotic conditions of different etiologies when compared to normal tissue.
Keywords Fibrosis . Microarray . Classifier . Metzincins and related genes (MARGS)
Introduction
Fibrosis is a tissue-repair response to chronic and severe tissue injury, including chronic exposure to pathogens or toxins like cigarette smoke, asbestos, and alcohol. A major cause of long-term organ failure, fibrosis is currently irreversible and is hence subject to extensive research efforts. Tissue repair is a delicately balanced process of sequential interplay of secretion of growth factors, chemo-kines, the deposition and degradation of extracellular matrix (ECM), angiogenesis, apoptosis, and eventually either resolution of the injury through regeneration, or healing accompanied by scar formation. Disruption or deregulation of any of those processes, or persistent tissue injury, leads to abnormal tissue repair, termed fibrosis, which consequently results in sclerosis. The role of inflammation as a trigger of normal and abnormal tissue
repair cascades is still under debate [2,3].
A common denominator of fibrotic wound repair is excessive deposition, reorganization, and remodeling of extracellular matrix (ECM). ECM remodeling is mediated by a number of genes and pathways, among others by the superfamily metzincins, which are zinc-dependent
metal-Electronic supplementary material The online version of this article (doi:10.1007/s00428-011-1052-7) contains supplementary material, which is available to authorized users.
S. Rödder
:
H.-P. Marti (*)Department of Nephrology and Hypertension, Inselspital, University of Bern, Freiburgstrasse 15, 3010 Bern, Switzerland e-mail: Hans-Peter.Marti@insel.ch A. Scherer Spheromics, Kontiolahti, Finland M. Körner
Institute of Pathology, University of Bern, Bern, Switzerland
loproteases. Metzincins can be subdivided into groups of proteins with a disintegrin and metalloprotease domain (ADAM), ADAM with thrombospondin motif (ADAMTS), serralysins, papalysins, and matrix metalloproteases (MMP). All have been shown to play roles during
fibrogenesis [4, 5]. As we have previously reported, we
have extended the group of metzincins and generated a gene set termed MARGS (metzincins and related genes). We included transcription factors, activators, inhibitors and substrates, and cell-surface and cytoplasmic proteins which
regulate the functions of metzincins [1]. The list of 191
MARGS includes genes with roles in epithelial cell damage (e.g., fibrin, fibronectin, collagens), fibroblast proliferation (e.g., TGF, TNF, SERPINE), basement membrane remod-eling (e.g., MMP2, MMP9), fibroblast foci formation (e.g., TIMP1, TIMP2), as well as angiogenesis (e.g., VEGF) and impaired re-epithelialization (e.g., MMPs/TIMPs)
(Supple-mentary Table TS1). Thus, MARGS are representative of
important phases of normal and fibrotic tissue repair. Timely diagnosis of fibrosis through molecular markers and classical clinical parameters may be an invaluable indication for treatment adjustment prior to the develop-ment of irreversible sclerosis.
We have previously demonstrated that gene expression of MARGS correlates at large with progression of human interstitial fibrosis/tubular atrophy (IF/TA) in renal allograft
biopsies [1]. We also showed in three independent
micro-array datasets that a gene panel consisting of 19 MARGS could be used to classify human renal biopsies with and without IF/TA.
Here we extend those findings and test the performance of the IF/TA gene expression classifier in human fibrosis of various etiologies in five different organs. Using publically available microarray datasets, we demonstrate first that MARGS indeed are differentially expressed under conditions of fibrosis in aging kidney, heart failure, liver cirrhosis, idiopathic pulmonary fibrosis, and pancre-atitis. We confirm these data by TaqMan quantitative RT– PCR in independent etiology-matched patient samples, and finally show in support of our hypothesis good diagnostic value of the MARGS-panel classifier in the microarray datasets.
Materials and methods Datasets
An overview of the microarray datasets is shown in Table1.
The expression data for the kidney dataset was downloaded fromhttp://genome-www5.stanford.edu[6]. Gene expression datasets for heart and lung were downloaded from Gene
Expression Omnibus, http://www.ncbi.nlm.nih.gov/geo,
Heart: GSE5406 [7], Lung: GSE10667 [1]. Liver and
pancreas data were provided by the authors [9,10].
Microarray analysis
Gene expression analysis was performed in Partek Genomics
Suite 6.5 (http://www.Partek.com) and R (http://www.
bioconductor.org). Where non-processed data were avail-able, datasets were quantile normalized with RMA background correction and median polish. The manuscript is based on the assumption that genes are appropriately matched to common identifiers across platforms to achieve comparability of data. We used Entrez Gene IDs for this purpose, as they appear to be relatively stable over time (J.S. Marron, personal observation). Expression signal intensities for features mapping to the same Entrez GeneID were averaged. Pseudogenes and all features on the platforms without Entrez Gene ID were excluded.
Expression filters were applied to all datasets, except those with ratio measures. Only genes with signal intensity
measurements of at least 6.5 in log2scale in a number of
samples corresponding to 75% in the smallest analysis group were considered further. Differentially expressed genes were identified by ANOVA after application of a gene list filter. No expression filter was applied for testing the MARGS classifier. Receiver operator characteristic (ROC) curves and calculation of the AUC was done with
the R package ROCR [11].
Classifier algorithm was linear discriminant analysis (LDA) with leave-one-out cross-validation.
Patients for confirmation analyses
For confirmation of microarray results, we utilized archival formalin fixed paraffin embedded (FFPE) pan-creas, lung, liver, kidney, and heart tissue from the Institute of Pathology, University of Berne, Switzerland. Fibrotic and non-fibrotic tissue specimens from a total of
50 patients were utilized (Table 2). Great care was taken
to select the cases with best match to the histological
diagnosis of cases used for microarray data analyses [6–
10]. All patients remained anonymized except for age and
gender, and all studies were approved by the local ethics commission.
Preparation of tissue
Sections 8–10 μm thick were cut from each FFPE tissue block of healthy and fibrotic kidneys, hearts, livers, lungs, and pancreas (n=5 per case). Sections were deparaffinized in xylene three times for 5 min with gentle inversion. A
sterile scalpel and stencil and transferred into a 1.5-mL
microcentrifuge tube. For tissue digestion, 150 μL
Proteinase K mix (20 μg/μL; Arcturus Bucher Biotec,
Basel, Switzerland) were added, and tissue was incubated in a thermoshaker at 37°C and 300 rpm for 20 h. All procedures were carried out under RNase-free conditions. Isolation of total RNA and TaqMan® custom array microfluidic cards
Total RNA was isolated in a final volume of 12μL using
the Paradise Plus WT RT Reagent System (Arcturus, Bucher Biotec) according to the manufacturer’s protocol. Total RNA was quantified using NanoDrop (Thermo Scientific NanoDrop, USA), and quality was controlled applying the BioAgilent, USA Nanochip (Agilent, USA). Finally, 200 ng total RNA was reverse transcribed into
cDNA, and 50μL Universal PCR master mix and
nuclease-free water were added up to a final volume of 100μL. This
sample was subsequently loaded onto TaqMan custom arrays consisting of 384-well microfluidic cards and run on ABI PRISM 7900HT (total of 40 cycles) (Applied Biosystems). Gene expression assays came pre-pipetted and lyophilized in the wells. Selection of gene expression assays for the LDA
based on short amplicon size (<100 bp) and proximity to the 3′
prime end. The following assays were used: THBS2 Hs01568063_m, HYOU1 Hs00197328_m, MMP7 H s 0 1 0 4 2 7 9 5 _ m , M M P 2 H s 0 0 2 3 4 4 2 2 _ m , P X N Hs00236064_m, COL1A2 Hs01028970_m, TIMP1 Hs00171558_m, COL3A1 Hs00943809_m, and HNRNPU
Hs00244919_m. qRT–PCR results were analyzed by SDS
V2.01 (Applied Biosystems) and Partek Genomics Suite. Triplicate TaqMan qRT–PCR Ct values were normalized by
geometric averaging of multiple internal control genes [12].
Table 1 Documentation of gene expression microarray datasets used analysis (all datasets are publically available)
Data Array type Samples
Organ Reference Source Name #
Features # Fibrosis # Control Fibrosis Control
Kidney Rodwell GEJ et al., PLoS Biology 2004;2:e427 http://genomewww5. stanford.edu/ Affymetrix HG-U133A and B 44,928 11 16 IF/TA 3 IF/TA 0–1
Heart Hannenhalli S et al., Circulation, 2006;114: 1269–1276
GEO GSE5406
Affymetrix HG-U133A 22,283 194 16 Systolic heart failure
Non-failing
Liver Utsunomiya T et al., World J Gastroenterol, 2007;13:383–390
Authors Agilent Human 1A 22,153 15 8 MFI adj>10 MFI adj=0
Lung Konishi K et al., Am J Respir Crit Care Med, 2009;180:167–175 GEO GSE10667 Agilent 4×4 4k Whole Human Genome
43,376 31 15 IPF; IPF +Aex Normal
Pancreas Binkley CE et al., Pancreas 2004;29:254–263
Authors Affymetrix HuGeneFL 7,129 15 5 Adenocarc.,
pancreatitis
Normal
Table 2 Information on samples used for TaqMan qRT–PCR confirmation analysis (samples were selected to match the setting of the samples used for the microarray studies as close as possible)
Organ Group Tissue specification Diagnosis # Age (years) % Male
Kidney Control Tumor unaffected kidney cortex of nephrectomy
Wilms tumor 5 5 +7/−3 60
Fibrosis Renal carcinoma 5 77 +7/−6 80
Heart Control Time point zero biopsy Healthy 5 46 +17/−26 80
Fibrosis Explant Terminal cardiac failure 5 56 +9/−7 100
Liver Control Tumor unaffected region of hepatectomy
Cancer metastasis 5 60 +16/−21 80
Fibrosis Hepatectomy Liver cirrhosis 5 53 +8/−6 60
Lung Control Tumor unaffected region of resectomy
Primary lung cancer; cancer metastasis
3 62 +16/−13 40
Fibrosis Resectomy Usual interstitial pneumonia 5 74 +12/−11 60 Pancreas Control Tumor unaffected region
of pancreatectomy
Pancreatic carcinoma: pseudomyxoma peritonei
4 58 +12/−14 60
Results
Data pre-processing
We have previously shown that MARGS are differentially expressed in conditions of renal transplant interstitial
fibrosis and tubular atrophy (IF/TA) [1]. In addition, a
panel of 19 MARGS genes in conjunction with the decision algorithm Linear Discriminant Analysis had been identified as molecular marker of IF/TA in renal allografts. To investigate the relevance of MARGS in fibrotic, non-transplant conditions of various etiologies, we turned to publically available microarray datasets and compared
cases of healthy controls and fibrosis (Table 1). In the
kidney cortex dataset [6], we grouped samples with IF/TA
grade 0–1, so that mild fibrosis was included in the control
group. Those were compared to samples with severe IF/TA (grade 3). For the heart analysis, we used microarray data from 194 samples from advanced systolic heart failure and
from 16 non-failing hearts [7]. Heart failure patients
suffered either from ischemic (n=86) or idiopathic dilated (n=108) cardiomyopathy. This difference was neglected in the present analysis. The lung analysis comprised samples from 23 patients with interstitial pulmonary fibrosis (IPF)
and eight with acute exacerbation of IPF (IPF-AEx) [8]. For
the purpose of our study, these two groups were combined to one and compared to 16 samples from patients with normal lung histology. Samples for the liver analysis were selected from the healthy control group and from those patients with an adjusted morphologic fibrosis index (MFI)
score ≥10 (average F-score for this group is 3.4). The
adjusted MFI is the mean MFI determined from nine section images, adjusted by a factor of 1.13, which corrects for a mean MFI of 1.13 in samples of healthy control
patients [9]. The majority of the fibrosis samples originated
from patients with hepatocellular carcinoma, most of which were positive for hepatitis C virus (HCV) antibody. Finally, the pancreas dataset consisted of samples from patients with chronic pancreatitis (n=5), pancreatic adenocarcinoma (n=
10), and five normal pancreas samples [10]. Chronic
pancreatitis and adenocarcinoma samples were grouped into one.
Due to the different platforms and population of features on the arrays, different numbers of MARGS are represented on the platforms. For instance, the kidney cortex dataset with HG-U133A and B included 175 MARGS, while 100 MARGS were represented on the platform of the pancreas dataset. This has implications for the comparison of differentially expressed MARGS, as we do not have information on the expression of many MARGS on some of the platforms (see below).
The initial analytical steps had to be adjusted to each dataset. The kidney cortex data where distributed on
HG-U133A and HG-U133B arrays. We used only array pairs which had been generated from the same patient RNA. As 99 probesets are shared between both array types, data were merged into one matrix by mean adjustment of the expression values of those probesets. The signal intensities of the pancreas dataset were floored to a minimum value of
10 and log2transformed. The liver dataset had been Lowess
normalized. As the samples had been split into training and test set by the authors, we treated the technical effect by mean adjustment. Sample A47, adjusted morphologic fibrosis index (MFI) 17.43, was excluded in the further analysis due outlier-like behavior which could not be explained with the data at hand.
Differentially expressed MARGS
Figure 1 shows principal component analysis (PCA) of
differentially expressed MARGS which pass the
expres-sion filter (see “Materials and methods”) and had a false
discovery rate q-value qFDR <0.01 in each dataset separately. The number of MARGS with differential expression naturally is dependent on the significance of biological/clinical differences between the sample groups, but also influenced by the platform design, i.e., how many MARGS are represented on the platforms. In kidney cortex, 59 of overall 175 MARGS on the platform pass our filter criteria and only four of a total of 179 MARGS in liver.
It is obvious that differentially expressed MARGS are sufficient in the kidney cortex, liver, and pancreas dataset to separate fibrosis samples from control samples. The PCA of the heart samples showed some overlap between normal and fibrotic samples due to the inclusion of samples with mild to very mild grades of fibrosis. In lung, there are three samples of the control group, GSM269754, GSM269762, and GSM269757, which display extreme behavior with respect to MARGS expression and tend to be placed close to the fibrosis group. Technical or biological/clinical reasons not known to us may account for this.
Five-way Venn diagram
Uniformly deregulated genes in kidney cortex, heart, liver, lung, and pancreas fibrosis were identified by Venn analyses, comparing all deregulated MARGS in each organ fibrosis dataset having a qFDR <0.1 (Fibrosis vs. Control) after expression filter. In this analysis, we chose a larger qFDR threshold to compensate for the—in relation to the other datasets—larger qFDR values in the liver dataset. We had also noticed that the set of MARGS with smallest qFDR in liver are different from the set of MARGS with smallest qFDR in the other datasets. To recruit a sufficient
confirma-tion from this analysis, we applied a more permissive qFDR cutoff.
Eighty-five MARGS in kidney cortex were compared to 40 MARGS in heart fibrosis, 48 MARGS in liver fibrosis, 110 MARGS in lung fibrosis, and 78 MARGS in pancreas
fibrosis (Fig.2a). The set union formed by all five datasets
consisted of tissue inhibitor of metalloproteinase 1 (TIMP1) and hypoxia upregulated protein 1 (HYOU1). The analyses revealed that 14 MARGS were only deregulated in kidney fibrosis, whereas 25 genes were identified to be solely deregulated in lung fibrosis, two genes in heart fibrosis, seven genes in liver fibrosis, and 11 in pancreas fibrosis
(Fig. 2b). Nine genes were differentially expressed in
kidney cortex, liver, lung, heart, and pancreas, but not in liver. These genes were collagen, type I, alpha 1 (COL1A1), collagen type I, alpha 2 (COL1A2), collagen type III, alpha 1 (COL3A1), matrix metallopeptidase 2 (MMP2), secreted protein, acidic, cysteine-rich (SPARC), thrombospondin 2 (THBS2), thrombospondin 3 (THBS3), TIMP metallopeptidase inhibitor 3 (TIMP3), and vascular endothelial growth factor C (VEGFC). Genes belonging to
the family of thrombospondins (THBS) were deregulated in each organ. THBS2, previously identified as IF/TA marker in kidney allograft biopsies (1), was deregulated in fibrosis of all organs but liver. Here, the family member THBS1 was deregulated. MMP7, besides THBS2, another candi-date as IF/TA marker, showed deregulation in kidney, pancreas, and lung fibrosis but not in liver and heart
(Fig. 2b).
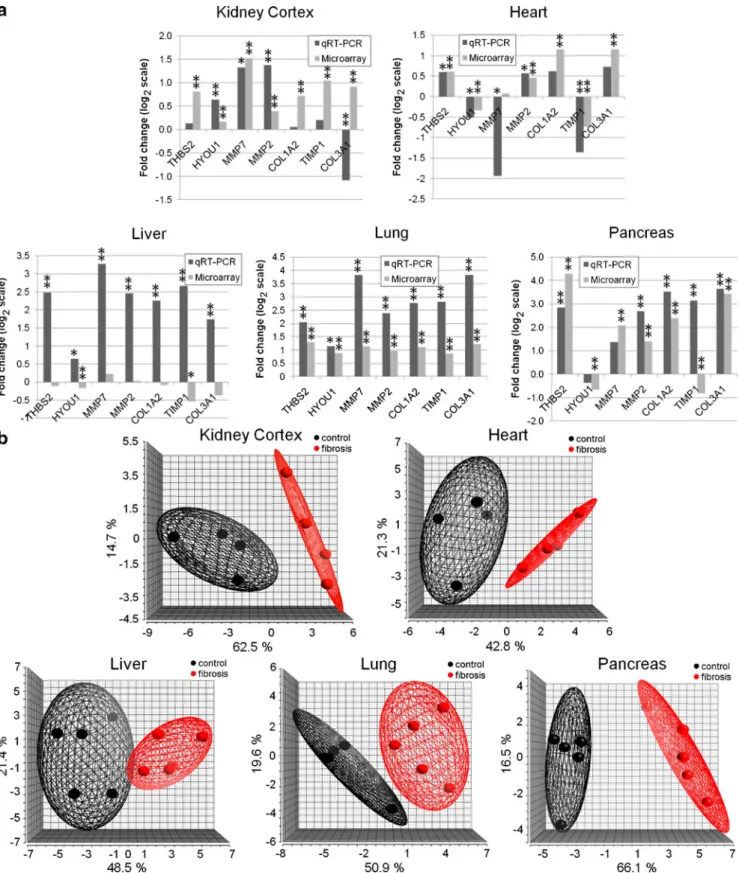
Cross-organ deregulated MARGS are confirmed in independent patient samples
From the list of 11 MARGS which were differentially expressed in all organs or all organs but liver, and from
results of our previous studies [1], we selected seven
MARGS for confirmation analyses: THBS2, TIMP1, COL1A2, COL3A1, HYOU1, MMP2, and MMP7. As control genes served two genes which had a coefficient of variation less than 7.5 % in each dataset, heterogeneous nuclear ribonucleoprotein U (HNRNPU) and paxillin (PXN). Archival biopsy specimens of patients with
Fig. 1 Principal component analysis (PCA) of samples with or without fibrosis from published datasets. Differentially expressed MARGS are sufficient to separate fibrotic samples from healthy [or mild fibrosis (kidney)] in kidney, heart, liver, lung, and pancreas. Each sphere represents one sample. For visualization purposes, ellipsoids
which encompass 95% of the samples per group were added. Criterion for differential expression is a qFDR <0.01 after expression filter (see “Materials and methods”). Number before bracket is the number of MARGS genes with qFDR <0.01, the number inside the bracket is the number of MARGS represented on the array platform
matched histological diagnosis to microarrays served as
RNA source (Table2,“Materials and methods”).
Of 28 confirmation tests in kidney cortex, heart, lung, and pancreas, 25 (89%) confirmed the direction of expression
changes observed in the microarray datasets (Fig.3a). Of the
three which could not be confirmed, MMP7 was expressed at low levels in the heart microarray dataset and had not passed the qFDR filter. The other two tests which failed were COL3A1 in kidney cortex and TIMP1 in pancreas.
THBS2 and MMP2 were upregulated in fibrosis of all organs. HYOU1 showed increased expression in fibrosis of kidney, liver, and lung, and showed decreased expression in heart and pancreas fibrosis. TIMP1 was upregulated in all
organs except heart (Fig. 3a). The same pattern was
observed for MMP7 with decreased expression only in heart fibrosis. Highest expression values in heart fibrosis were observed for COL3A1 and COL1A2 (fc vs. Normal
0.73 and 0.61, log2 scale, respectively). All candidate
MARGS showed increased expression in pancreas, liver, and lung fibrosis; only in heart and kidney fibrosis decreased expression was identified for certain selected
MARGS when compared to healthy tissue (Fig. 3a). As
shown in Fig.3b, TaqMan qRT–PCR data lead to cluster
formation of in-house samples according to diagnosis in a PCA in all five tissues.
Interestingly, out of seven liver tests, only two could be confirmed, MMP7 and MMP2, where MMP2 had a small
fold change in the microarray dataset (0.03, log2scale). All
candidate MARGS were upregulated in liver fibrosis in the in-house samples, while five of seven were downregulated in the microarray dataset.
Classifier analysis
We have previously shown in an in-house gene expression microarray dataset as well as other published datasets that a classifier model consisting of 19 MARGS in combination with Linear Discriminant Analysis decision algorithm can discriminate human renal allograft biopsies with interstitial
fibrosis and tubular atrophy (IF/TA) from those without [1].
To test our hypothesis, that the same classifier panel could discriminate fibrosis of different etiology from non-fibrosis in non-transplant setting, we applied the published classifier to the microarray datasets, including internal leave-one-out cross-validation.
Without expression filter, the MARGS classifier list was applied to the datasets, along with the algorithm Linear Discriminant Analysis and full leave-one-out internal cross-validation. As not all MARGS of the classifier panel were represented on each platform, gene subsets of the classifier
had to be used in some instances (Table 3). In kidney
cortex, 18 of the 19 classifier MARGS could be used, in heart 15, in lung and liver all 19, and in pancreas 10
(Supplementary TableTS2). As can be seen in Table 3, the
performance estimate “area under the ROC curve” (AUC)
for the binary prediction of“fibrotic” or “healthy” exceeded
0.78 in each dataset. The mean AUC was 0.872. The mean accuracy was 88%. The best classification rate was achieved in kidney cortex, where all samples were correctly classified; the lowest performance was measured with the liver dataset where the correct classification rate was 72.7% (AUC =0.786). The significance of the AUC was estimated by bootstrapping (seed =100,000). A lower limit of the 95th
Fig. 2 Differentially expressed MARGS in fibrosis datasets. a Five-way Venn diagram identifies two MARGS genes which are differen-tially expressed in all five datasets. Nine additional MARGS are differentially expressed in all datasets but liver (shaded fields). Criterion for differential expression is a qFDR <0.1 and passing an
expression filter (see “Materials and methods”). b Gene lists from Venn diagram. Genes which were selected for confirmation analyses are underlined. In addition, MMP7 was selected based on previous findings (see main text). MMP7 was differentially expressed in kidney, lung, and pancreas microarray datasets (not shown)
Fig. 3 TaqMan RT–PCR confirmation of microarray data in independent sample sets. a TaqMan qRT–PCR confirmation of seven MARGS genes in five tissues. In kidney, heart, lung, and pancreas, 89% of the tests successfully confirmed the direction of expression changes. In liver, only two of seven tests were successful. TaqMan qRT–PCR: *p<0.1, **p<0.05; microarray: *qFDR value<0.1, qFDR
value<0.05. b Principal component analysis of normalized TaqMan qRT–PCR values of seven MARGS. In an unsupervised analysis, the expression values of the genes separate the tissue samples in each comparison by diagnosis. Each sphere represents one sample. For visualization purposes, ellipsoids which encompass 95% of the samples per group were added
percentile confidence interval larger than 0.5 indicates that the model performance is significantly better than random. This is the case in all analyses. A chi-square p value <0.5 indicates a significant dependence of the actual and the predicted values. In all tests, the chi-square p value is smaller than 0.5.
Next we integrated all five datasets across tissue and platform to obtain a set with 265 fibrosis samples and 65
control samples (Table 3). Due to the integration of the
pancreas dataset, only 10 MARGS genes could be used in this approach: CD44, THBS2, VEGFA, PLG, TNFAIP3, LAMB1, TNFSF10, COL3A1, THBS1, and MGP. Despite these limitations, the classifier performance reached a significant AUC of 0.82 and an accuracy of 88%.
Discussion
Genes comprising the MARGS gene set are known to be involved in remodeling of ECM under healthy and disease
conditions [13–16]. It is therefore conceivable that they
play important roles in fibrotic/sclerotic conditions in organs, which may result in response to tissue injury, or as progression of age. Along those lines, differential expression of hypoxia-regulated genes, such as HYOU1 (hypoxia up-regulated 1), HIF1-target gene TIMP1 in all datasets, and THBS2, MMPs and collagens I and III in all but the liver microarray dataset are in correspondence with earlier findings which showed an involvement of hypoxia
in fibrosis (kidney [17,18], pancreas [19], lung [20, 21],
heart [22–24], liver [25–27]).
We were able to validate the gene expression trends we saw in kidney, heart, lung, and pancreas in 89% (25 of 28
tests) of the TaqMan qRT–PCR tests using archival tissue
specimens, which is an exceptionally high rate considering that all sample sets were completely independent. Confir-mation results were unsatisfactory for the liver microarray
data (Fig. 3a), where five of seven tests failed to validate
the microarray data, although the TaqMan data themselves were significantly different between healthy and fibrotic
samples (Fig.3a, b). Compared to the datasets of the other
organs, only few MARGS in the liver dataset had qFDR
values <0.01 (Fig. 1). In our own analysis of the liver
microarray data, we observed similar trends of gene expression changes as the Utsunomiya group and confirm the importance of inflammatory genes in that dataset (not shown). We found that most MARGS were in fact underrepresented in the fibrosis group (not shown), while proinflammatory genes were largely overrepresented and correlated with the adjusted MFI fibrosis grade, as
published [9]. Recently, the group of Takahara has shown
in gene expression studies of fibrosis in HCV patients that ECM modulatory genes in general positively correlate with
T able 3 IF/T A classifier performance in microarray studies Or gan Number of samples (total/fibrosis/ control) Fibrosis correct classification Control correct classification
Number of variables Sensitivity (%) Specificity (%) ACC AUC AUC 95% CI Chi square Chi- square pvalue
(a) Individual performance estimation of the classifier in each dataset separately Kidney cortex 27/1 1/1 1 1 1 (of 1 1 ) 1 6 (of 16) 18 100 100 1.00 1.00 1.00 –1.00 27 2.04E − 07 Heart 210/194/16 186 (of 194) 13 (of 16) 15 96 81 0.95 0.89 0.77 –0.98 97.7 4.90E − 23 Liver 22/14/8 8 (of 14) 8 (of 8) 19 57 100 0.73 0.79 0.67 –0.92 7.2 7.00E − 23 Lung 46/31/15 26 (of 31) 12 (of 15) 19 84 80 0.83 0.82 0.70 –0.94 17.7 2.00E − 05 Pancreas 20/15/5 14 (of 15) 4 (of 5) 10 93 80 0.90 0.87 0.63 –1.00 10.8 1.00E − 03 Mean 86 88 0.88 0.87 (b) Cross-orga n, cross-platform performance estimation of the classifier in the merged dataset Cross-platform, cross-organ, integrated 325/265/60 241 (of 265) 44 (of 60) 10 91 73 0.88 0.82 0.76 –0.88 122.2 2.12E − 28 ACC accuracy ,AUC area under the ROC curve
the METAVIR F-score 1 through 4, and some genes had
peak expression changes in fibrosis score 2 and 3 [28]. In
accordance with these data, we observe similar trends in expression changes with MARGS ECM genes when we use the categorical average METAVIR F-score instead of the continuous adjusted MFI; however, the qFDR values for the individual genes increase (not shown). We do not obtain a better correlation of TaqMan qRT–PCR and microarray
data in terms of trends of“over- and under-representation”
when we use the METAVIR F-score annotation of the microarray data. We believe that the differences between the microarray data of Utsunomiya’s group and the Inselspital TaqMan qRT–PCR data may reveal differences in etiology or be of other clinical or biological origin which was impossible to capture from the annotations at hand despite our efforts to match our patient groups as much as possible with the published samples. The increases in, e.g., MMP2 and collagens type I and III that we observe in
TaqMan qRT–PCR data match well with published findings
(see [29] for review). Separately, the two analyses revealed
significant differences for MARGS between liver fibrosis and healthy groups, leading to a separation of the sample groups in PCA of the microarray data and of the TaqMan
qRT–PCR data (Figs. 1and3, respectively).
Let us consider two major valid methods of identifying molecular markers, e.g., gene expression panels in combi-nation with a decision algorithm. One method, let us use the
term“gene-to-biology-method”, essentially employs testing
of all features on a technology platform (such as micro-arrays) and then, once the feature panel has been identified, links to the biology and pathways underlying the studied disease. While in theory it is not given that genes, or generally speaking, features, of a classifier which has been identified in an unbiased way are involved in the disease biology, in practice many researchers and clinicians feel much more comfortable with the classifier panel if they do,
as it is intuitively plausible [30]. In our studies, we have
employed another method, a “biology-to-gene-method”.
We first considered the biology of the diseases or complications we were interested in, used literature searches and knowledge to assemble a list of genes which play important roles in that biology, and asked whether those genes could serve as the starting gene list to generate a classifier panel. Hence, we easily linked the biology of fibrosis, post-transplant or in other etiologies, with molec-ular markers (the MARGS).
We previously showed that a subset of MARGS can be used to discriminate human renal allograft biopsy samples
with IF/TA from non-IF/TA samples [1]. In the present
study, we demonstrate that the IF/TA MARGS transcrip-tomics classifier panel also classifies solid organ fibrotic conditions of human aging kidney, cardiac failure, hepatic cirrhosis, pulmonary fibrosis, and pancreatitis tissue
sam-ples with high accuracy, AUC, specificity, and sensitivity (the sensitivity for the liver dataset was exceptionally low and the reason remains uncertain). Our studies suggest that the MARGS classifier is a valid candidate for a cross-platform, cross-organ classifier of normal tissue vs. fibrotic conditions of different etiologies. Obvious next steps are the application of the classifier to blood sample gene expression data, to see whether a minimally invasive, easily applicable gene expression marker could accompany or
outperform other minimally and non-invasive methods [31–
34]. Given that, e.g., plasma levels of TIMP1 protein have
been found elevated in diastolic dysfunction [35], transfer
of our data to, for instance, peripheral blood appears promising. From a clinical perspective, the MARGS classifier may be used to detect fibrosis prior to the development of irreversible tissue sclerosis, and thus enhance organ preservation through treatment adjustment. The classifier should be tested for its ability to diagnose fibrosis at a very early time point, ideally before fibrosis is visible on tissue sections and therapy is still most effective. In this respect, it will be interesting to test the classifier for its ability to be utilized to monitor drug effects. Future work will tell if some of the genes present in the MARGS panel represent therapeutic targets.
Acknowledgments This work was supported by Grant No. 32003B-114054 to Hans-Peter Marti from the Swiss National Science Foundation (SNSF).
We are grateful to Dr. Simeone and Dr. Logsdon for providing the pancreas dataset, and Dr. Utsunomiya and Dr. Mori for providing the liver dataset.
Conflict of interest statement We declare that we have no conflict of interest
Funding Grant Nr. 32003B-114054 to Hans-Peter Marti from the Swiss National Science Foundation (SNSF)
References
1. Roedder S, Scherer A, Raulf F, Berthier CC, Hertig A, Couzi L, Durrbach A, Rondeau E, Marti HP (2009) Renal allografts with IF/TA display distinct expression profiles of metzincins and related genes. Am J Transplant 9:517–526
2. Meneghin A, Hogaboam CM (2007) Infectious disease, the innate immune response, and fibrosis. J Clin Invest 117:530–538 3. Selman M, King TE, Pardo A (2001) Idiopathic pulmonary
fibrosis: prevailing and evolving hypotheses about its pathogen-esis and implications for therapy. Ann Intern Med 134:136–151 4. Nagase H, Woessner JF Jr (1999) Matrix metalloproteinases. J
Biol Chem 274:21491–21494
5. Woessner JF Jr, Gunja-Smith Z (1991) Role of metalloproteinases in human osteoarthritis. J Rheumatol Suppl 27:99–101
6. Rodwell GE, Sonu R, Zahn JM, Lund J, Wilhelmy J, Wang L, Xiao W, Mindrinos M, Crane E, Segal E, Myers BD, Brooks JD, Davis RW, Higgins J, Owen AB, Kim SK (2004) A
transcriptional profile of aging in the human kidney. PLoS Biol 2:e427
7. Hannenhalli S, Putt ME, Gilmore JM, Wang J, Parmacek MS, Epstein JA, Morrisey EE, Margulies KB, Cappola TP (2006) Transcriptional genomics associates FOX transcription factors with human heart failure. Circulation 114:1269–1276
8. Konishi K, Gibson KF, Lindell KO, Richards TJ, Zhang Y, Dhir R, Bisceglia M, Gilbert S, Yousem SA, Song JW, Kim DS, Kaminski N (2009) Gene expression profiles of acute exacerba-tions of idiopathic pulmonary fibrosis. Am J Respir Crit Care Med 180:167–175
9. Utsunomiya T, Okamoto M, Wakiyama S, Hashimoto M, Fukuzawa K, Ezaki T, Aishima S, Yoshikawa Y, Hanai T, Inoue H, Barnard GF, Mori M (2007) A specific gene-expression signature quantifies the degree of hepatic fibrosis in patients with chronic liver disease. World J Gastroenterol 13:383–390 10. Binkley CE, Zhang L, Greenson JK, Giordano TJ, Kuick R,
Misek D, Hanash S, Logsdon CD, Simeone DM (2004) The molecular basis of pancreatic fibrosis: common stromal gene expression in chronic pancreatitis and pancreatic adenocarcinoma. Pancreas 29:254–263
11. Sing T, Sander O, Beerenwinkel N, Lengauer T (2005) ROCR: visualizing classifier performance in R. Bioinformatics 21:3940–3941 12. Vandesompele J, De PK, Pattyn F, Poppe B, Van RN, De PA, Speleman F (2002) Accurate normalization of real-time quantita-tive RT–PCR data by geometric averaging of multiple internal control genes. Genome Biol 3:RESEARCH0034
13. Zaoui P, Cantin JF, Alimardani-Bessette M, Monier F, Halimi S, Morel F, Cordonnier D (2000) Role of metalloproteases and inhibitors in the occurrence and progression of diabetic renal lesions. Diabetes Metab 26(Suppl 4):25–29
14. Klein T, Bischoff R (2010) Physiology and pathophysiology of matrix metalloproteases. Amino Acids. doi: 10.1007/s00726-010-0689-x
15. Klein T, Geurink P, Overkleeft S, Kauffman K, Bischoff R (2009) Functional proteomics on zinc-dependent metalloproteinases using inhibitor probes. ChemMedChem 4:164–170
16. Berthier CC, Pally C, Weckbecker G, Raulf F, Rehrauer H, Wagner U, Le HM, Marti HP (2009) Experimental heart transplantation: effect of cyclosporine on expression and activity of metzincins. Swiss Med Wkly 139:233–240
17. Tanaka T, Kato H, Kojima I, Ohse T, Son D, Tawakami T, Yatagawa T, Inagi R, Fujita T, Nangaku M (2006) Hypoxia and expression of hypoxia-inducible factor in the aging kidney. J Gerontol A Biol Sci Med Sci 61:795–805
18. Fine LG, Norman JT (2008) Chronic hypoxia as a mechanism of progression of chronic kidney diseases: from hypothesis to novel therapeutics. Kidney Int 74:867–872
19. Leung PS (2007) The physiology of a local renin–angiotensin system in the pancreas. J Physiol 580:31–37
20. Corte TJ, Wort SJ, Wells AU (2009) Pulmonary hypertension in idiopathic pulmonary fibrosis: a review. Sarcoidosis Vasc Diffuse Lung Dis 26:7–19
21. Zhou G, Dada LA, Wu M, Kelly A, Trejo H, Zhou Q, Varga J, Sznajder JI (2009) Hypoxia-induced alveolar epithelial
–mesen-chymal transition requires mitochondrial ROS and hypoxia-inducible factor 1. Am J Physiol Lung Cell Mol Physiol 297: L1120–L1130
22. Tamamori M, Ito H, Hiroe M, Marumo F, Hata RI (1997) Stimulation of collagen synthesis in rat cardiac fibroblasts by exposure to hypoxic culture conditions and suppression of the effect by natriuretic peptides. Cell Biol Int 21:175–180
23. de Boer RA, Pinto YM, van Veldhuisen DJ (2003) The imbalance between oxygen demand and supply as a potential mechanism in the pathophysiology of heart failure: the role of microvascular growth and abnormalities. Microcirculation 10:113–126 24. Gramley F, Lorenzen J, Jedamzik B, Gatter K, Koellensperger E,
Munzel T, Pezzella F (2010) Atrial fibrillation is associated with cardiac hypoxia. Cardiovasc Pathol 19:102–111
25. Rosmorduc O, Housset C (2010) Hypoxia: a link between fibrogenesis, angiogenesis, and carcinogenesis in liver disease. Semin Liver Dis 30:258–270
26. Copple BL, Bai S, Moon JO (2010) Hypoxia-inducible factor-dependent production of profibrotic mediators by hypoxic Kupffer cells. Hepatol Res 40:530–539
27. Corpechot C, Barbu V, Wendum D, Kinnman N, Rey C, Poupon R, Housset C, Rosmorduc O (2002) Hypoxia-induced VEGF and collagen I expressions are associated with angio-genesis and fibroangio-genesis in experimental cirrhosis. Hepatology 35:1010–1021
28. Takahara Y, Takahashi M, Zhang QW, Wagatsuma H, Mori M, Tamori A, Shiomi S, Nishiguchi S (2008) Serial changes in expression of functionally clustered genes in progression of liver fibrosis in hepatitis C patients. World J Gastroenterol 14:2010– 2022
29. Hui AY, Friedman SL (2003) Molecular basis of hepatic fibrosis. Expert Rev Mol Med 5:1–23
30. Halloran PF, Reeve J, Kaplan B (2006) Lies, damn lies, and statistics: the perils of the P value. Am J Transplant 6:10–11 31. Korosoglou G, Humpert PM (2007) Non-invasive diagnostic
imaging techniques as a window into the diabetic heart: a review of experimental and clinical data. Exp Clin Endocrinol Diabetes 115:211–220
32. Tatsumi C, Kudo M, Ueshima K, Kitai S, Ishikawa E, Yada N, Hagiwara S, Inoue T, Minami Y, Chung H, Maekawa K, Fujimoto K, Kato M, Tonomura A, Mitake T, Shiina T (2010) Non-invasive evaluation of hepatic fibrosis for type C chronic hepatitis. Intervirology 53:76–81
33. Tham RT, Heyerman HG, Falke TH, Zwinderman AH, Bloem JL, Bakker W, Lamers CB (1991) Cystic fibrosis: MR imaging of the pancreas. Radiology 179:183–186
34. van den Blink B, Wijsenbeek MS, Hoogsteden HC (2010) Serum biomarkers in idiopathic pulmonary fibrosis. Pulm Pharmacol Ther 23:515–520
35. Ahmed SH, Clark LL, Pennington WR, Webb CS, Bonnema DD, Leonardi AH, McClure CD, Spinale FG, Zile MR (2006) Matrix metalloproteinases/tissue inhibitors of metalloproteinases: rela-tionship between changes in proteolytic determinants of matrix composition and structural, functional, and clinical manifestations of hypertensive heart disease. Circulation 113:2089–2096