HAL Id: ensl-00151647
https://hal-ens-lyon.archives-ouvertes.fr/ensl-00151647
Preprint submitted on 5 Jun 2007
HAL is a multi-disciplinary open access
archive for the deposit and dissemination of
sci-entific research documents, whether they are
pub-lished or not. The documents may come from
teaching and research institutions in France or
abroad, or from public or private research centers.
L’archive ouverte pluridisciplinaire HAL, est
destinée au dépôt et à la diffusion de documents
scientifiques de niveau recherche, publiés ou non,
émanant des établissements d’enseignement et de
recherche français ou étrangers, des laboratoires
publics ou privés.
Lagrangian temperature, velocity and local heat flux
measurement in Rayleigh-Benard convection
Yoann Gasteuil, Woodrow Shew, Mathieu Gibert, Francesca Chillà, Bernard
Castaing, Jean-François Pinton
To cite this version:
Yoann Gasteuil, Woodrow Shew, Mathieu Gibert, Francesca Chillà, Bernard Castaing, et al..
La-grangian temperature, velocity and local heat flux measurement in Rayleigh-Benard convection. 2007.
�ensl-00151647�
ensl-00151647, version 1 - 5 Jun 2007
optical tracking, we obtain simultaneous measurements of position and temperature of the sensor as it is carried along by the flow in Rayleigh-B´enard convection, at Ra ∼ 1010
. We report on statistics of temperature, velocity, and heat transport in turbulent thermal convection. The motion of the sensor particle exhibits dynamics close to that of Lagrangian tracers in hydrodynamic turbulence. We also quantify heat transport in plumes, revealing self-similarity and extreme variations from plume to plume.
PACS numbers: 47.80.-v (Instrumentation for fluid flows); 44.27.+g (Convective heat transfer)
Understanding fluid motion and transport of heat due to thermal convection is crucial for progress in di-verse challenging and important problems such as climate change, processes in planetary and stellar cores, and ef-ficient temperature control in buildings. Numerous lab-oratory studies employing Rayleigh-B´enard experiments have uncovered laws which relate global heat flux and flow velocities to fluid properties, flow boundary geom-etry, and driving parameters [1]. More recently, several studies [2, 3] have focused on coherent flow structures, called plumes, which are ejected from the thermal bound-ary layers carrying heat into the convective flow. We present measurements from a novel temperature sensor which is carried along with the convective flow, i.e. La-grangian measurements. In this way we obtain statistics of simultaneous velocity, temperature, and heat trans-port dynamics throughout the lifetimes of many plumes. Lagrangian measurements are particularly well suited for studying flows where coherent structures [4] and mixing [5] are important, e.g. plumes mixing
temper-ature in convection. Recent Lagrangian experiments
with submillimeter-sized passive tracer particles have ad-vanced understanding of turbulence [6, 7, 8, 9]. In the context of convection, Lagrangian measurements have long been performed using meter-sized atmospheric bal-loons [10] or ocean floats [11]. Here we use a similar strat-egy, aided by advances in miniature sensors and com-munication devices [12], to probe temperature and flow properties at centimeter scales in Rayleigh-B´enard con-vection.
Our experimental setup is a rectangular vessel with height H = 40 cm and section 40 cm × 10 cm filled with water (for more detail, see [13]). The walls are made of poly-methylmetacrylate (PMMA), the top boundary is a copper plate chilled by a controlled water bath, and the bottom boundary is an electrically heated cop-per plate. The heater power is maintained at 230 W and the top plate is held at Tup = 19◦C, resulting in
a temperature difference ∆T = 20.3◦C between the top
and bottom plates. The resulting Rayleigh number is
Ra = gβ∆T H3/νκ = 3 × 10¹⁰, where g is acceleration
due to gravity, β = 2.95 × 10⁻⁴ K−1 is the thermal
ex-pansion coefficient of water and ν = 8.17 × 10⁻⁷m2s−1,
κ = 1.48 × 10⁻⁷m2s−1 its viscosity and thermal
diffu-sivity (values are given for the mean temperature of the flow 29.1◦C). The Nusselt number, defined as the total
heat flux normalized by κ∆T /H, is N u = 167.9 ± 0.2. Under these conditions, the convective regime is fully turbulent [13, 14, 15] and the mean flow is a steady, system-sized, convection roll with a rotation period of about 100 s.
The mobile sensor consists of a D = 21 mm diameter capsule containing temperature instrumentation, an RF emitter, and a battery. It is described in detail in [12] and we recount its basic features here. The capsule and fluid density are carefully matched within 0.05 percent so that it reliably follows the flow. Four thermistors (0.8 mm, 230 kΩ, response time 0.06 s in water) are mounted in the capsule wall protruding 0.5 mm into the surrounding flow. A resistance controlled oscillator is used to create a square wave whose frequency depends on the tempera-ture of the thermistors. This square wave is used directly to modulate the amplitude of the radio wave generated by the RF emitter. The temperature signal is recov-ered on-the-fly by a stationary receiver and a Labview program. The dynamic range of temperature detection is 80dB, with a resolution of 4 mK and 50 ms. In ad-dition, the capsule trajectory is recorded with a digital video camera, providing synchronous measurements of the position and temperature of the sensor as it is car-ried about by the fluid. With maximum flow velocities in the range 1-2 cm/s and a particle size of 21 mm, we are oversampling the dynamics by a factor of order 10. How-ever, the characteristic thickness of the thermal bound-ary layer is ℓT ∼ 12HN u−1 ∼ 1.2 mm and that of the
hydrodynamic boundary layer may be estimated [1] as ℓU ∼ ℓT(ν/κ)+1/3∼ 2 mm. Thus, the sensor is too large
to penetrate the boundary layers.
Before presenting more detailed statistics, we provide an overview of the raw data collected by the mobile
sen-2
FIG. 1: Temperature and velocity measurements of the mobile sensor. (a) trajectory with temperature color coding; (b) temperature; (c) vertical position; (d) vertical velocity; (e) cross correlation of temperature and velocity.
sor. Predominantly, the sensor moves in looping trajecto-ries the size of the convection cell with a period of about 100 s. The collective result of many fluid parcels (plumes) with such trajectories compose the large scale convection roll – one may also detect in Fig.1a the presence of sec-ondary rolls in the lower left and upper right corners. Although the main motion of the sensor is rather peri-odic, we point out that its temperature fluctuates widely and irregularly (see Fig.1b, c, d.) Fig.1e shows the cross-correlation between temperature and normalized veloc-ity. We find a maximum value of 0.6 at zero-time lag and confirmation of the 100 s period of the large scale roll. This correlation is about twice the value reported in [17] for local Eulerian measurements. We attribute these dynamics to the entrainment of the sensor by ther-mal plumes and associate the fluctuations in Figs1.b-d with variation between plumes. In addition to qualita-tive verification of this idea using Schlieren visualizations, it is consistent with previous studies which find plumes predominately near the side walls like the trajectory of our sensor [16, 17]. We explore these dynamics quantita-tively in the results to follow.
From the data in Fig.1, one may estimate
character-istic dimensionless numbers for the flow. From
inte-gral quantities one computes the inteinte-gral Reynolds num-ber Re = U H/ν ∼ 4000. The associated turbulent – Taylor based – Reynolds number is of the order of
Rλ∝
√
Re ∼ 63. We note that this value is very close to a local Reynolds number, defined from the actual motion of the Lagrangian sensor Re′= u
rmsℓrms/ν ∼ 60, where
ℓrms is the fluctuation of position along a ‘mean’
trajec-tory, urmsis the usual standard deviation of the velocity.
In this regime (Rλ ∼ 60), one expects turbulence with
significant intermittency in the velocity gradients [18]. Accordingly, we turn now to more detailed statistics
of our measurements including power spectra, increment probability distribution functions (PDF), and structure function scaling for velocity and temperature. The power spectra (in time) are shown in Fig.2a. The velocity spec-trum is close to the behavior expected for a Lagrangian tracer in a turbulent flow – f−2– although scaling range
is limited at such low Rλ. The temperature spectra is
ob-served to roughly mimic that of velocity with a steeper power law slope compared to measurements with a sta-tionary temperature probe. For such Eulerian measure-ments, experiments [19] measure slopes between -1.35 and -1.4 (≡ −7/5) while numerical studies [20] report -7/5 in the bulk and -5/3 near the side walls. Veloc-ity increments (Fig.2b) indicate that the sensor is sub-jected to rather intermittent acceleration with strongly non-Gaussian statistics – flatness is -21. Like the power spectrum, the shape of PDFs for different velocity in-crements is similar to those of a fluid particle in a tur-bulent flow – Fig.2b. Finally, we have computed the evolution of the structure functions for the vertical ve-locity Sp
vz(τ ) = h|vz(t + τ ) − vz(t)|pit; we observe an
extended region of relative scaling Sp
vz(τ ) ∝ [Svz2 (τ )]ξp
(for 0.3 s ≤ τ ≤ 10 s) with exponents ξ1 = 0.56, ξ2 =
1.00, ξ3 = 1.30, ξ4 = 1.50, ξ5 = 1.65, ξ6 = 1.7. These
values (determined with a 10% precision) are again in good agreement with experimental measurements for
La-grangian tracers in turbulence [7]. We also show in
Fig.2c the probability density function (PDF) of temper-ature increments measured by the mobile sensor. Similar to Eulerian measurements [17], their statistics are non Gaussian, with wider tails at small scale. In contrast to the velocity behavior (and to some Eulerian studies [20]), our Lagrangian temperature increments do not reveal a range of self-similar scaling.
−1 −0.5 0 0.5 1 1.5 2 2.5 −10 −8 log10( f.TR ) log −5 0 5 −4 −3 −2 −1 0 Normalized increments log 10 ( PDF ) (b) inc=0.84s inc=3.38s inc=6.77s inc=13.54s inc=36.02s Gauss −5 0 5 −4 −3 −2 −1 0 Normalized increments log 10 ( PDF ) (c) inc=0.1s inc=108s
FIG. 2: Temperature and velocity statistics. (a) Time spectra of temperature and vertical velocity of the sensor particle; the frequency is non-dimensionalized using the period TR= 100 s
of the large scale roll motion and curves have been shifted vertically for clarity). The solid straight line corresponds to an ideal f−2scaling; (b) PDFs of vertical velocity increments
(time lags are given in the inset); (c) PDFs of temperature increments for time lags equal to 0.1 and 102.4 s.
the dynamics of heat transport may be best analyzed in terms of a local heat flux vzθ′(t), where θ′(t) = θ(t) − θ
is the particle temperature variation from its time aver-aged temperature θ, and vz(t) its vertical velocity. Our
mobile sensor allows for a Lagrangian measurement of this quantity. In particular, we define a normalized La-grangian vertical heat transport
N uL(t) = 1 + H
κ∆T vz(t)θ
′(t) . (1)
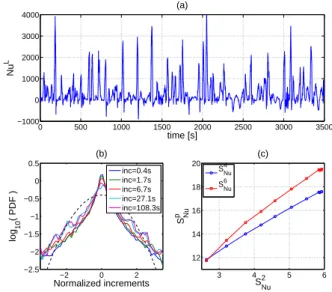
The time series N uL(t) is shown in Fig.3a. As expected,
it is most often positive since convective motions are as-sociated with either hot fluid rising or cold fluid sinking, in each case (vzθ′) > 0. The much less probable events
with (vzθ′) < 0 correspond, for instance, to the rise of
the particle when it is colder than its environment due to turbulent swirls in the flow. We find that the time averaged Lagrangian heat transport N uL= 328 is larger
than the global value (N u = 168 in our case). This indicates that our sensor preferentially samples the re-gions of the flow which carry higher than average heat, i.e. plumes. In contrast, the traditional Nusselt num-ber indiscriminately accounts for all regions in the flow such as the center of the cell where plumes rarely visit. Another prominent feature is the highly non-Gaussian, intermittent fluctuations of Lagrangian heat transport, which is similar to measurements with stationary probes at similar Rayleigh numbers [17].
To further quantify Lagrangian heat transport, we
0 500 1000 1500 2000 2500 3000 3500 −1000 0 time [s] −2 0 2 −2.5 −2 −1.5 −1 −0.5 0 0.5 Normalized increments log 10 ( PDF ) (b) inc=0.4s inc=1.7s inc=6.7s inc=27.1s inc=108.3s 3 4 5 6 12 14 16 18 20 S2Nu S p Nu (c) S4 Nu S6 Nu
FIG. 3: Lagrangian heat transport. (a) time series; (b) PDF of increments, and Gauss distribution (dashed line). (c) ESS plot of fourth and sixth order structure functions, vs the sec-ond order one (the secsec-ond order structure function has been shifted vertically).
have studied the statistics of the increments (in time) N uL(t + τ ) − NuL(t). Two features are noteworthy: (i)
as shown in Fig.3b, their PDFs are strongly non Gaus-sian from the smallest time increments to lags of the order of integral time TR; (ii) there exists a range of
relative scaling for their structure functions SN up (τ ) = h|NuL(t + τ ) − NuL(t)|pi
t, as shown in Fig.3c. The
relative exponents, SN up (τ ) ∝ [S2 N u(τ )]ξ N u p have values ξN u 1 = 0.54, ξN u2 = 1.00, ξN u3 = 1.37, ξ4N u= 1.68, ξ5N u = 1.93, ξN u
6 = 2.14 – the use of the second order structure
function as a reference is arbitrary. Comparison with the velocity shows that the Lagrangian heat flux is less inter-mittent; i.e. the PDFs of the local heat flux in Fig.3b are non Gaussian but their shapes do not evolve significantly as increments increase towards the large scale period TR.
A simple interpretation of the above statistical results is that thermal plumes may be defined as Lagrangian heat transport events (once detached from the thermal boundary layer); these events are in some way self-similar as will become clear below. In this light, we have ana-lyzed the portions of the sensor trajectories during which its vertical position lies between H/4 and 3H/4, i.e. the rise (or fall) of a hot (cold) plume. For each of these mo-tions, we compute the mean heat transport, and its fluc-tuation measured by the standard deviation computed over the portion of the trajectory. The results are re-ported in Fig.4. We observe that the heat transport has large variations from one plume to the next. The mean Lagrangian heat transport in these events (N upl= 335)
is quite close to the mean for the entire time series (N uL= 328), which indicates that the times the sensor is
4 not in a plume are relatively unimportant to heat
trans-port. Furthermore, the variation from plume to plume is quite large, rms(N upl) = 384, of the order as the mean.
During the trajectory of a single plume, the standard de-viation σ of N uplis proportional to the mean; σ = αN upl
where α = 0.5 ± 0.05. We note that the plume heat transport we measure matches within a factor of 2 the prediction of the model proposed in [22], though more experiments are required to test scaling laws for different Rayleigh numbers and fluid properties. Furthermore, we find that the characteristic time for temperature decay during the life-time of a plume is of the order of its travel time from one plate to the other, which also supports the model in [22]. 0 500 1000 1500 2000 2500 3000 3500 −500 0 500 1000 1500 2000 time [s] Nu (Plume)
FIG. 4: Plumes. Mean (dots) and standard deviation (error bars) of Lagrangian heat transport of consecutive plumes.
To summarize, we have reported novel measurements of Lagrangian temperature and heat transport using a
wireless, neutrally buoyant temperature sensor. The
sensor provides a new perspective on the dynamics of thermal plumes in turbulent Rayleigh-B´enard
convec-tion. We find that heat transport fluctuates greatly
from one plume to another and that these fluctuations suggest a self-similar character of plumes. A practical implication of our results is that in order to maximize heat transport, one should maximize the production of thermal plumes. This is supported by global N u versus Ra measurements in experiments [23, 24] with rough endplates. Future investigations will be focused on the scaling of plume heat transport for varying Ra and different fluids.
Acknowledgements
This work has been supported by Emergence Rhˆ
one-Alpes Contract No. 2005-12 and CNRS. We acknowledge useful discussions with Sergio Ciliberto and Romain Volk.
[1] See S. Grossmann, D. Lohse, J. Fluid Mech. 407, 27 (2000) for a review of scaling possibilities, and references therein of associated experimental measurements. [2] Q. Zhou, C. Sun, K.-Q. Xia, Phys. Rev. Lett. 98, 074501
(2007)
[3] S. Sun, Q. Zhou, K.-Q. Xia, Phys. Rev. Lett 97, 144504 (2006)
[4] M. A. Green, C. W. Rowley and G. Haller, J. Fluid Mech., 572 111 (2007)
[5] R. O. Fox, P. K. Yeung, Phys. Fluids, 15 961 (2003) [6] S. Ott, J. Mann, J. Fluid Mech., 422 207 (2000) [7] N. Mordant et al. Phys. Rev. Lett., 87(21), 214501,
(2001); N. Mordant, P. Metz, O. Michel, J.-F. Pinton, Rev. Sci. Instr. 76 025105 (2005)
[8] La Porta A.L., et al., Nature, 409, 1017, (2001); H. Xu et al. Phys. Rev. Lett. 96, 024503 (2006); M. Bourgoin et al., Science 311, 835 (2006).
[9] B. Luthi, A. Tsinober, W. Kinzelbach, J. Fluid Mech. 528, 87 (2005)
[10] F. Gifford, it Month. Weather Rev. 83(12), 293 (1955) S. Hanna, J. Appl. Meteo. 20, 242 (1981)
[11] R.-C. Lien, E.A. D’Asaro, G.T. Dairiki, J. Fluid Mech. 362, 177 (1998)
[12] W. Shew et al., Rev. Sci. Instr. 78, 1 (2007) [13] F Chill´a et al., Nouvo Cimento 15, 1229 (1993).
M. Gibert et al. Phys. Rev. Lett. 96, 084501 (2006). [14] B. Castaing et al., J. Fluid Mech. 204, 1 (1989). [15] B. Castaing, Phys. Rev. Lett. 65, 3209 (1990).
[16] X.-D. Shang, X.-L. Qiu, P. Tong, K.-Q. Xia, Phys. Rev. Lett. 90(7), 074501 (2003)
[17] X.-D. Shang, X.-L. Qiu, P. Tong, K.-Q. Xia, Phys. Rev E 70, 026308 (2004)
[18] B. W. Zeff, D. D. Lanterman, R. McAllister, R. Roy, E. J. Kostelich, D. P. Lathrop, Nature 421, 146 (2003) [19] J. A. Glazier, T. Segawa, A. Naert and M. Sano, Nature
398, 307 (1999)
X. Z. Wu, L. Kadanoff, A. Libchaber, and M. Sano, Phys. Rev. Lett. 64, 2140 (1990).
[20] R. Verzicco, R. Camussi, J. Fluid Mech. 477, 19 (2003) [21] E.S.C. Ching et al. , Phys. Rev. Lett. 93(12), 124501
(2004)
[22] S. Grossmann, D. Lohse, Phys. Fluids 16(12) 4462 (2004) [23] R. Camussi, R. Verzicco, Eur. J. Mech. B/Fluids 23, 427
(2004)
[24] S. Cilberto, S. Cioni, C. Laroche, Phys. Rev E54, R5901 (1996)