HAL Id: hal-00301481
https://hal.archives-ouvertes.fr/hal-00301481
Submitted on 26 Oct 2004HAL is a multi-disciplinary open access
archive for the deposit and dissemination of sci-entific research documents, whether they are pub-lished or not. The documents may come from teaching and research institutions in France or abroad, or from public or private research centers.
L’archive ouverte pluridisciplinaire HAL, est destinée au dépôt et à la diffusion de documents scientifiques de niveau recherche, publiés ou non, émanant des établissements d’enseignement et de recherche français ou étrangers, des laboratoires publics ou privés.
Differences in Arctic and Antarctic PSC occurrence as
observed by lidar in Ny-Ålesund (79° N, 12° E) and
McMurdo (78° S, 167° E)
M. Müller, R. Neuber, P. Massoli, F. Cairo, A. Adriani, M. L. Moriconi, G. Di
Donfrancesco
To cite this version:
M. Müller, R. Neuber, P. Massoli, F. Cairo, A. Adriani, et al.. Differences in Arctic and Antarctic PSC occurrence as observed by lidar in Ny-Ålesund (79° N, 12° E) and McMurdo (78° S, 167° E). Atmospheric Chemistry and Physics Discussions, European Geosciences Union, 2004, 4 (5), pp.6837-6866. �hal-00301481�
ACPD
4, 6837–6866, 2004 Differences in Arctic and Antarctic PSC occurrence as observed by lidar M. M ¨uller et al. Title Page Abstract Introduction Conclusions References Tables Figures J I J I Back CloseFull Screen / Esc
Print Version Interactive Discussion
Atmos. Chem. Phys. Discuss., 4, 6837–6866, 2004 www.atmos-chem-phys.org/acpd/4/6837/
SRef-ID: 1680-7375/acpd/2004-4-6837 © European Geosciences Union 2004
Atmospheric Chemistry and Physics Discussions
Di
fferences in Arctic and Antarctic PSC
occurrence as observed by lidar in
Ny- ˚
Alesund (79
◦
N, 12
◦
E) and McMurdo
(78
◦
S, 167
◦
E)
M. M ¨uller1, R. Neuber1, P. Massoli2, F. Cairo2, A. Adriani2, *, M. L. Moriconi2, and G. Di Donfrancesco3
1
Alfred Wegener Institute for Polar and Marine Research, Telegrafenberg A45, D-14473 Potsdam, Germany
2
Institute for Atmospheric Science and Climate, CNR, Via del Fosso del Cavaliere 100, 00133 Rome, Italy
3
Italian National Agency for New Technologies, Energy and Environment, ENEA C. R. Cassaccia, Via Anguillarese 301, 00060 Rome, Italy
*
now at: Institute for Physics of the Interplanetary Space, INAF, Via del Fosso del Cavaliere 100, 00133 Rome, Italy
Received: 6 July 2004 – Accepted: 1 October 2004 – Published: 26 October 2004 Correspondence to: M. M ¨uller (mmueller@awi-potsdam.de)
ACPD
4, 6837–6866, 2004 Differences in Arctic and Antarctic PSC occurrence as observed by lidar M. M ¨uller et al. Title Page Abstract Introduction Conclusions References Tables Figures J I J I Back CloseFull Screen / Esc
Print Version Interactive Discussion
© EGU 2004
Abstract
The extent of springtime Arctic ozone loss does not reach Antarctic “ozone hole” di-mensions because of the generally higher temperatures in the northern hemisphere vortex and consequent less polar stratospheric cloud (PSC) particle surface for het-erogeneous chlorine activation. Yet, with increasing greenhouse gases stratospheric
5
temperatures are expected to further decrease. To infer if present Antarctic PSC oc-currence can be applied to predict future Arctic PSC ococ-currence, lidar observations from McMurdo station (78◦S, 167◦E) and Ny- ˚Alesund (79◦N, 12◦E) have been anal-ysed for the 9 winters between 1995 (1995/1996) and 2003 (2003/2004). Although the statistics may not completely cover the overall hemispheric PSC occurrence, the
obser-10
vations are considered to represent the main synoptic cloud features as both stations are mostly situated in the centre or at the inner edge of the vortex. Since the focus is set on the occurrence frequency of solid and liquid particles, the analysis has been restricted to volcanic aerosol free conditions. In McMurdo, by far the largest part of PSC observations is associated with PSC type Ia. The observed constant background
15
of NAT particles and their potential ability to cause denoxification and irreversible deni-trification is presumably more important to Antarctic ozone chemistry than the scarcely observed PSC type II. Meanwhile in Ny- ˚Alesund, PSC type II has never been observed, while type Ia and Ib both occur in large fraction. Although they are also found solely, the majority of observations reveals solid and liquid particle layers in the same profile.
20
For the Ny- ˚Alesund measurements, the frequent occurrence of liquid PSC particles yields major significance in terms of ozone chemistry, as their chlorine activation rates are more efficient.
The relationship between temperature, PSC formation, and denitrification is non-linear and the McMurdo and Ny- ˚Alesund PSC observations imply that for predicted
25
stratospheric cooling it is not possible to directly apply current Antarctic PSC occur-rence directly to the Arctic stratosphere. Future Arctic PSC occuroccur-rence, and thus ozone loss, will depend on the shape and barotropy of the vortex rather than on the minimum
ACPD
4, 6837–6866, 2004 Differences in Arctic and Antarctic PSC occurrence as observed by lidar M. M ¨uller et al. Title Page Abstract Introduction Conclusions References Tables Figures J I J I Back CloseFull Screen / Esc
Print Version Interactive Discussion
temperatures.
1. Introduction
The spring-time ozone destruction in the polar stratosphere decisively depends on the amount of chlorine and other active halogen species which are converted from inactive reservoir gases in heterogeneous reactions on the surface of polar stratospheric cloud
5
(PSC) particles (Solomon, 1999). The activation rates as well as the effect on ozone depletion due to denitrification depend on the cloud type (Ravishankara and Hanson, 1996; Waibel et al., 1999; Fahey et al., 2001), while the formation of the different PSC types is tightly associated with the actual temperature and the temperature history (Tabazadeh et al., 1996; Larsen et al., 1997).
10
So far, the extent of Arctic ozone loss does not reach Antarctic “ozone hole” dimen-sions due to the generally higher temperatures in the Arctic vortex (WMO, 2003). Yet in the future, Arctic temperatures could fall below the threshold temperature for PSC formation over a broader spatial and temporal extent as increasing stratospheric water vapor (SPARC, 2000) and other greenhouse gases are expected to result in
radia-15
tive cooling of the stratosphere (Shindell et al., 1998; Forster and Shine, 1999; WMO, 2003). In addition, even ozone depletion itself is an important component of strato-spheric cooling (Randel and Wu, 1999; Langematz et al., 2003). A general temper-ature decrease has been observed in the stratosphere (Pawson and Naujokat, 1999; Ramaswamy et al., 2001), and a first empirical quantification of the relation between
20
stratospheric climate and the Arctic springtime ozone loss has been established (Rex et al., 2004). Still, due to the non-linearity of PSC formation processes, it is an open question how a stratospheric cooling trend influences the existence of PSCs in the Arctic vortex. Comparing PSC observations by lidar in Ny- ˚Alesund (79◦N, 12◦E) and McMurdo (78◦S, 167◦E), we discuss if present Antarctic PSC conditions can be applied
25
as forecast for the evolution of the Arctic ozone layer.
sea-ACPD
4, 6837–6866, 2004 Differences in Arctic and Antarctic PSC occurrence as observed by lidar M. M ¨uller et al. Title Page Abstract Introduction Conclusions References Tables Figures J I J I Back CloseFull Screen / Esc
Print Version Interactive Discussion
© EGU 2004 sonal evolution and preferred geographical region of PSC occurrence, as well as a
general descent of the clouds over the winter period (Poole and Pitts, 1994; Santace-saria et al., 2001; Adriani et al., 2004). Although the seasonal chronology of different PSC types is well documented for the stable Antarctic conditions (Gobbi et al., 1998; Santacesaria et al., 2001), the relative occurrence frequency of solid and liquid clouds
5
has not been determined so far.
Different types of polar stratospheric clouds were first identified according to their op-tical parameters retrieved by lidar (Browell et al.,1990; Toon et al., 1990). Although the formation mechanism for the solid type Ia particles is not yet completely understood, the cloud particles are meanwhile confirmed to consist of nitric acid trihydrate (NAT)
10
(Voigt et al., 2000). In terms of lidar measurements, PSC type Ia is characterised by a low backscatter ratio R532 nm≈1.3–1.5 and a volume depolarisation δV OL larger than
Rayleigh depolarisation due to the asphericity of the particles. The existence tempera-ture TNAT for PSC type Ia depends on the water vapor and nitric acid partial pressure (Hanson and Mauersberger, 1988).
15
The formation mechanism of the liquid type Ib particles is explained by aerosol growth models for supercooled ternary solutions (STS): below the existence tem-perature TST S, the droplets of the stratospheric background aerosol – consisting of H2SO4/H2O – take up HNO3/H2O to form HNO3/H2SO4/H2O ternary solution droplets (Tabazadeh et al., 1994; Carslaw et al., 1994). As the droplets are assumed to be
20
spherical, depolarisation lidar measurements allow to identify type Ib clouds by their low depolarisation (Gobbi et al., 1998). They typically have a moderate backscatter ratio of R532 nm≈2–8. Lidar observations in the Arctic suggest that many type Ib clouds also contain some solid particles, thus being liquid/solid external mixtures (Biele et al., 2001). Furthermore, layers of PSC type Ia and type Ib are frequently found in so-called
25
“sandwich-structures” in the same vertical profile (Shibata et al., 1999). The existence temperature TST S for PSC type Ib is found to be about 3–4 K lower than TNAT (Stein et al.,1999).
ACPD
4, 6837–6866, 2004 Differences in Arctic and Antarctic PSC occurrence as observed by lidar M. M ¨uller et al. Title Page Abstract Introduction Conclusions References Tables Figures J I J I Back CloseFull Screen / Esc
Print Version Interactive Discussion
of ice particles – is formed. While these ice clouds occur every winter in the southern hemisphere, they are still exceptional in the Arctic and commonly linked to mountain lee waves (e.g. Carslaw et al., 1998).
2. Arctic and Antarctic temperature conditions
Radiative cooling leads to the formation of a polar vortex in the winter polar
strato-5
sphere. Usually the strong and stable Antarctic vortex is zonally symmetric centred at the South Pole with barotropic conditions. Every winter the stratospheric tempera-tures are low enough for the existence of PSCs – even type II – over a broad extent in space and time. However, the year-to-year variability of vortex conditions in the Arctic is much larger due to higher atmospheric wave activity related to the different
10
land-sea distribution in the northern hemisphere. The Al ¨eutian High tends to shift the vortex towards Northern Europe, and sudden stratospheric warmings elongate or split the vortex during most of the winters. Consequently, the temperature distribution and thus the Arctic PSC existence volume strongly depend on the dynamical situation of each winter (Pawson and Naujokat, 1999). So far, even in cold Arctic winters Antarctic
15
temperature conditions are not matched.
An overview of the temperature conditions in Ny- ˚Alesund and McMurdo is given in Figs. 1 and 2, displaying monthly mean temperature profiles that have been calculated from radiosonde profiles (Ny- ˚Alesund) and ECMWF analysis (McMurdo) of the different winter months, respectively. The Ny- ˚Alesund profiles shown in Fig. 1 represent
aver-20
ages over at least 25 soundings each for the months December, January, and March, and 23 soundings for February. The large Arctic year-to-year variability in stratospheric temperatures becomes obvious by the large scattering of the different profiles. Only in a few cases the monthly mean temperature drops below TNAT, indicating that PSC existence in Ny- ˚Alesund is limited to single periods within these winters.
25
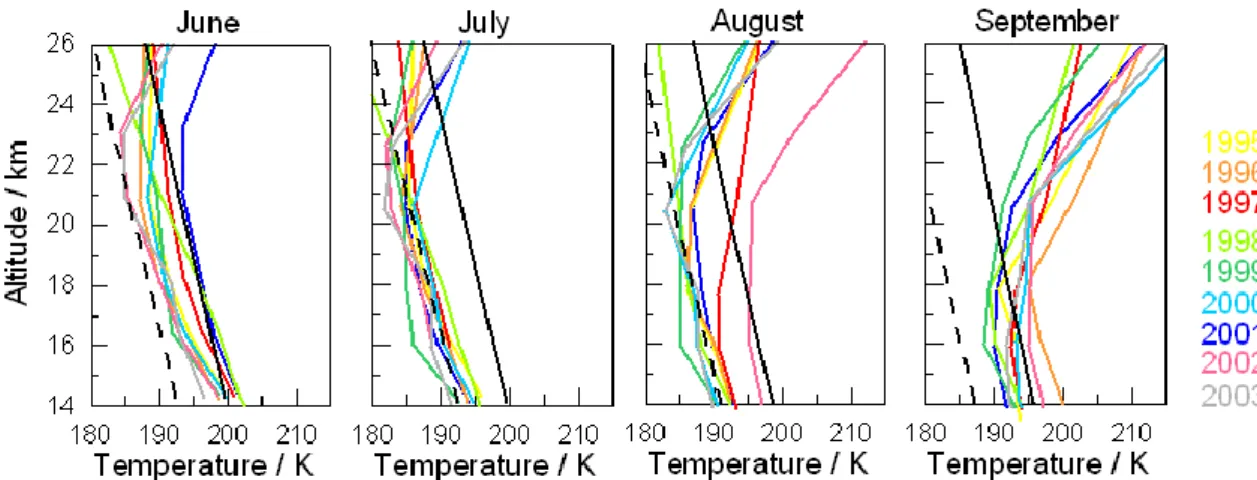
As the regular radiosoundings at McMurdo hardly ever cover the PSC altitude range, Fig. 2 shows the monthly mean temperature profiles for the station as interpolated
ACPD
4, 6837–6866, 2004 Differences in Arctic and Antarctic PSC occurrence as observed by lidar M. M ¨uller et al. Title Page Abstract Introduction Conclusions References Tables Figures J I J I Back CloseFull Screen / Esc
Print Version Interactive Discussion
© EGU 2004 from the closest grid points in ECMWF analyses. Since the profiles are grouped fairly
close together, the year-to-year variability is obviously much smaller. Solely the mean temperature profile for August 2002 stands out due to the first Antarctic major mid-winter warming observed ever (Kr ¨uger et al., 2004). During the months June, July and August, the average stratospheric temperature above McMurdo is well below TNAT
5
and to some extent even below TIce, hence PSC existence is possible over a broad vertical range and a long time period each winter. The intense Antarctic PSC period is known to cause widespread denitrification and dehydration of stratospheric layers due to HNO3 and H2O redistribution by sedimenting particles (Fahey et al., 1990; V ¨omel et al., 1995; Nedoluha et al., 2000). Therefore, the PSC existence temperatures TNAT
10
and TICE in late winter are shifted towards lower temperatures. In September, ice PSC existence is no longer possible above McMurdo, but type Ia PSCs may still occur in the lowermost stratosphere.
The averaged temperature profiles above Ny- ˚Alesund and McMurdo (Figs. 1 and 2, respectively) reflect the common temperatures in the Arctic and Antarctic stratosphere.
15
The T<TNAT range and thus the potential PSC volume is much larger and more persis-tent in the Antarctic. Furthermore, the PSC type II may be expected to occur frequently in McMurdo according to the given temperatures below the frost point.
3. Instrument and data set description
In our study, stratospheric aerosol lidar data from the Arctic Koldewey-Station in
Ny-20
˚
Alesund, Spitsbergen (79◦N, 12◦E), and the Antarctic station McMurdo (78◦S, 167◦E) are analysed. Both stations provide multi-year data sets of lidar measurements at
λ=532 nm, including depolarisation measurements. To avoid an influence of enhanced
volcanic aerosol load in the stratosphere (e.g. Mt. Pinatubo eruption 1991), only data from 1995 onwards have been taken into account. In addition, it should be kept in mind
25
that stratospheric lidar measurements are limited to periods without tropospheric cloud coverage.
ACPD
4, 6837–6866, 2004 Differences in Arctic and Antarctic PSC occurrence as observed by lidar M. M ¨uller et al. Title Page Abstract Introduction Conclusions References Tables Figures J I J I Back CloseFull Screen / Esc
Print Version Interactive Discussion
The Ny- ˚Alesund lidar was first set up in 1988, but since then has been refined and improved several times. The data used in this study refer to the second harmonic (532 nm) of a Nd:YAG laser with a pulse frequency of 30 Hz. The backscattered light is received with a 60 cm diameter telescope, and a mechanical shutter (chopper) pre-vents the detectors from saturation by large signals from low altitudes. The 532 nm
5
signal is detected with photo-multipliers (EMI 9863A) in the parallel and perpendicu-lar poperpendicu-larisation plane, with the ratio of the two poperpendicu-larisation signals defining the volume depolarisation. The multi-channel counters used for data acquisition allow a height res-olution of∆z=30 m. A comprehensive description of the overall system including other available wavelengths, is found e.g. in Biele et al. (2001) and references therein.
Reg-10
ular meteorological radiosondes provide atmospheric temperature and thus density profiles at least once per day. The Ny- ˚Alesund data set comprises measurements dur-ing the northern hemispheric winter periods, and here we focus on winters 1995/1996 to 2003/2004. In favourable weather conditions the lidar is operated continuously, pro-viding evaluated profiles integrated over 10 min.
15
The basic version of the Antarctic lidar system in McMurdo Station (Ross Island, 78◦S, 167◦E) was installed during the 1990 spring (Gobbi et al., 1991; Adriani et al., 1992). The Nd:YAG laser emits polarized light at 532 nm, and atmospheric echoes are detected both at parallel and perpendicular polarisation. The system is equipped with a receiver consisting of a 41.5 cm diameter Newtonian telescope with a field of
20
view smaller than 1 mrad. The wavelength acceptance is reduced to a band of 0.15 nm around the emitted laser wavelength by an interposed interference filter. A 400 Hz chopper shutting off the photomultipliers while the atmospheric echo comes from low altitudes eliminates non-linearity effects of the cooled photodetectors. Improvements have been applied to the system in 1992 when the power was increased (from 150 to
25
250 mJ) along with the pulse rate (4 Hz to 10 Hz). The retrieved profiles have a vertical resolution of ∆z=75 m and are obtained averaging 3000 laser shots (6 min acquisi-tion). Under suitable weather conditions two measurements per day are performed. Although regular radiosoundings are also provided in McMurdo on a daily basis, most
ACPD
4, 6837–6866, 2004 Differences in Arctic and Antarctic PSC occurrence as observed by lidar M. M ¨uller et al. Title Page Abstract Introduction Conclusions References Tables Figures J I J I Back CloseFull Screen / Esc
Print Version Interactive Discussion
© EGU 2004 temperature profiles only reach altitudes lower than 18 km due to the early balloon
burst caused by low temperatures. Integration of data is then realized using satellite and model temperatures provided by NCEP.
For comparability of the Ny- ˚Alesund and McMurdo dataset, in this study the PSC occurrence has been counted per day, allowing multiple PSC types on the same day
5
both in succession or at the same time. The statistical analysis of the observed PSC types reveals differences in PSC occurrence between Ny- ˚Alesund and McMurdo that do not match the expectations drawn from the temperature differences.
4. Statistical analysis of different PSC types
From the lidar measurements, the observed PSCs have been classified according to
10
Table 1, geared to the historical classification (Browell et al., 1990; Toon et al., 1990). The applied classification criteria are backscatter ratio R532 nm and volume depolarisa-tion δV OL. For further analysis, the PSC type Ia criteria is extended to contain also the PSC type Ia enhanced that is assumed to consist of NAT particles at higher number density (Tsias et al., 1999).
15
Figure 3 shows the number of days with PSC observation in McMurdo and Ny-˚
Alesund for winters 1995 to 2003 and 1995/1996 to 2003/2004, respectively. The total number of days with PSC observation in McMurdo (395) is about 5 times higher than in Ny- ˚Alesund (77), a fact that can be attributed to the high temperature variability and generally higher temperatures at the Arctic station.
20
As the PSC observations are split up into days with occurrence of different PSC types, the picture gets more diverse (Fig. 3).
In McMurdo, by far the largest part of PSC observations is associated with PSC type Ia, consisting of solid NAT particles. In 96% (379) of all days with PSC observation, a layer of PSC type Ia is found in the profile. More than half of these cases (201) also
25
feature the characteristics of type Ia enhanced (not shown here). The PSC type Ib has been observed on 53 days (13%). Surprisingly, the PSC type II occurred on less than
ACPD
4, 6837–6866, 2004 Differences in Arctic and Antarctic PSC occurrence as observed by lidar M. M ¨uller et al. Title Page Abstract Introduction Conclusions References Tables Figures J I J I Back CloseFull Screen / Esc
Print Version Interactive Discussion
9% (35) of the days when PSCs were observed.
The distribution of PSC types is very different in the Ny- ˚Alesund observations. While the PSC type II has never been observed in Ny- ˚Alesund, type Ia and Ib both occur in large fraction. On 75% (58) of all PSC days, the PSC type Ia has been detected, displaying particle characteristics of type Ia enhanced in about one third of these cases
5
(not shown here). Most frequently (85%, 66), the PSC type Ib is found in Ny- ˚Alesund. Figure 3 implies that different PSC types occur on the same day or even in the same profile. The contemporaneousness of different PSC types is addressed in Fig. 4. Here, the clouds are separated in those consisting of liquid (type Ib) and solid (type Ia and type II) particles.
10
Since only a small fraction of PSC observations in McMurdo is made up by PSC type Ib, it is not surprising that by far the majority of PSC observation days contains only solid cloud signals. Furthermore, the largest part of the liquid clouds occurs together with solid clouds, and only 4% of the PSC observation days comprise solely PSC type Ib.
15
In most Ny- ˚Alesund cases, both liquid and solid clouds are observed on the same day, indicating the occurrence of so-called sandwich-structures. On 25% of the PSC observation days only liquid PSCs (type Ib) are found, while in 14% solid PSC (type Ia) particles are detected solely in the profiles.
In any case it should be kept in mind that the presented statistic does not represent
20
the general hemispheric observations. Both Ny- ˚Alesund and McMurdo are considered to be mostly situated in the centre or at the inner edge of the vortex, respectively, with synoptic scale PSCs accounting for the majority of the observed PSCs. Yet especially in the Arctic, mesoscale PSCs that frequently occur in the vicinity of the Scandinavian mountain ridge may shift the given picture for the Arctic (e.g. Carslaw et al., 1998, 1999;
25
ACPD
4, 6837–6866, 2004 Differences in Arctic and Antarctic PSC occurrence as observed by lidar M. M ¨uller et al. Title Page Abstract Introduction Conclusions References Tables Figures J I J I Back CloseFull Screen / Esc
Print Version Interactive Discussion
© EGU 2004
5. Discussion
The following paragraphs illuminate the measurements behind the statistics in more detail, and discuss their significance for the prediction of Arctic ozone depletion.
For the McMurdo dataset it has been realized that the PSC type Ia is present almost every time that PSCs are detected (Fig. 3). In fact it is found that a constant
“back-5
ground” of solid aerosol (NAT) particles exists throughout almost every winter (Adriani et al., 2004). Other particles types, ice crystals (type II) or liquid STS droplets (type Ib), are generated in addition to this NAT background, modulating the existing background PSC lidar signal. An example is given in Fig. 5 for the period 15 July to 5 August 2001. The shown profiles (Fig. 5) are typical for the McMurdo PSC observations. Solid
non-10
spherical particles, recognized by their high volume depolarisation larger than the ex-pected molecular value (1.44%), are present in every profile. On 15 July, a cloud layer of PSC type Ia and Ia enhanced spreads over a broad vertical range of about 10 km. Although ten days later, on 25 July, the PSC is almost not identifiable by its rather low backscatter ratio, the depolarisation measurements clearly indicate the presence of
15
solid particles. Furthermore, depolarising layers with low backscatter ratio may give an indication for the existence of NAT rocks which the given lidar systems can not properly observe due to their low particle number densities (Adriani et al., 2004). On 5 August, PSC type II and Ia enhanced are superimposed on the solid background particles that cover a broad range between roughly 14 and 24 km. The constant appearance of solid
20
background particles suggests that NAT has a very long lifetime in the Antarctic vortex. The controlling factor of NAT particle lifetime and growth is the concentricity of the polar vortex (Mann et al., 2002). Concentric vortex conditions are mostly present in the Antarctic, allowing NAT particles to exist and grow once they have formed, since their trajectories do not leave the T<TNAT region. The region corresponding the Antarctic
25
inner vortex edge has been called “freezing belt” (Tabazadeh et al., 2001) due to its suitability for the growth of solid particles. Under the condition of long-term exposure to temperatures below TNAT, particles grow to NAT rock size and start sedimenting due
ACPD
4, 6837–6866, 2004 Differences in Arctic and Antarctic PSC occurrence as observed by lidar M. M ¨uller et al. Title Page Abstract Introduction Conclusions References Tables Figures J I J I Back CloseFull Screen / Esc
Print Version Interactive Discussion
to gravitation, thus denitrifying the upper part of the T<TNAT range (Mann et al., 2002). In the Antarctic, this process is found to occur rapidly over a broad altitude range when the duration over an average PSC event is about 2 weeks (Tabazadeh et al., 2000).
Early studies suggested that denitrification is associated with dehydration caused by sedimentation of ice particles, pronouncing the importance of PSC type II occurrence
5
for severe ozone depletion. Meanwhile it has been found that the onset of Antarctic denitrification happens before the onset of dehydration and that large PSC type Ia play a crucial role for stratospheric denitrification above the frost point (WMO, 2003).
The fact that denitrification occurs without the necessity of PSC type II existence (WMO, 2003) underlines the importance of large NAT particles (Waibel et al., 1999;
10
Fahey et al., 2001). Even without significant denitrification, the permanence of NAT particles over a broad spatial range during the late Antarctic winter months is supposed to have a large impact on ozone chemistry by temporarily removing HNO3from the gas phase. In contrary to denitrification, this so-called denoxification is a reversible process, but has the same effect on ozone depletion chemistry. Concerning the McMurdo lidar
15
dataset, the observed constant background of NAT particles and their potential ability to cause denoxification and denitrification is therefore presumably more important to ozone chemistry than the scarce occurrence of PSC type II. The statistics of the lidar observations in McMurdo emphasise the relevance of type Ia PSCs in the Antarctic.
Taking into account the Ny- ˚Alesund dataset of Arctic PSCs, a difference in the
rela-20
tive occurrence of solid and liquid clouds becomes obvious. Here, the solid PSC type Ia and the liquid PSC type Ib occur equally frequent, the latter even more often (Fig. 3). Both PSC types are observed solely, but the majority of observations reveals solid and liquid particle layers in the same profile (Fig. 4). According examples are given in Figs. 6 to 8.
25
Figure 6 shows the PSC type Ia solely observed on 9 December 2002. Regarding the occurrence of solid PSC particles, December 2002 was a unique period in
Ny-˚
Alesund. So far, it was the only month when solid particles were observed solely and over a broad vertical range, resembling the solid background particles found in
ACPD
4, 6837–6866, 2004 Differences in Arctic and Antarctic PSC occurrence as observed by lidar M. M ¨uller et al. Title Page Abstract Introduction Conclusions References Tables Figures J I J I Back CloseFull Screen / Esc
Print Version Interactive Discussion
© EGU 2004 McMurdo and potentially causing denitrification. The profiles in Fig. 6 reveal that the
T<TNAT range exceeds below the edge of the cloud. Solid clouds with smaller vertical extent with respect to the T<TNAT range are observed frequently, a fact that may be related to variations in the HNO3 and H2O field, or to differences in the temperature trajectory and thus different conditions for NAT particle formation. Yet, the idea that
5
T<TNAT does not necessarily imply the occurrence of solid PSCs is still not adequately considered in ozone depletion models.
As an example of a solely observed PSC type Ib, a lidar profile detected on 22 January 2001 is shown in Fig. 7. The predominance of liquid particles is recognized by the volume depolarisation that is smaller than the depolarisation of air (1.44%). Still,
10
the presence of solid particles in the cloud can not be excluded (Biele et al., 2001). The PSC is detected over a broad vertical range of several kilometres and correlates well with the presumed T<TST S range. The PSC type Ib is found frequently, but occurs more often together with solid cloud layers in so-called sandwich structures as shown in Fig. 8.
15
In this example of 21 February 1997, cloud layers of type Ia enclose a broad layer of PSC type Ib. This kind of sandwich structure is just one typical example of the several Ny- ˚Alesund multi-layer observations. Frequently, only one of the surrounding layers is found. In other cases, several layers of type Ia and Ib alternate. The given example (Fig. 8) is very expressive to explain the existence of mixed state PSCs. As found
20
from the cross-polarising backscatter R532 s(not shown here), solid NAT particles exist throughout the whole range between 16 and 24 km. In the altitude range from 19 to 22 km, the lower ambient temperature allows liquid STS droplets to grow. In this layer, the backscatter contribution of the liquid particles is much higher and they dominate the depolarisation signal, classifying the cloud layer as PSC type Ib. The formation
25
of sandwich structured PSCs depends on the given temperature history and ambient temperature of the cloud air mass (Shibata et al., 1999).
In principle, similar behaviour is also observed in McMurdo. Yet it seems that the liquid particles rarely dominate the lidar backscatter signal and thus do not appear as
ACPD
4, 6837–6866, 2004 Differences in Arctic and Antarctic PSC occurrence as observed by lidar M. M ¨uller et al. Title Page Abstract Introduction Conclusions References Tables Figures J I J I Back CloseFull Screen / Esc
Print Version Interactive Discussion
PSC type Ib layers. An example is given for 20 July 2001 (Fig. 9).
While between about 17 and 19 km the backscatter ratio within this PSC type Ia enhanced is slightly rising from R532 nm=5 to 6, the volume depolarisation dramatically drops to values around δV OL=3%. Since there is no apparent reduction in backscatter ratio and thus particle cross-section, the only explanation for this depolarisation
dimin-5
ishment is the presence of additional spherical (liquid) particles. The observed volume depolarisation remains above the depolarisation of pure air (1.44%) as the solid par-ticles of the PSC type Ia enhanced clearly dominate the backscatter signal within this mixed state cloud. It is possible that a large part of the available HNO3 is already bound in the NAT particles with the consequence that the liquid STS droplets cannot
10
grow efficiently. Overall, the cloud is classified as solid PSC type Ia.
In Ny- ˚Alesund, the liquid PSCs yield major significance as they represent a large fraction of the PSC observations. Liquid PSC particles have been shown to activate chlorine more efficiently than frozen particles (Ravishankara and Hanson, 1996; Bor-rmann et al., 1997) and thus have a larger direct impact. Possible future cooling of the
15
stratosphere may shift the conditions for the phase and composition of Arctic PSCs. Lower stratospheric temperatures in the Arctic are expected to enhance ozone loss due to an increase in PSC volume (Rex et al., 2004). Still, the observations in McMurdo and Ny- ˚Alesund imply that an additional stratospheric cooling may not be applied di-rectly to PSC occurrence. Although lower minimum temperatures may advance the
20
rate of ice PSC (type II) occurrence in the Arctic, the more important factor seems to be the possible formation of a NAT particle “background”.
In the future, a further cooling of the stratosphere is expected both due to direct radiative cooling caused by increasing greenhouse gases (WMO, 2003) and due to indirect dynamical cooling by a reduction of planetary wave activity that causes an
25
increase of the polar night jet and an adiabatic cooling of the high latitudes (Shindell et al., 1998; Langematz et al., 2003). The change of stratospheric dynamics due to the reduction of wave activity is discernable by the intensification and increased lifetime of the polar vortices (Waugh et al., 1999; Zhou et al., 2000). As wave activity
ACPD
4, 6837–6866, 2004 Differences in Arctic and Antarctic PSC occurrence as observed by lidar M. M ¨uller et al. Title Page Abstract Introduction Conclusions References Tables Figures J I J I Back CloseFull Screen / Esc
Print Version Interactive Discussion
© EGU 2004 is responsible for the dislocation of the Arctic vortex centre and the cold pool, the
reduction of wave activity results in a more concentric vortex. The intensification thus provides favourable conditions for NAT particle growth and denitrification.
Furthermore, the significant increase in the persistence of the polar vortices (Waugh et al., 1999; Zhou et al., 2000) extends the NAT existence later into springtime, so
5
denoxification may become an important issue for Arctic ozone depletion chemistry.
6. Summary
Polar stratospheric cloud observations by lidar in Ny- ˚Alesund and McMurdo have been analysed regarding the relative occurrence of different cloud types in the Arctic and Antarctic, respectively. The study was confined to the years after 1995 to avoid
ef-10
fects of enhanced volcanic aerosol loading in the stratosphere. We are aware that the statistical approach does not represent the general hemispheric PSC patterns, but we presume that both stations are mostly situated inside the vortex with synoptic scale PSCs accounting for the majority of the observed PSCs. Moreover, stratospheric lidar measurements are limited by tropospheric cloud coverage.
15
The total number of days with PSC observation in McMurdo was found to be about 5 times higher than in Ny- ˚Alesund due to the high temperature variability and generally higher temperatures in the Arctic. Looking at the diversity of cloud types at the two stations, the differences are more significant. Ice PSCs (type II) have never been measured in Ny- ˚Alesund, but they are found in McMurdo. Yet, their occurrence is much
20
less frequent than expected from stratospheric temperatures. In fact, being observed on less than 9% of all days with PSC occurrence in McMurdo, the PSC type II may be of less importance to ozone depletion than commonly suggested. More relevance could weigh on NAT particles, since solid PSC type Ia particles were found in the McMurdo lidar profiles in more than 95% of all days with PSC occurrence. Actually constant
25
“background” of solid stratospheric aerosol particles exists throughout almost every winter in McMurdo (Adriani et al., 2004). The observations suggest a long NAT particle
ACPD
4, 6837–6866, 2004 Differences in Arctic and Antarctic PSC occurrence as observed by lidar M. M ¨uller et al. Title Page Abstract Introduction Conclusions References Tables Figures J I J I Back CloseFull Screen / Esc
Print Version Interactive Discussion
lifetime in the Antarctic vortex.
Vortex concentricity and long-term exposure to temperatures below TNAT are nec-essary to allow long NAT particle lifetime, effective particle growth, and consequent sedimentation and denitrification (Mann et al., 2002). The fact that denitrification has been observed to occur also without the necessity of PSC type II existence (WMO,
5
2003) underlines the importance of large NAT particles. Furthermore, the constant appearance of NAT particles over a broad spatial range has similar effects on ozone chemistry by temporarily removing HNO3 from the gas phase. When photochemical ozone depletion starts with returning sunlight, reversible denoxification by PSC parti-cles has the same effect as irreversible denitrification. Denoxification becomes more
10
important with the persistence of the polar vortex into springtime. Regarding the po-tential to cause denoxification and denitrification, the McMurdo lidar observations of a solid particle background emphasise the relevance of type Ia PSCs in the Antarctic, im-plying NAT particles even more relevant to ozone chemistry than the scarcely occurring PSC type II. The PSC type Ib is found only on 4% of the days with PSC observation in
15
McMurdo, indicating that liquid particles do not play a significant role in the Antarctic. At the Arctic station Ny- ˚Alesund, the relative frequency occurrence of solid and liquid clouds differs unambiguously. In Ny- ˚Alesund both PSC type Ia and type Ib occur on a large fraction of PSC observation days (75% and 85%, respectively). The frequent oc-currence of the liquid PSC type Ib yields major significance in terms of ozone chemistry.
20
While solid NAT particles affect ozone chemistry rather indirectly by inducing denitrifi-cation, the liquid STS droplets act more directly due to their efficient chlorine activation rates (Ravishankara and Hanson, 1996; Borrmann et al., 1997). Both cloud types are observed solely in the Ny- ˚Alesund lidar profiles, but most often occur as multi-layered clouds in the same profile. Only in December 2002 constant appearance of type Ia
25
particles similar to the McMurdo measurements has been observed and assumed to have caused denitrification.
Northern hemisphere vortex temperatures and dynamics still prevent the Arctic ozone loss from reaching Antarctic “ozone hole” dimensions, but stratospheric
tem-ACPD
4, 6837–6866, 2004 Differences in Arctic and Antarctic PSC occurrence as observed by lidar M. M ¨uller et al. Title Page Abstract Introduction Conclusions References Tables Figures J I J I Back CloseFull Screen / Esc
Print Version Interactive Discussion
© EGU 2004 peratures are expected to decrease (Shindell et al., 1998; WMO, 2003). For earlier
Arctic winters, it was found that lower stratospheric temperatures result in larger ozone loss linked by an increase in PSC volume (Rex et al., 2004). Yet, denitrification plays a major role in ozone chemistry (Rex et al., 1997; Waibel et al., 1999; Gao et al., 2001), and the relationship between temperature, PSC formation and denitrification is
5
nonlinear. Therefore, the observations in McMurdo and Ny- ˚Alesund imply that for ad-ditional stratospheric cooling it is not possible to directly apply current Antarctic PSC occurrence to the Arctic to infer future ozone loss.
Although lower minimum temperatures in the Arctic may increase the rate of PSC type II occurrence, the development of a constant NAT background like in McMurdo
10
may have a larger impact due to denitrification. Certainly, as stratospheric cooling in-duces changes in stratospheric dynamics, creating a more stable and persistent Arctic vortex (Waugh et al., 1999; Zhou et al., 2000), the conditions for a long NAT particle lifetime are improved. Future Arctic PSC occurrence, and thus ozone loss, will there-fore depend rather on the shape and barotropy of the vortex than on the minimum
15
temperatures.
Acknowledgements. We wish to thank the station teams in Ny- ˚Alesund and McMurdo for their diligent lidar data acquisition. The work was in part funded through the European Commission project EVK2-2000-00707 (MAPSCORE).
References
20
Adriani, A., Deshler, T. , Gobbi, G. P., Johnson, B. J., and Di Donfrancesco, G.: Polar strato-spheric clouds over McMurdo, Antarctica, during the 1991 spring: Lidar and particle counter measurements, Geophys. Res. Lett., 19, 1755–1758, 1992.
Adriani, A., Massoli, P., Di Donfrancesco, G., Cairo, F., Moriconi, M. L., and Snels, M.: Cli-matology of polar stratospheric clouds based on lidar observations from 1993 to 2001 over
25
McMurdo Station, Antarctica, J. Geophys. Res., accepted, 2004.
Non-ACPD
4, 6837–6866, 2004 Differences in Arctic and Antarctic PSC occurrence as observed by lidar M. M ¨uller et al. Title Page Abstract Introduction Conclusions References Tables Figures J I J I Back CloseFull Screen / Esc
Print Version Interactive Discussion
equilibrium coexistence of solid and liquid particles in Arctic stratospheric clouds, J. Geophys. Res., 106, 22 991–23 007, 2001.
Borrmann, S., Solomon, S., Dye, J. E., Baumgardner, D., Kelly, K. K., and Chan, K. R.: Het-erogeneous reactions on stratospheric background aerosols, volcanic sulfuric acid droplets, and type I polar stratospheric clouds: effects of temperature fluctuations and differences in
5
particle phase, J. Geophys. Res., 102, 3639–3648, 1997.
Browell, E. V., Butler, C. F., Ismail, S., Robinette, P. A., Carter, A. F., Higdon, N. S., Toon, O. B., Schoeberl, M. R., and Tuck, A. F.: Airborne lidar observations in the wintertime Arctic stratosphere: polar stratospheric clouds, Geophys. Res. Lett., 17, 385–388, 1990.
Carslaw, K. S., Luo, B. P., Clegg, S. L., Peter, T., Brimblecombe, P., and Crutzen, P. J.:
Strato-10
spheric aerosol growth and HNO3 gas phase depletion from coupled HNO3 and water uptake by liquid particles, Geophys. Res. Lett., 21, 2479–2482, 1994.
Carslaw, K. S., Wirth, M., Tsias, A., Luo, B. P., D ¨ornbrack, A., Leutbecher, M., Volkert, H., Renger, W., Bacmeister, J. T., Reimer, E., and Peter, T.: Increased stratospheric ozone depletion due to mountain-induced atmospheric waves, Nature, 391, 675–678, 1998.
15
Carslaw, K. S., Peter, T., Bacmeister, J. T., and Eckermann, S. D.: Widespread solid particle formation by mountain waves in the Arctic stratosphere, J. Geophys. Res., 104, 1827–1836, 1999.
D ¨ornbrack, A., Leutbecher, M., Reichardt, J., Behrendt, A., M ¨uller, K. P., and Baumgarten, G.: Relevance of mountain wave cooling for the formation of polar stratospheric clouds over
20
Scandinavia: Mesoscale dynamics and observations for January 1997, J. Geophys. Res., 106, 1569–1582, 2001.
Fahey, D. W., Kelly, K. K., Kawa, S. R., Tuck, A. F., Loewenstein, M., Chan, K. R., and Heidt, L. E.: Observations of denitrification and dehydration in the winter polar stratospheres, Nature, 344, 321–324, 1990.
25
Fahey, D. W., Gao, R. S., Carslaw, K. S., Kettleborough, J., Popp, P. J., Northway, M. J., Holecek, J. C., Ciciora, S. C., McLaughlin, R. J., Thompson, T. L., Winkler, R. H., Baumgardner, D. G., Gandrud, B., Wennberg, P., Dhaniyala, S., McKinney, K., Peter, T., Salawitch, R. J., Bui, T. P., Elkins, J. W., Webster, C. R., Atlas, E. L., Jost, H., Wilson, J. C., Herman, R. L., Kleinb ¨ohl, A., and von K ¨onig, M.: The detection of large HNO3-containing particles in the winter Arctic
30
stratosphere, Science, 291, 1026–1031, 2001.
Forster, P. M. de F. and Shine, K. P.: Stratospheric water vapour changes as a possible contrib-utor to observed stratospheric cooling, Geophys. Res. Lett., 26, 3309–3312, 1999.
ACPD
4, 6837–6866, 2004 Differences in Arctic and Antarctic PSC occurrence as observed by lidar M. M ¨uller et al. Title Page Abstract Introduction Conclusions References Tables Figures J I J I Back CloseFull Screen / Esc
Print Version Interactive Discussion
© EGU 2004 Gao, R. S., Richard, E. C., Popp, P. J., Toon, G. C., Hurst, D. F., Newman, P. A., Holecek, J.
C., Northway, M. J., Fahey, D. W., Danilin, M. Y., Sen, B., Aikin, K., Romashkin, P. A., Elkins, J. W., Webster, C. R., Schauffler, S. M., Greenblatt, J. B., McElroy, C. T., Lait, L. R., Bui, T. P., and Baumgardner, D.: Observational evidence for the role of denitrification in Arctic stratospheric ozone loss, Geophys. Res. Lett., 28, 2879–2882, 2001.
5
Gobbi, G. P., Deshler, T., Adriani, A., and Hoffmann, D. J.: Evidence for denitrification in the 1990 Antarctic spring stratosphere: lidar and temperature measurements, Geophys. Res. Lett., 18, 1995–1998, 1991.
Gobbi, G. P., Di Donfrancesco, G., and Adriani, A.: Physical properties of stratospheric clouds during the Antarctic winter of 1995, J. Geophys. Res., 103, 10 859–10 873, 1998.
10
Hanson, D. R. and Mauersberger, K.: Laboratory studies of the nitric acid trihydrate: implica-tions for the south polar stratosphere, Geophys. Res. Lett., 15, 855–858, 1988.
Kr ¨uger, K., Naujokat, B., and Labitzke, K.: The unusual midwinter warming in the southern hemisphere stratosphere 2002: a comparison to northern hemisphere phenomena, J. At-mos. Sci., accepted, 2004.
15
Langematz, U., Kunze, M., Kr ¨uger, K., Labitzke, K., and Roff, G. L.: Thermal and dynami-cal changes of the stratosphere since 1979 and their link to ozone and CO2 changes, J. Geophys. Res., 108, 4027, doi: 10.1029/2002JD002069, 2003.
Larsen, N., Knudsen, B. M., Rosen, J. M., Kjome, N. T., Neuber, R., and Kyr ¨o, E.: Tempera-ture histories in liquid and solid polar stratospheric cloud formation, J. Geophys. Res., 102,
20
23 505–23 517, 1997.
Mann, G. W., Davies, S., Carslaw, K. S., and Chipperfield, M. P.: Polar vortex con-centricity as a controlling factor in Arctic denitrification, J. Geophys. Res., 107, 4663, doi:10.1029/2002JD002102, 2002.
Nedoluha, G. E., Bevilacqua, R. M., Hoppel, K. W., Daehler, M., Shettle, E. P., Hornstein, J. H.,
25
Fromm, M. D., Lumpe, J. D., and Rosenfield, J. E.: POAM III measurements of dehydration in the Antarctic lower stratosphere, Geophys. Res. Lett., 27, 1683–1686, 2000.
Pawson, S. and Naujokat, B.: The cold winters of the middle 1990s in the northern lower stratosphere, J. Geophys. Res., 104, 14 209–14 222, 1999.
Poole, L. R. and Pitts, M. C.: Polar stratospheric cloud climatology based on Stratospheric
30
Aerosol Measurement II observations from 1978 to 1989, J. Geophys. Res., 99, 13 083– 13 089, 1994.
ACPD
4, 6837–6866, 2004 Differences in Arctic and Antarctic PSC occurrence as observed by lidar M. M ¨uller et al. Title Page Abstract Introduction Conclusions References Tables Figures J I J I Back CloseFull Screen / Esc
Print Version Interactive Discussion
Koshelkov, Y., Labitzke, K., Lin, J.-J. R., O’Neill, A., Nash, J., Randel, W., Rood, R., Shine, K., Shiotani, M., and Swinbank, R.: Stratospheric temperature trends: observations and model simulations, Rev. Geophys., 39, 71–122, 2001.
Randel, W. J. and Wu, F.: Cooling of the Arctic and Antarctic polar stratospheres due to ozone depletion, J. Clim., 12, 1467–1479, 1999.
5
Ravishankara, A. R. and Hanson, D. R.: Differences in the reactivity of type I polar stratospheric clouds depending in their phase, J. Geophys. Res., 101, 3885–3890, 1996.
Rex, M., Harris, N. R. P., von der Gathen, P., Lehmann, R., Braathen, G. O., Reimer, E., Beck, A., Chipperfield, M. P., Alfier, R., Allaart, M., O’Connor, F., Dier, H., Dorokhov, V., Fast, H., Gil, M., Kyr ¨o, E., Litynska, Z., Mikkelsen, I. S., Molyneux, M. G., Nakane, H., Notholt, J.,
10
Rummukainen, M., Viatte, P., and Wenger, J.: Prolonged stratospheric ozone loss in the 1995-96 Arctic winter, Nature, 389, 835–838, 1997.
Rex, M., Salawitch, R. J., von der Gathen, P., Harris, N. R. P., Chipperfield, M. P., and Nau-jokat, B.: Arctic ozone loss and climate change, Geophys. Res. Lett., 31, L04116, doi: 10.1029/2003GL018844, 2004.
15
Santacesaria, V., MacKenzie, A. R., and Stefanutti, L.: A climatological study of polar strato-spheric clouds (1989–1997) from LIDAR measurements over Dumont d’Urville (Antarctica), Tellus, 53B, 306–321, 2001.
Shibata, T., Shiraishi, K., Adachi, H., Iwasaka, Y., and Fujiwara, M.: On the lidar-observed sandwich structure of polar stratospheric clouds (PSCs), 1. Implications for the mixing state
20
of the PSC particles, J. Geophys. Res., 104, 21 603–21 611, 1999.
Shindell, D. T., Rind, D., and Lonergan, P.: Increased polar stratospheric ozone loss and de-layed eventual recovery owing to increasing greenhouse-gas concentrations, Nature, 392, 588–592, 1998.
Solomon, S.: Stratospheric ozone depletion: a review of concepts and history, Rev. Geophys.,
25
37, 275–316, 1999.
SPARC (Stratospheric Processes and Their Role in Climate): SPARC Assessments of Upper Tropospheric and Stratospheric Water Vapor, edited by: Kley, D., Russell III, J. M., and Phillips, C., World Climate Research Program Report 113, SPARC Report 2, Verri `eres le Buisson, France, 2000.
30
Stein, B., Wedekind, C., Wille, H., Immler, F., M ¨uller, M., W ¨oste, L., del Guasta, M., Morandi, M., Stefanutti, L., Antonelli, A., Agostini, P., Rizi, V., Readelli, G., Mitev, V., Matthey, R., Kivi, R., and Kyr ¨o, E.: Optical classification, existence temperatures, and coexistence of different
ACPD
4, 6837–6866, 2004 Differences in Arctic and Antarctic PSC occurrence as observed by lidar M. M ¨uller et al. Title Page Abstract Introduction Conclusions References Tables Figures J I J I Back CloseFull Screen / Esc
Print Version Interactive Discussion
© EGU 2004 polar stratospheric cloud types, J. Geophys. Res., 104, 23 983–23 993, 1999.
Tabazadeh, A., Turco, R. P., Drdla, K., Jacobson, M. Z., and Toon, O. B.: A study of type I polar stratospheric cloud formation, Geophys. Res. Lett., 21, 1619–1622, 1994.
Tabazadeh, A., Toon, O. B., Gary, B. L., Bacmeister, J. T., and Schoeberl, M. R.: Observational constraints on the formation of type Ia polar stratospheric clouds, Geophys. Res. Lett., 23,
5
2109–2112, 1996.
Tabazadeh, A., Santee, M. L., Danilin, M. Y., Pumphrey, H. C., Newman, P. A., Hamill, P. J., and Mergenthaler, J. L.: Quantifying denitrification and its effect on ozone recovery, Science, 288, 1407–1411, 2000.
Tabazadeh, A., Jensen, E. J., Toon, O. B., Drdla, K., and Schoeberl, M. R.: Role of the
strato-10
spheric polar freezing belt in denitrification, Science, 291, 2591–2594, 2001.
Toon, O. B., Browell, E. V., Kinne, S., and Jordan, J.: An analysis of lidar observations of polar stratospheric clouds, Geophys. Res. Lett., 17, 393–396, 1990.
Tsias, A., Carslaw, K. S., Peter, T., Wirth, M., Renger, W., Biele, J., Neuber, R., Mehrtens, H., von Zahn, U., Reichardt, J., Wedekind, C., Stein, B., Santacesaria, V., Stefanutti, L.,
15
and Bacmeister, J.: Aircraft lidar observations of an enhanced type Ia PSC during APE-POLECAT, J. Geophys. Res., 104, 23 961–23 969, 1999.
Voigt, C., Schreiner, J., Kohlmann, A., Zink, P., Mauersberger, K., Larsen, N., Deshler, T., Kr ¨oger, C., Rosen, J., Adriani, A., Cairo, F., Di Donfrancesco, G., Viterbini, M., Ovarlez, J., Ovarlez, H., David, C., and D ¨ornbrack, A.: Nitric acid trihydrate (NAT) in polar stratospheric
20
clouds, Science, 290, 1756–1758, 2000.
V ¨omel, H., Oltmans, S. J., Hofmann, D. J., Deshler, T., and Rosen, J. M.: The evolution of the dehydration in the Antarctic stratospheric vortex, J. Geophys. Res., 100, 13 919–13 926, 1995.
Waibel, A. E., Peter, T., Carslaw, K. S., Oelhaf, H., Wetzel, G., Crutzen, P. J., P ¨oschl, U.,
25
Tsias, A., Reimer, E., and Fischer, H.: Arctic ozone loss due to denitrification, Science, 283, 2064–2069, 1999.
WMO (World Meteorological Organization): Scientific Assessment of Ozone Depletion: 2002, Global Ozone Research and Monitoring Project, Report No. 47, 498 pp., Geneva, 2003.
ACPD
4, 6837–6866, 2004 Differences in Arctic and Antarctic PSC occurrence as observed by lidar M. M ¨uller et al. Title Page Abstract Introduction Conclusions References Tables Figures J I J I Back CloseFull Screen / Esc
Print Version Interactive Discussion
Table 1. PSC classification applied for the statistical analysis on McMurdo and Ny- ˚Alesund PSC observations.
PSC Type Backscatter Ratio Volume Depolarisation Particles Ia R532 nm>1.3 >1.44% solid NAT (Ia enhanced) 2>R532 nm<10 >1.44% solid NAT
Ib R532 nm>2 <1.44% liquid STS
ACPD
4, 6837–6866, 2004 Differences in Arctic and Antarctic PSC occurrence as observed by lidar M. M ¨uller et al. Title Page Abstract Introduction Conclusions References Tables Figures J I J I Back CloseFull Screen / Esc
Print Version Interactive Discussion
© EGU 2004
Fig. 1. Ny- ˚Alesund monthly mean temperature profiles in winters from 1995/1996 to 2003/2004 (color-coded), from December (left) to March (right). TNAT (black line) and TIce(black dashed line) are given assuming 5 ppmv H2O and 10 ppbv HNO3.
ACPD
4, 6837–6866, 2004 Differences in Arctic and Antarctic PSC occurrence as observed by lidar M. M ¨uller et al. Title Page Abstract Introduction Conclusions References Tables Figures J I J I Back CloseFull Screen / Esc
Print Version Interactive Discussion
Fig. 2. McMurdo monthly mean temperature profiles from grid point interpolation of ECMWF
analyses in winters from 1995 to 2003 (colour-coded), from June (left) to September (right). TNAT (black line) and Ti ce (black dashed line) are given assuming 10 ppbv HNO3 with 5 ppmv
H2O in June and July, 4 ppmv H2O in August, and 2 ppmv H2O in September to account for dehydration effects.
ACPD
4, 6837–6866, 2004 Differences in Arctic and Antarctic PSC occurrence as observed by lidar M. M ¨uller et al. Title Page Abstract Introduction Conclusions References Tables Figures J I J I Back CloseFull Screen / Esc
Print Version Interactive Discussion
© EGU 2004
Fig. 3. Number of days with PSC observation in McMurdo (left panel) and Ny- ˚Alesund (right panel). The total number of PSC observation days is split into the different PSC types according to the classification given in Table 1.
ACPD
4, 6837–6866, 2004 Differences in Arctic and Antarctic PSC occurrence as observed by lidar M. M ¨uller et al. Title Page Abstract Introduction Conclusions References Tables Figures J I J I Back CloseFull Screen / Esc
Print Version Interactive Discussion
Fig. 4. Days with PSC observation in McMurdo (left) and Ny- ˚Alesund (right) divided into days when only solid (type Ia and/or type II) PSCs were detected (red), when only liquid (type Ib) PSCs were detected (blue), and when both solid and liquid PSC signals were found (purple).
ACPD
4, 6837–6866, 2004 Differences in Arctic and Antarctic PSC occurrence as observed by lidar M. M ¨uller et al. Title Page Abstract Introduction Conclusions References Tables Figures J I J I Back CloseFull Screen / Esc
Print Version Interactive Discussion
© EGU 2004
Fig. 5. McMurdo lidar measurements on 15 July (a), 25 July (b) and 5 August (c), each with
backscatter ratio (black line, upper axis) and volume depolarisation (red line, lower axis). The dashed line marks backscatter ratio R532 nm=1. Be aware that the axis in panel (c) has a different
ACPD
4, 6837–6866, 2004 Differences in Arctic and Antarctic PSC occurrence as observed by lidar M. M ¨uller et al. Title Page Abstract Introduction Conclusions References Tables Figures J I J I Back CloseFull Screen / Esc
Print Version Interactive Discussion
Fig. 6. Lidar measurement in Ny- ˚Alesund on 9 January 2002, with backscatter ratio (left panel) and volume depolarisation (centre panel) integrated between 02:35 and 02:47 UTC, dashed lines indicating the Rayleigh background. The temperature profile (right panel) is interpolated from the Ny- ˚Alesund radiosondes closest in time, and given with TNAT (orange line), TST S(green line) and TIce(blue line). The range of the detected PSC type Ia is shaded orange.
ACPD
4, 6837–6866, 2004 Differences in Arctic and Antarctic PSC occurrence as observed by lidar M. M ¨uller et al. Title Page Abstract Introduction Conclusions References Tables Figures J I J I Back CloseFull Screen / Esc
Print Version Interactive Discussion
© EGU 2004
Fig. 7. Lidar measurement in Ny- ˚Alesund on 22 January 2001, with backscatter ratio (left panel) and volume depolarisation (centre panel) integrated between 00:18 and 00:29 UTC, dashed lines indicating the Rayleigh background. The temperature profile (right panel) is interpolated from the Ny- ˚Alesund radiosondes closest in time, and given with TNAT (orange line), TST S(green line) and TIce(blue line). The range of the detected PSC type Ib is shaded blue.
ACPD
4, 6837–6866, 2004 Differences in Arctic and Antarctic PSC occurrence as observed by lidar M. M ¨uller et al. Title Page Abstract Introduction Conclusions References Tables Figures J I J I Back CloseFull Screen / Esc
Print Version Interactive Discussion
Fig. 8. Lidar measurement in Ny- ˚Alesund on 21 January 1997, with backscatter ratio (left panel) and volume depolarisation (centre panel) integrated between 21:02 and 21:12 UTC, dashed lines indicating the Rayleigh background. The temperature profile (right panel) is interpolated from the Ny- ˚Alesund radiosondes closest in time, and given with TNAT (orange line), TST S(green line) and TIce (blue line). The range of the detected PSC type Ia and type Ib is shaded orange and blue, respectively.
ACPD
4, 6837–6866, 2004 Differences in Arctic and Antarctic PSC occurrence as observed by lidar M. M ¨uller et al. Title Page Abstract Introduction Conclusions References Tables Figures J I J I Back CloseFull Screen / Esc
Print Version Interactive Discussion
© EGU 2004
Fig. 9. Lidar measurement in McMurdo on 20 July 2001, with backscatter ratio (left panel)
and volume depolarisation (centre panel), dashed lines indicating the Rayleigh background. The temperature profile (right panel) is taken from the local radiosonde (dashed grey line) and NCEP (black line), and given with TNAT (orange line), TST S(green line) and TIce(blue line). The range of the presumably mixed state PSC is shaded cyan.