PATTERN AND RATE OF WITHIN-FIELD DISPERSAL
AND BIONOMICS OF THE COWPEA A P H I D ,
APHIS CRACCIVORA (APHIDIDAE),
ON SELECTED COWPEA CULTIVARS
I. BILLY ANNAN1, GEORGE A. SCHAEFERS2, WARD M. TINGEY3AND KAILASH N . SAXENA4
1
E.I. du Pont de Nemours & Company, Agricultural Enterprise Stine-Haskell Labs, Elkton Road, P.O. Box 30, Newark, DE 19714-0030, USA;
2
Cornell University, Department of Entomology, New York State Agricultural Experiment Station, Barton Lab, Box 462, Geneva, NY 14456-0462, USA;
•^Cornell University, Qepartment of Entomology, Insectary Building Tower Road, Ithaca, NY 14853-2604, USA;
•international Centre of Insect Physiology and Ecology, Mbita Point Field Station P.O. Box 30, Mbita, Kenya
{Accepted 30 April 1999)
Abstract—Comparative field studies were conducted during the rainy and dry seasons at the Mbita
Point Field Station of ICIPE in southwestern Kenya, to investigate the pattern and rate of dispersal
of Aphis craccivora on aphid-resistant (ICV-12) and aphid-susceptible (ICV-1) cowpea cultivars in
relation to key weather factors. The effects of the dispersal trends on crop performance and aphid population dynamics were analysed. Treatments consisted of initial aphid releases at the north, south, west, east and centre of test plots and uninfested controls maintained on plants for 22 days. Parameters recorded included: pattern (direction of spread of aphids) and rate (number of aphid-infested plants at a given time) in test plots; crop growth and yields and associated factors such as incidence of sooty mould and plant mortality, and aphid density and associated factors, including the incidence of natural enemy species, particularly coccinellids. Dispersal was fastest when releases were made in the west, north and centre of plots, and resulted in adverse effects on ICV-1 growth and yields. Infestations of ICV-12 did not significantly affect crop performance. There was an apparent direct, positive relationship between wind direction and pattern of spread of aphid infestations, but this pattern was more apparent during the rainy season, when wind speeds were higher, than during the dry season. The incidence of natural enemy species correlated with the spread of aphid infestations, while the abundance of coccinellids correlated with aphid density.
Key Words: Aphis craccivora, wind direction, within-field dispersal, phenology, cowpea, Vigna unguicidata, aphid natural enemies, bionomics, Kenya
Resume—Des essais comparatifs en champs on ete conduits en saison seche et en saison pluvieuse
a la Station Experimentale de 1' ICIPE, a Mbita-Point (Sud-Ouest du Kenya). Ceux-ci avaient pour objet d'etudier, en fonction des facteurs climatiques principaux, le mode de repartition et les taux de dispersion du puceron Aphis craccivora chez cultivars de niebe, dont le premier (ICV-12) resistant et le second (ICV-1) sensible. Les effets du mode de dispersion sur la performance de la culture et la dynamique de populations du puceron etaient analyses. Les traitements consistaient en lachers initiaux de pucerons dans les points cardinaux (nord, sud, ouest, est, centre) des parcelles
Corresponding author: IBA.
I. B. ANNAN et al.
experimentales et temoins. Les pucerons etaient maintenus sur les plantes pour une duree de 22 jours. Les parametres etudies etaient la direction de dispersion du puceron et le taux d'infestation des plantes, a l'interieur des parcelles sous essais et a un temps donne; la croissance des plantes et les rendements. En plus de ces parametres, etaient etudies des facteurs associes comme 1' incidence de miellat et la deperissement de la plante; la densite du puceron et les facteurs associes dont: l'incidence des ennemis naturels et plus particulierement les coccinelles. La dispersion des pucerons etait plus rapide quand les lachers etaient effectues dans les parties ouest, nord ou centre des parcelles. De tels lachers avaient des effets nefastes sur la croissance et les rendements du cultivar ICV-1. Les infestations du cultivar ICV-12 n'ont pas significativement affecte la performance de la culture. II y avait une relation directe et positive entre la direction du vent et la dispersion des infestations du puceron. Bien encore, cette dispersion etait plus apparente pendant la saison pluvieuse quand la vitesse du vent etait plus grande, plutot qu'en saison seche. L' incidence des ennemis naturels collerait avec la dispersion des infestations de pucerons tandis que 1' abondance de coccinelles collerait avec la densite du puceron.
Mots Cles: Apliis craccivora, direction du vent, dispersion a 1' interieur du champ, phenologie, niebe, Vigna unguiculata, ennemis naturels du puceron, bionomies, Kenya
INTRODUCTION
A
phis craccivora Koch, known commonly ascowpea aphid or groundnut aphid, is the most important aphid pest of cowpeas worldwide (Singh and van Emden, 1979). It attacks all growth stages of the crop. Cowpea, Vigna
unguiculata (L.) Walp., is a cosmopolitan pulse
crop that is an important staple in human diets in tropical regions of the world. It is also widely vised in agronomic and soil management practices, and has pharmaco-medicinal value (Singh and Rachie, 1985).
Gutierrez (1987), stated that population dynamics resulting from interactions of herbivorous insects, their host plants and natural enemies were affected by the biological characteristics of the interacting species, and by spatial and temporal changes in weather. He further stated that the migratory phase of a species' life cycle is most susceptible to adverse weather, which subsequently affects population growth. Effects of environmental factors on aphid development, behaviour and population dynamics have been extensively documented by Dixon (1973) and others. Gutierrez et al., (1974b) mentioned that weather, rather than natural enemies, was more important in regulating A. craccivora populations. According to that author, temperature directly affects aphid phenology, while effects of soil moisture is indirect, via host plants.
It is known that in crowded conditions, aphids produce a large number of migratory alate offspring (Johnson, 1957). As a result, long distance movements and colonisation of remote resources is achieved by alates, which are usually transported
by prevailing wind currents (Rainey, 1973; Pedgley, 1982). However, Robert (1988) reported that in calm air, the alate aphids can undertake short, hovering flights called 'trivial flights', within the vicinity of host plants. Kennedy (1950) mentioned that such short flights are often provoked by brief feeding probes that are ideal for spreading non-persistent virus diseases.
After the final nymphal moult, young adult alatae of most aphid species undertake long-distance migratory flight, by actively flying upwards into upper air currents. Hence, wind factors significantly influence aphid dispersal and patterns of infestations on field crops. Conversely, localised within-field colonisation of plants is done by the apterae (Ferrar, 1969), in slow diffusive dispersal (Dixon, 1985). Robert (1988) stated that during searching modes, apterous aphids could walk for distances of > 35 cm per min., although the covered distances varied for different aphid species.
The Rothamsted Insect Survey program has deployed suction traps in the United Kingdom and other parts of Europe, to characterise the distribution and spread of several aphid species in order to analyse or forecast their agricultural significance (Taylor, 1977). According to Tatchell (1991), aerial monitoring provides continuous unbiased random samples of flying aphids, and is preferable to the labour-intensive sampling of patchily distributed populations on plants. Such analysis of insect population dynamics were described by Southwood (1978).
Effects of various biotic and abiotic factors on aspects of the biology of A. craccivora have been well-documented (Gutierrez et al., 1974a; Messina et al., 1985; Ofuya, 1993; Annan et al., 1997). Similar
studies with other aphid species on different crop plants have also been reported (Kennedy et al., 1959,1961; Turl, 1980; Dixon, 1985,1990; Deguine et al., 1994; Bommarco and Ekbom, 1995). However, studies of dispersion of A. craccivora on cowpeas, and the resulting effects on crop performance have not been well-studied, although understanding such aspects of aphid-crop interactions is crucial for predicting cowpea aphid infestations, the potential impact on crop production and thus, the timely institution of effective pest management programmes.
Therefore, the main objective of this work was to study the pattern and rate of cowpea aphid dispersal in field plots of resistant and susceptible cultivars of cowpea, and to determine the impact of dispersal on crop performance. Specific objectives of the study were to: (i) establish the characteristics of within-field aphid dispersal in cowpeas and correlate spread of infestations with wind speed and direction; (ii) determine effects of spread of infestations on aphid population dynamics; and (iii) assess the impact of aphid spread on cowpea growth and yield performance. Cowpea cultivars used in the studies were cv. ICV-12 resistant) and cv. ICV-1 (aphid-susceptible), both of which were registered by the ICIPE (Pathak and Olela, 1986). ICV-1, a plant selection developed from landraces of eastern Kenya, has an indeterminate growth habit, and is highly susceptible to A. craccivora (Pathak, 1988). ICV-12, which was originally labelled as 'Mutant 2', was developed through point mutation on a chromosome of ICV-1 using y-irradiation (Pathak and Olela, 1986). It is a mid-season cultivar which matures in 65 to 75 days. According to Pathak (1988), ICV-12 is commonly used as a genetic source for selecting for high levels of resistance to the aphid.
The genetics of resistance of ICV-12 and other resistant cowpea lines ha ve been well-documented by Ombakho et al. (1987), Bata et al. (1987) and Pathak (1988). The classification of mechanisms of cowpea aphid resistance in ICV-12, and the effects of host plant resistance on aphid population dynamics and on crop performance have also been well-studied (Ofuya, 1989, 1993; Annan, 1992).
MATERIALS AND METHODS
Location
The study was conducted at the Mbita Point Field Station (MPFS) of the International Centre of Insect
Physiology and Ecology (ICIPE), Kenya. The station is located 1240 m above sea level on the southeastern shores of Lake Victoria, just below the equator at latitude 0°30'S and longitude 34°15'E.
Environmental and meteorological information
The soil type at MPFS was Black Cotton clay-loam with: a slope of ca. 2^4%, pH of 7.4-8.7 and low organic matter content (0.6-1.0%) throughout the soil profile. The soil was also shallow to moderate in depth (25-80 cm), and had a high water table (120 cm). There were high levels of sodium salts, low potassium, low phosphorus, poor aeration, and poor drainage, causing problems of deep root penetration. The vegetation is typical bushland with fairly warm climate throughout the year. Meteorological conditions included: ca. 900 mm annual precipitation; 1650-2300 mm evaporation; 70-90% RH; and mean annual temperature of 22°C, with a range of 19-21°C between March and August, and 25-28°C from September to February.
Experimental design
The study consisted of 3 field experiments. The first experiment was conducted during the long rainy season at MPFS, between March and June 1990. The second experiment was carried out during the dry season, from July to October 1990; while the third experiment was done in the short rainy season at MPFS, between November 1990 and February 1991.
Experiments were designed as split plots. Whole-plot factors consisted of 6 treatments, including 5 locations of initial aphid release into the test plots and an uninfested control treatment (U). Sub-plots comprised the 2 cowpea cultivars (ICV-12 and ICV-1). The locations of aphid releases were at the corners of the test plots that corresponded to the north (N), south (S), east (E), west (W); as well as the centre (C) of selected plots. Five adult apterae were artificially-infested on plants at the designated locations within a plot. Each plot was caged and the test aphids were released onto plants that were located exactly at the north-central, south-central, east-central, west-central and true west-central locations. There were 3 blocks in each experiment, with each block consisting of 12 plots corresponding to 6 aphid treatments on the 2 crop cultivars. Each plot was covered with a field cage measuring 3 m long by 3 m wide by 2 m high. Cages consisted of wooden
I. B. ANNAN et al.
planks draped with a 32-mesh per mm2 No-See-Um® polyester fabric.
Each plot contained 25 plants arranged in 5 rows of 5 plants with spacing of 50 cm between and within rows, equivalent to a density of 40,000 plants/ha. In each experiment, planting of all plots was done on the same day. At crop emergence, test plots were randomly selected within a field. Plants that were outside of test plots were removed to eliminate inter-plot interference from natural infestations of non-test plants. Just before the administration of infestations, treatments (initial locations of aphid release) were randomly assigned to the test plots.
Aphid rearing and treatment administration
Aphids used in infestations were obtained from clones that were progenies of a maternal individual that was originally collected from a cowpea field at the MPFS, in February 1990. Aphid colonies were maintained on plants of a different aphid-susceptible cowpea cultivar (VITA-7) in the greenhouse at 27 ± 1°C, 50-80% RH and 12:12 (L:D) cycle. Fresh plant material of the cultivar were regularly added to the rearing colonies to maintain vigour in the populations.
Installation of cages on test plots was done just before plants were infested with aphids. Infestations were administered at the crop's second-trifoliate stage. Treatments were maintained for 22 days after infestation (DAI). The duration was chosen to simulate the observed mean duration of a rearing generation of A.
craccivora on cowpeas. After the stipulated period,
aphids were removed from plants by spraying with permethrin as Ambush® (ICI-Twiga Chemicals,, Nairobi) at a rate of 0.005 1/1 (0.0099 g a.i./l). Spraying was done with a 20 1 knapsack sprayer Model RY-2 819571® (Hardi Co., Nairobi) that was fitted with a flat-fan nozzle, calibrated at 0.6 1 of spray/min at 2.1 kg/cm2 pressure.
Response variables
The following entomological parameters were recorded: mean aphid density per plant at 1,8,15 and 22 DAI; mean number of all aphid natural enemy species (predators and parasitoids), and mean density of coccinellid predators per plot. Also, the pattern (direction) and rate (number of plants) of colonisation by aphids, denoted as spread of aphid infestations in each plot, were
noted for each DAI by assessing the number of plants colonised and their locations within plots. In the assessment of the spread of aphid infestations, a plant was classified as infested when it had 5 or more aphids, or when an infesting aphid had started larviposition resulting in a settled and growing colony. Data for aphid counts were analysed using repeated measures model to test for interactions of date of observation with sub-plots.
Plant response variables analysed included: extended leaf height (ELH), recorded as the height from thebase to the tallest growing tip. ELHs were measured at 1,8,15 and 22 DAI, and were analysed using repeated measures model. Other parameters measured included the mean: number of infested plants at the respective DAI, plant mortality, and incidence of sooty mould. Crop growth rate (CGR, g/dm2 land area/day), measured as total biomass accumulation in the above-ground plant portions per unit area per unit time (Gardner et al. 1985), was also recorded. The CGR was estimated using differences in dry weights obtained through destructive sampling of designated plants in each plot (one plant at the time of initial infestation, and another plant at the last observation date when treatments were terminated). At harvest, the number of pods per plant and seeds per pod were recorded as yield parameters.
During each experiment, ambient weather parameters including temperature, relative humidity and wind speed within test cages were recorded daily. Also, general wind patterns and total rainfall were noted. Wind factors were measured at the top canopy level (ca. 50 cm above the ground), since that is the level at which infesting populations were mainly observed. Rainfall was recorded using an automatic rain gauge (Wilhelm-Lambrecht, Gottingen, Germany), while the other environmental factors were recorded using an Automatic Weather Station (Campbell Scientific, Loughborough, UK). Recordings were donehourly or sometimes every 2 hours within a 12-hour period (between 6 am and 6 pm) in each plot at each selected DAI.
In order to eliminate the effects of differences in soil moisture between the growing seasons as a potential confounding factor, the dry season crop planting was regularly irrigated using overhead sprinklers. The irrigation was regulated to simulate rainfall and to attain soil moisture similar to levels observed during the rainy season experiments.
Data analysis
Tests of the normality of distributions for the aphid and plant data collected were done using Datadesk® v3.0rl for Macintosh® (Odesta Corp., Northbrook, IL). Subsequently, the appropriate data analyses were done using general linear models (GLM) and standard analysis of variance (ANOVA) in JMP™ v2.01 software for Macintosh® (SAS Institute, 1990). When significant (P < 0.05) differences were detected, multiple comparisons of means were analysed using the least significant difference (LSD) procedure (Sokal and Rohlf, 1969; Saville, 1990).
Due to a lack of normality of distributions for the data on aphid counts, plant mortality, and plants infected with sooty mould, those data were transformed using V(Y + 0.5). Data on the counts of aphid natural enemies were also transformed using Logio (Y + 1) (Wadley, 1967). Summaries of the transformed means were reconverted to the original scale. Any potential relationships between measured weather factors and features associated with aphid population parameters, or with plant performance characteristics, were analysed using correlation coefficients (Batschelet, 1981).
RESULTS Meteorological data
Meteorological records at the ICIPE-MPFS that were pertinent to this study are summarised in Table 1. The first rainy season experiment (March-June 1990) was characterised by long, steady rains, and winds originating from the north-west, the
direction of Lake Victoria. November 1990 to February 1991 was characterised by brief but severe rainstorms with strong north-westerly winds.
Daily records of the ambient meteorological data were: wind speeds of 10 to 45 km/h during rainy seasons (average of 20 km/h); 50-95% RH; temperatures of 18-22CC from March to June 1990, 20-22°C from July to October 1990, 26-30°C from November 1990 to February 1991, and a year-round average of 21°C. Wind direction during the dry-season experiment was also north-westerly with wind speeds of 5-15 km/h (average of ca. 8 km/h) (Table 1). Total precipitation between March 1990 and March 1991 was ca. 877 mm.
Aphid population data
Inspection of the data revealed no significant differences in the data trends of the 2 rainy season experiments (P > 0.05), therefore those data were combined for analysis. ANOVA of the combined rainy season data indicated significant (P < 0.05) interactions between locations of initial infestations (main-plots) and crop cultivar (sub-plots), and between each of those factors and the date of observation of aphid density. Thus, those data were analysed by observation date, comparing effects of cultivar and aphid treatments.
Overall trends. Aphid densities on ICV-1 plants
were significantly higher during the dry season experiments than the rainy season experiments, for corresponding treatments (Tables 2 and 3). The spread of aphid infestations was faster in ICV-1 plots than in ICV-12 plots (Figs 1-2).
Table 1. Summary of key meteorological data (ambient rainfall, wind direction and wind speed in cages) during field experiments for studying phenology and bionomics of Aphis craccivora on resistant and susceptible cowpea cultivars Planting no. 1 2 3 Experiment period March 1990-June 1990 July 1990-October 1990 November 1990-February 1991 Season/climate long rainy season dry season short rainy season
Rainfall (mm)1 382 14 215 Wind direction2 north-westerly north-westerly north-westerly Wind speed ambient 10-45 5-15 15-40 (km/h)3 cages 5-15 0-5 5-12 'Total ambient rainfall per experimental period; measured with an automatic rain guage (Wilhelm Lambrecht KG, Gottingen, Germany).
2
General direction of prevailing winds; determined using 'wind vane' in an automatic weather station (Campbell Scientific Ltd., Loughborough, UK).
3
Range of ambient and within-cage wind speeds; measured using an anemometer in an automatic weather station (Campbell Scientific Ltd., Loughborough, UK).
I. B. ANNAN et al. Due to the main differences in the measured
wind speeds during the rainy and the dry season experiments, correlations of the rate of spread of cowpea aphid infestations in test plots (number of infested plants) and average wind speeds were analysed. The rate of infestations spread on ICV-12 significantly correlated with wind speed (r = 0.27, P < 0.05, n = 1800 in the rainy season; and r = 0.93, P < 0.05, n = 900 in the dry season). The same
correlation for ICV-1 was significant in the rainy season (r = 0.84, P < 0.05, n = 1800), but not in the dry season (r = 0.20, P > 0.25, n = 900).
Rainy season experiments. In general, the pattern of
spread of aphid infestations consistently followed the wind direction within the test plots; thus, it was positively associated with wind direction. The patterns were similar for ICV-12 and ICV-1 at all
Table 2. Mean (+SEM) of aphid counts on artificially-infested and uninfested plants of aphid-resistant (ICV-12) and aphid-susceptible (ICV-1) cowpea cultivars at 1, 8,15 and 22 DAI, where aphid infestations were initially released at specified locations in test plots in field studies using rainy season crop plantings1
Treatment (point of initial Cowpea
release of aphids in cages)2 cultivar 1 DAI 8 DAI
N W U ICV-12 ICV-1 ICV-12 ICV-1 ICV-12 ICV-1 ICV-12 ICV-1 ICV-12 ICV-1 ICV-12 ICV-1 1 DAI
T+Tib"
25 ± 4 ab 1 0 ± 2 b 20 ± 3 ab 13 + 2 b 1 8 ± 2 a b 7 + l b 33 ± 4 a 11 ± 3 b 37 ± 6 a 0c 0c 15 DAI 4 2 ± l b 333 ± 28 a 3 5 ± 7 b 287 ± 4 a 38 ± 9 b 305 ± 31 a 55 + 11 b 362 + 41 a 61 ± 17 b 355 ± 26 a 0 c 0c 97 ± 14 c 1372 ± 8 3 a 105 + 18 c 1127 ± 54 b 122 ± 19 c 988 ± 74 b 116 + 12c 1424 ± 215 a 140 ± 29 c 1463 + 117 a Od Od 22 DAI _ "317±45~cf~ 2426 ± 127 a 227±68d 1865 ± 204 ab 258 ± 33 d 2126±181ab 303 + 24 d 2570 ± 107 a 249 ± 37 d 2474 + 332 a Oe Oe are followed by the same letter within a column are not significantly different (P > 0.05, LSD test: 1 DAI = 16.4; 8 DAI = 58.3; 15 DAI = 146.5; 22 DAI = 330.9).2
Source of infestation treatment or location of initial release of aphid infestations within test cages, (N = north; S = south; E = east; W = west; C = centre; U = uninfested controls).
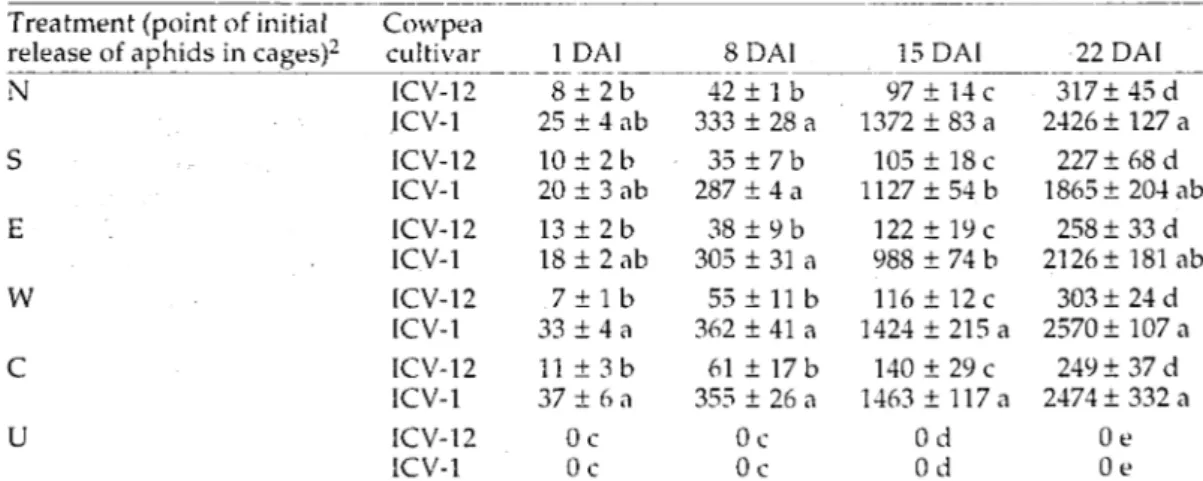
Table 3. Mean (+ SEM) of aphid counts on artificially-infested and uninfested plants of aphid-resistant (ICV-12) and aphid-susceptible (ICV-1) cowpea cultivars at 1, 8,15 and 22 DAI, where aphid infestations were initially released at specified locations in test plots in field studies using dry season crop plantings1
Treatment (point of initial release of aphids in cages)2
N W U Cowpea cultivar ICV-12 ICV-1 ICV-12 ICV-1 ICV-12 ICV-1 ICV-12 ICV-1 . ICV-12 ICV-1 ICV-12 ICV-1 1 5 23 7 14 6 10 9 15 7 17 DAI ± 1 ab ± 4 a ± 2 a b ± 1 a ± 0 a b ± 1 ab ± 2 a b ± l a + 0 a b ± 2 a 0c Oc g 40 416 37 402 54 347 42 446 38 454 iDAI ± 5 b + 34 a + 2 b ± 18 a ± 7 b ± 2 2 a ± 4 b ±51 a ± 3 b ± 37 a Oc Oc 15 DAI 86 ± 17 b 1827 ± 166 a 115 ± 19 b 1278 ± 105 a 93 ± 11 b 1726 ± 117 a 134 ± 8 b 2115 ± 172 a 105 ± 9 b 2007 ± 87 a Oc O c • 22 DAI 388 ± 3365 ± 342 ± 3037 ± 308 ± 3275 ± 337 ± 3484 ± 315 ± 3435 ± 52 b 206 a 29 b 315 a 33 b 214 a 24 b 258 a 43 b 266 a Ob Ob 1
Means that are followed by the same letter within a column are not significantly different (P > 0.05, LSD test: 1 DAI = 7.6; 8 DAI = 43.8; 15 DAI = 335.6; 22 DAI = 1217.7).
2
Source of infestation treatment or location of initial release of aphid infestations within test cages, (N = north; S = south; E = east; W = west; C = centre; U = uninfested controls). . • ••
1 DAI ICV-12 ICV-1 ICV-12 ICV-1 ICV-12 ICV-1 ICV-12 8 DAI * • X X X * • X X X • n • x x • • X X X • X X X X . D • x x • • • • X X • • • x • • • • X X . . . . • • • • X • • X X X X X X X X X • x x x x # X X X X • • • x • • X X X X • • • X X x D • x • 15 DAI • • • X X X • X X X • X X X X x a • x x X X X X X X X X X X X X X X X • . • X . • . X X X • ••XX • • X X X X X • X X X X • X . X • • • X X X • • X • X • - x • a • X X X • • X X X X a x x . x • X X X X X X X X X • X • X D x x x x • x x x x X X X X X • • X • X • a • x x X X X X X X X X X X X • X X X X • • X X X X X X X 22 DAI x a • a x • X X X X • X X X X X X X X X X X X X X x a • a x X X X X X > . X X X • • X X X . . X . . • a • o * X X X X X X X X X X X X • . X . X • • • x x a • X X X X X X X X X x x x x D a x x x x 9 x x x x X X X X X X X X X X • X X X X X X X • a • D x X X X X X X X X X X X X X X X x a • a x N i , ICV-1 N S E W C Location of initial release of aphid infestation (rainy season)
Fig. 1. Rainy-season pattern and rate of cowpea aphid infestations on field-grown plants of resistant (cv. ICV-12) and susceptible (cv. ICV-1) cowpeas. Infestations were released at specific cardinal locations within test cages in field experiments using rainy season crop plantings. • source plant of initial aphid infestation release; x infested plant [excluding source plant and harvested plants, but including plants killed by aphid infestations];. uninfested plant; • harvested plants [one at 1 day after infestation (DAI) and another at 22 DAI] for estimates of crop growth rate
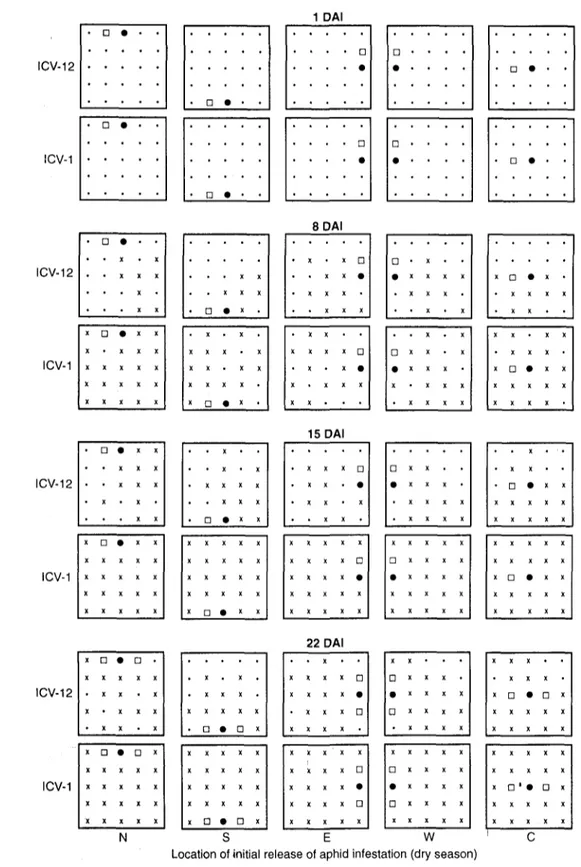
I. B. A N N A N e t a l . 1 DAI CV-12 ICV-1 • • • • • • • • • • • • • • • • • • • • . . . . • . . . . • . . . . • • • • • • • . . . . • . . . . 0 . . . . • • • • • • • • • • ICV-12 ICV-1 ICV-12 ICV-1 ICV-12 8 DAI 15 DAI * • • x x • • • X X x • # x x X X X X X X X X X X X X X X X X X X X X . • • x x X X X X X X X X X X X X X X X X X X X X x • • x x X X X X X X X X X X X • X X X X • X X X X X X X X X X • x x . . X X X X X X X X X • X X X X X X X X X X X X X X X X X X X X X X X X X X x • • x x X X X X X X X X X X 22 DAI x • • • . X X X X X X • X X X x • • • x X X X X X X X X X X X X X X X . X . X . X X X X X X X X X X X X X X X X X X X X X • • • X X X X X • X X X • X X X X X X X X X • X X X X • X X X X X • X X X ' • X X x X X X X X X • X X X X • X X X X • x x x x X X X X X X X X x • • • x X X X X X X X X X X X X X X X x • * • • x X X X X X X X X X X X • X X X X X X X X X X X • X X X • X X X X X X • • X • X • * • x x • x • X X X * X X X * x • • x x ICV-1 N S E W ' C Location of initial release of aphid infestation (dry season)
Fig. 2. Dry-season pattern and rate of cowpea aphid infestations on field-grown plants of resistant (cv. ICV-12) and susceptible (cv. ICV-1) cowpeas. Infestations were released at specific cardinal locations within test cages in field experiments using dry season crop plantings. • source plant of initial aphid infestation release; x infested plant [excluding source plant andliarvested plants, but including plants killed by aphid infestations];. uninfested plant; • harvested plants [one at 1 day after infestation (DAI) and another at 22 DAI] for estimates of crop growth rate
locations of aphid release at 8 and 15 DAI, but not at 22 DAI (Fig. 1). At 22 DAI, all ICV-1 plants in treatment plots were completely infested, but ICV-12 plots were not.
At each DAI, aphid density on infested plants of both cultivars was significantly greater than on uninfested control plants. Comparisons using LSD test indicated that at 1 and 8 DAI, aphid densities on both ICV-12 and ICV-1 plants in the various treatment combinations did not differ (Table 2). However, at 15 and 22 DAI, respectively, densities on ICV-1 plants for treatments released in the northern, western and central locations were significantly higher than those in the south and east; while densities on ICV-12 at those DAI for all locations did not differ significantly.
For each location of infestation release, there were significantly more numerous species of aphid natural enemies on ICV-1 than on ICV-12. There were more species of natural enemies on aphid-infested plants than unaphid-infested plants of both cultivars (Table 4). Subsequent analyses revealed significant correlations between the numbers of infested plants (spread of aphid infestations) and natural enemy species observed (r = 0.33, P < 0.05 for ICV-12; and r = 0.78; P < 0.05 for ICV-1).
There were also similar significant differences between the 2 test cultivars in the density of coccinellid predators at all locations of initial infestation release, with greater counts recorded on ICV-1 than on ICV-12 (Table 4). No significant
differences existed in the density of coccinellid predators on infested ICV-12 plants and the uninfested plants of both cultivars. However, there were no significant correlations between the mere spread of aphid infestations and counts of coccinellids (r = 0.16, P > 0.10 for ICV-12; and r = 0.13, P > 0.10 for ICV-1). On the other hand, there were significant correlations between aphid density per plant and coccinellid counts (r = 0.46, P < 0.05 for ICV-12; and r = 0.88, P< 0.05 for ICV-1).
Dry season experiments. The spread of aphid
infestations was also faster in ICV-1 plots than in ICV-12 plots (Fig. 2). The pattern of spread of infestations from the point of initial release was positively associated with wind direction in ICV-12 plots, but not in ICV-1 plots. At 8 DAI, this pattern on ICV-1 plants appeared to be in all directions and not necessarily in the direction of wind currents, as was generally the case in the rainy season experiments (Fig. 1). By 15 DAI, plants in all ICV-1 plots were heavily infested and infestations were sustained up to 22 DAI. On the other hand, complete infestations and thus successful colonisation of ICV-12 plots were not recorded at any of the locations of initial treatment release.
Except for the initial infestation releases at the eastern locations in plots and untreated controls, there were significant differences in aphid density on ICV-12 and ICV-1 at 1 DAI (Table 3). By the 8th
Table 4. Incidence of sooty mould, number of natural enemy species, abundance of coccinellids and proportion of plant mortality during cowpea aphid infestations on resistant (ICV-12) and susceptible (ICV-1) cowpeas; where aphid infestations were initially released at specified locations in field plots using rainy season crop plantings1
Treatment (point of initial release of aphids in cages)2 North South East West Centre Uninfested control Cowpea cultivar ICV-12 ICV-1 • ICV-12 ICV-1 ICV-12 ICV-1 ICV-12 ICV-1 ICV-12 ICV-1 ICV-12 ICV-1 Sooty mould3 0.22 ± 0.02 b 3.42 ± 0.42 a 0.26 ± 0.03 b 3.77 ± 0.38 a 0.30 ± 0.06 b 3.37 ± 0.49 a 0.23 ± 0.04 b 4.25 ± 0.88 a 0.34 ± 0.07 b 3.52 ± 0.83 a 0.17 ± 0.03 b 0.23 + 0.04 b Natural enemy spp.4 0.33 ± 0.19 ab 2.41 ±0.09 a 0.42 ± 0.23 ab 2.25 ± 0.08 a 0.38 ± 0.21 ab 2.36 ± 0.03 a 0.61 ±0.16ab 2.47 ±0.17 a 0.34 + 0.08 ab 2.39 ± 0.12 a 0.14 ± 0.02 b 0.18 + 0.04 b Counts of coccinellids 2.0 ± 0.6 b 24.0 ±3.6 a 4.0+0.9 b 20.0 ±2.3 a 3.0±0.8ab 31.0 ±5.5 a 2.0 ± 0.3 b 28.0 ±8.3 a 3.0+ 0.7 b 24.0 ± 4.2 a 2.0 ±0.1 b 1.0±0.1 b Prop, of plant mortality3 0.0 b 0.11 a 0.0 b 0.05 ab 0.0 b 0.07 ab 0.0 b 0.10 a 0.01b 0.12 a 0.0 b 0.0 b 'Means that are followed by the same letter within a column are not significantly different (P > 0.05, LSD test: sooty mould = 2.94; natural enemies = 0.62; coccinellids = 24.5; plant mortality = 0.04).
2
Source of infestation treatment or location of initial release of aphid infestations within test cages.
3
V(Y = 0.5) transformed data (unconverted error mean square added to squared means).
4
10 I. B. ANNAN et al.
Table 5. Incidence of sooty mould, number of natural enemy species, abundance of coccinellids and proportion of plant mortality during cowpea aphid infestations on resistant (ICV-12) and susceptible (ICV-1) cowpeas; where aphid infestations were initially released at specified locations in field plots using dry season crop plantings1
Treatment (point of initial release of aphids in cages)2 North South East West Centre Uninfested control Cowpea cultivar ICV-12 ICV-1 ICV-12 ICV-1 ICV-12 ICV-1 ICV-12 ICV-1 ICV-12 ICV-1 ICV-12 ICV-1 Sooty mould3 0.73 ± 0.17 c 2.36 ±0.18 a 0.51 ± 0.09 c 1.98 ±0.24 a 0.90 + 0.23 b 2.15 ±0.16 a 1.15+ 0.32 b 2.54 + 0.24 a 1.34 ± 0.27 b 2.06 + 0.20 a 0.24 ± 0.02 c 0.21 + 0.02 c Natural enemy spp.4 0.52 ± 0.19 b 3.31 +0.30 a 0.67 + 0.23 b 3.72 ± 0.51 a 0.72 + 0.21 b 2.87 ± 0.47 a 0.85 ± 0.16 b 3.08 ± 0.34 a 1.05 + 0.48 b 3.19 ±0.52 a 0.53 ± 0.04 b 0.48 ± 0.05 b Counts of coccinellids 8.0 ± 0.3 c 52.0 ±8.2 a 10.0 + 0.7 c 40.0 ± 4.2 ab 6.0 ± 1.3 c 45.0 +8.0 a 4.0+0.1c 67.0 ± 7.8 a 12.0 ± 1.3 c 62.0 +5.5 a 2.0 ± 0.6 c 1.0 ± 0.0 c Prop, of plant mortality3 0.02 c 0.22 a 0.01c 0.12 ab 0.0 b 0.15 ab 0.02 c 0.19 a 0.02 c 0.14 ab 0.01c 0.0 c 1
Means that are followed by the same letter within a column are not significantly different (P > 0.05, LSD test: sooty mould = 1.25; natural enemies = 2.34; coccinellids = 33.8; plant mortality = 0.07).
2
Source of infestation treatment or location of initial release of aphid infestations within test cages.
3
\(Y + 0.5) transformed data (unconverted error mean square added to squared means).
4
Log!o(Y + 1) transformed data.
Table 6. Mean extended leaf heights (ELH, cm) (+ SEM) of artificially-infested and uninfested plants of aphid-resistant (ICV-12) and aphid-susceptible (ICV-1) cowpea cultivars at 1, 8,15 and 22 DAI, where aphid infestations were released at specified locations in test cages in field studies using rainy season crop plantings1
Treatment (point of initial release of aphids in cages)2 North South East West Centre Uninfested control Cowpea cultivar ICV-12 ICV-1 ICV-12 ICV-1 ICV-12 ICV-1 ICV-12 ICV-1 ICV-12 ICV-1 ICV-12 ICV-1 1 DAI 24 ± 2.7 a 28 + 3.3 a 27 ± 1.5 a 25 ± 0.9 a 30 ± 3.9 a 28 ± 2.8 a 25 ± 2.5 a 30 ± 3.2 a 30 ± 2.8 a 27 ± 2.6 a 29 ± 2.4 a 31 + 3.2 a 8 DAI 34 + 1.6 29 ± 2.8 33 + 1.5 30 ± 1.7 35 ± 1.3 30 ± 0.8 35 ± 0.4 31 ± 1.4 34 + 1.2 27 ± 2.2 35 ± 2.3 36 ± 1.5 a a a a a a a a a a a a 15 DAI 42 ± 0.5 31 + 2.8 44 ± 2.9 33 ± 3.5 42 ± 2.2 35 + 4.3 45 ± 1.8 31 ± 4.0 40 ± 0.6 29 ± 2.1 42 ± 2.2 44 ± 3.5 a b a b a a a b a b a a 22 DAI 50±2.1a 34 ± 3.2 b 48 ± 0.7 a 38 ± 6.6 b 51 ± 1.4 a 40 + 8.3 a 55 ±2.9 a 33 ± 5.8 b 47+0.4 a 32 ± 3.1b 50±1.2a 51 + 0.8 a *Means that are followed by the same letter within a column are not significantly different (P > 0.05, LSD test: 1 DAI = 6.7; 8 DAI = 9.5; 15 DAI = 16.4; 22 DAI = 26.2).
2
Source of infestation treatment or location of initial release of aphid infestations within test cages. DAI, these differences increased sharply, and were
also apparent at all locations. The incidence of n a t u r a l enemy species and abundance of coccinellids at all locations of initial infestation release were generally higher on infested plants of ICV-1 than on ICV-12 (Table 5). Overall, there were significant correlations between spread of infestations and incidence of natural enemies (r = 0.64, P < 0.05 for ICV-12; and r = 0.81, P < 0.25 for ICV-1); but not between the spread of infestations
and coccinellid density [r = 0.18, P > 0.10 for ICV-12; and r = 0.22, P > 0.10 for ICV-1). There were also significant correlations between densities of aphids and coccinellids (r = 0.91, P < 0.05 for ICV-12; r = 0.84, P < 0.05 for ICV-1).
Plant growth and yield data
Preliminary analysis of the data indicated significant (P < 0.05) 3-way interactions between
cowpea cultivar (sub-plots) and aphid treatments (main-plots), and with date of observation of aphid counts, for each planting season. Therefore, those data were further analysed for each DAI observation, comparing the effects of cowpea cultivar and the location of initial release of aphid infestations. However, for ELH, ANOVA indicated significant interactions between cultivar and infestation release locations only at 15 and 22 DAI (P < 0.05), but not at 1 and 8 DAI (P > 0.25).
Rainy season experiments. LSD comparisons of
combinations of cultivar and aphid infestation treatments indicated that infested plants of ICV-1 were significantly stunted, compared with corresponding ICV-12 plants, at 15 and 22 DAI (Table 6).
For all treatments, ICV-12 plants had lower incidence of sooty mould and also lower mortality than ICV-1 plants, for corresponding treatments (Table 4). There were significant correlations between spread of infestations and incidence of plant mortality (/' = 0.36, P < 0.05 f'or ICV-12; and
r = 0.86, P < 0.05 for ICV-1). On the other hand,
there were no significant correlations between spread of aphid infestations and the incidence of sooty mould infection on plants (r = 0.19,0.05 < P < 0.08 for ICV-12; and r = 0.26, 0.05 < P < 0.06 for ICV-1).
Growth and grain yield parameters of infested ICV-12 plants were not significantly different from uninfested controls of both cultivars. But those characteristics in ICV-1 were adversely affected (Fig. 3). Aphid damage on ICV-1 plants was severe when initial infestations were released in the north, west and centre of plots. Also, apart from the adverse effects of aphid infestation release in the eastern location of plots on pod production in ICV-1 plants, the effects of treatments released in southern and eastern locations on ICV-1 growth and yield parameters were generally similar to those of ICV-12 plants or uninfested ICV-1 plants. Thus, ICV-1 plants subjected to the latter treatments (where infestations were released in the eastern and southern locations in test plots) were less adversely affected than those where infestations were released at the north, west and centre of the test plots.
Dry season experiments. LSD analysis revealed
significant differences in ELH between ICV-12 and ICV-1 at all locations of initial release of infestations at 8,15 and 22 DAI, but not at 1 DAI (Table 7).
Incidences of sooty mould and mortality in infested plants were significantly lower on ICV-12 than on ICV-1 (Table 5). But within ICV-1, there was a lower incidence of the moulds in the dry season, compared with the rainy season (Tables 4 and 5).
There were poor correlations between the spread of aphid infestations and occurrence of sooty moulds (r = 0.08, P > 0.25 for ICV-12; and r = 0.14, P > 0.10 for ICV-1). However, there were significant correlations between spread of infestations and incidence of ICV-1 plant mortality
(r = 0.96, P < 0.05). Due to the rarity of dead plants
in ICV-12, there were poor correlations between spread of infestations and ICV-12 plant mortality
(r = 0.42, P < 0.05).
Similar to the trends observed in the rainy season experiments, biomass accumulation— represented by crop growth rate and plant yield parameters—was not significantly different for infested plants of ICV-12, compared with the infested plants of both cultivars. On the other
N S E W C U Location of release of aphids in test
cages in rainy season experiments Fig, 3. Mean growth and yield parameters (± SEM) of artificially-infested and uninfested plants of aphid-resistant (cv. ICV-12) and aphid-susceptible (cv. ICV-1) cowpeas; where infestations were released at specified cardinal locations within test cages in field studies using rainy season crop plantings: (a) crop growth rate [g/dm2 land surface/day]; (b) pods per plant; and (c) seeds per pod; (means within each parameter followed by the same letter are not significantly different, LSD test)
12 I. B. ANNAN et al.
Table 7. Extended leaf heights (ELH, cm) of artificially-infested and uninfested plants of aphid-resistant (ICV-12) and aphid-susceptible (ICV-1) cowpea cultivars at 1, 8,15 and 22 DAI, where aphid infestations were released at specified cardinal locations in test cages in field studies using dry season crop plantings1
Treatment (point of initial release of aphids in cages)2 North South East West Centre Uninfested control Cowpea cultivar ICV-12 ICV-1 ICV-12 ICV-1 ICV-12 ICV-1 ICV-12 ICV-1 ICV-12 ICV-1 ICV-12 ICV-1 1DAI 22 ±1.5 a 24 ± 2.1 a 26 ± 2.9 a 24 ± 1.7 a 23 ± 2.1 a 25 ± 3.4 a 20 ± 1.7 a 22 ± 2.8 a 24 ± 2.9 a 20 ± 1.8 a 25 ± 3.2 a 24 ± 2.3 a 8 DAI 31 ± 1.2 a 24 ± 3.1 b 35 ±1.0 a 26 ± 0.6 b 31 ± 2.3 a 25 ± 1.2 b 34 ± 4.2 a 23 + 0.9 b 32 ± 2.2 a 20 + 1.1 b 34 ± 1.3 a 34 ± 1.7 a 15 DAI 37 ± 1.6 24 ± 1.7 41 ± 1.3 27 ± 2.6 40 ± 3.4 27 + 0.8 39 ± 2.7 26 ± 1.2 39 ± 3.2 22 ± 1.0 40 ±1.8 42 ± 2.6 a b a b a b a b a b a a 22 DAI 47±4.2a 25+ 1.7 b 51 + 7.2 a 27+ 2.8 b 49 ± 3.6 a 29 ± 1.4 b 52 ±6.9 a 27 ± 2.3 b 44 ± 2.5 a 22± 1.4 b 48 ±2.0 a 49 ± 1.7 a 'Means that are followed by the same letter within a column are not significantly different (P > 0.05, LSD test: 1 DAI = 4.8; 8 DAI = 8.2; 15 DAI = 14.3; 22 DAI = 23.5).
2
Source of infestation treatment or location of initial release of aphid infestations within test cages.
hand, contrary to the trends observed in the rainy season experiments, aphid infestation releases in the southern and eastern locations of plots adversely affected ICV-1 growth and yield during the dry season experiment. The exception was in the effects of infestation release in the south of plots on crop growth rate of ICV-1. This trend was similar to the same parameters in ICV-12 and uninfested ICV-1 plants (Fig. 4). Also, growth and yield of ICV-1 at all locations of infestation releases were reduced compared to the corresponding uninfested control treatments.
Overall, comparisons with the trends in the rainy season experiments revealed that the deleterious effects of treatment combinations on ICV-1 growth and yield characteristics appeared to be more severe in the dry season experiment.
DISCUSSION
Compared with plots that received uninfested control treatments, initial infestations by apterous
Aphis craccivora on plots of the aphid-susceptible
cowpea cultivar (ICV-1) produced significant adverse effects on crop growth and yield. However, in plots of the aphid-resistant cowpea cultivar (ICV-12), aphid infestations did not significantly affect crop performance. This observation concurs with findings in related work on the same cultivars reported by Annan et al. (1994, 1995, 1996). Furthermore, there were no significant differences
| 0.20 1 0.15 S 0.10 g 0.05 0.00 20 c JO Q_ CD Q. 15 10 5 0 0.25 0.20 0.15 0.10 0.05 0.00 W
Location of release of aphids in test cages in dry season experiments
Fig. 4. Mean growth and yield parameters (±SEM) of artificially-infested and uninfested plants of aphid-resistant (cv. ICV-12) and aphid-susceptible (cv. ICV-1) cowpeas; where infestations were released at specified cardinal locations within test cages in field studies using dry season crop plantings: (a) crop growth rate [g/dm2 land surface/day]; (b) pods per plant; and (c) seeds per pod; (means within each parameter followed by the same letter are not significantly different, LSD test)
in aphid population and cowpea crop performance parameters among the various locations of initial infestation releases in ICV-12 plots.
In general, infestations that were initiated in the northern, western and central locations of test plots spread faster than those at the southern and eastern locations. Since wind direction at MPFS was generally north-westerly, it was apparent that the pattern and rate of spread of localised aphid infestations or within-field dispersal, was aided by wind currents. It is also well known that winds aid the long distance movement of alates (Johnson, 1954; Tatchell et al., 1988; Tatchell and Woiwod, 1989).
This work also indicates that the dispersal of apterae within the same field plot of cowpea is also aided by wind factors, perhaps through the dislodging of individual aphids from a plant to adjacent plants. The spread of infestations resulted in a concomitant increase in factors that are associated with aphid infestations, such as the incidence and abundance of natural enemy species. The resulting damage to crop growth and yield were significantly greater for the initial infestation releases that were done at the northern, western and central locations.
Wind currents directly dislodge aphids from leaf surfaces or cause turbulence in plant canopy, resulting in leaves brushing against each other (Dixon, 1978), and then ultimately dislodging individual aphids from one plant onto another. The rate of spread of aphid infestations on plants of ICV-12 correlated with wind speed during the rainy season. But on ICV-1, the spread of infestations was faster during the dry season than the rainy season, indicating poor or no correlation between wind speed and rate of spread of infestations. Thus, wind speed apparently did not significantly influence the rate of infestation spread on that cultivar during the dry season.
The rapid aphid spread among ICV-1 plants during the dry season may be further explained by the fact that the slower wind speeds during that planting season were not sufficient to impede inter-plant movements by aphids, even against the direction of wind currents. However, in addition to the observation on the minimised importance of wind speed (especially in ICV-1 plots during the dry season), effects of cowpea cultivar in the spread may be equally important. Thus, whereas the aphids on the susceptible cultivar (ICV-1) successfully colonised affected plants, even against wind direction; aphids that landed on plants of the resistant cultivar (ICV-12)
were not as successful due to the strong antixenosis and antibiosis resistance against A. craccivora in that cultivar as reported by (Givovich et al., 1988; Firempong, 1988).
Thus, wind direction was important in determining the pattern of spread of aphid infestation and the consequent effects on growth and yield of ICV-1, as well as on Aphis craccivora population dynamics and associated factors on that cultivar. However, although such trends have been commonly observed with alate aphids (Rainey, 1973; Pedgley, 1982), this work represents evidence of the same trends in apterae.
The occurrence of sooty moulds even on uninfested plants suggested that moulds did not correlate with aphid infestations, and thus were not necessarily associated with nor significantly affected by aphid honeydew. Thus, other factors, such as moisture on leaves which can entrap spores, can create a humid micro-environment which is ideal for mould development. Thus, although it was assumed earlier in this work that mould infections would be facilitated or even aggravated by honeydew secretion by infesting populations of A. craccivora, it was apparent in this work that the aphid secretion did not influence mould development. This observation is consistent with earlier findings by Annan et al. (1994), who also reported that at high aphid densities, incidence of moulds on plants of the susceptible cultivar were significantly high.
In both the rainy and dry season experiments, the rate of spread of aphid infestations was faster in ICV-1 plots than in ICV-12 plots (Figs 1 and 2). This suggests an alternative or perhaps a complementary explanation—that cultivar selection is also an important factor in the rate of spread of aphid infestations. The rate of spread of infestations on ICV-1 was faster and aphid densities per plant tended to be greater in the dry season than during the rainy season. A plausible explanation may be that in the relatively calmer winds recorded during the dry season, aphids were not easily dislodged from plants, so infesting colonies on plants could settle and grow rapidly, causing crowding conditions on plants.
Gutierrez et al. (1974b) indicated that temperature directly affects phenology of cowpea aphid populations, and that at certain temperatures and humidity levels, deleterious effects of fungal pathogens on aphid populations may be aggravated. Dixon (1978) also reported that aphid fecundity and rate of development were reduced at low temperatures.
14 I. B.ANNAN etal.
Thus, although the analysis in this and in other work evaluated effects and correlations of weather parameters on aphid population dynamics and crop performance as independent factors, it is more practical to consider the interactions of those factors or their combined effects. For instance, it was observed in this work that during the rainy seasons at MPFS, there were severe storms with strong winds before or during rains. However, rainfall also resulted in increased evaporation and high relative humidity. During the rainy season, the spread of infestations was faster but aphid population growth or density per plant was not as high as was observed in the dry season. This may be because although the faster winds knocked off aphids quickly from plants and spread them quickly among adjacent plants, the heavy raindrops or showers may have actually dislodged individual aphids from exposed leaves and other plant parts and washed them away, similar to the description by Dixon (1978).
During the dry season experiments, aphid populations spread quickly and the density on plants was high. Although overhead irrigation was provided with the primary aim of maintaining adequate soil moisture, windstorms that were associated with ambient rain and could dislodge aphids to cause mortality were absent. Thus, winds were calmer and hence, aphids could move among plants without being dislodged and impeded by wind currents. Such conditions were ideal for increased aphid reproduction and the resulting rapid population growth. Also, ambient temperatures and soil moisture evaporation were higher, thus contributing to low humidity and relatively drier ambient conditions that favoured aphid population explosions and thus increased dispersal.
There was a positive correlation between the rate of spread of infestations and number of natural enemy species. The spread of aphid infestations could be either due to the effects of cultivar (susceptibility), or presumably to the role of wind direction and wind speed in spreading infesting aphids among plants within a field. However, no direct correlation between wind speed and density of coccinellid predators was found. This indicated the classical response where population dynamics of key predator species was linked to, but lagged behind, the prey population dynamics (Andrewartha and Birch, 1954). The data also revealed a direct positive correlation between aphid density and abundance of coccinellids.
There was also a poor correlation between aphid density and the spread of infestations. This seemed to imply that the high densities observed presumably did not ultimately culminate in overcrowding conditions which would have resulted in obligatory inter-plant movement (by apterae) or even migrations from cages (by alatae), and thus would result in the spread of infestations on plants.
For infested plants there was good aphid colonisation and rapid population growth. This can be attributed to cultivar effects, since the preponderance (incidence and intensity) of infestations were observed on ICV-1 plants. These observations apparently conform to the concept of 'few but common' distribution, vis-a-vis the 'abundant but rare' distribution of a species.
Also, there was a lack of correlation between the pattern and rate of spread of aphid infestations and amount of rainfall or moisture precipitation
per se (data not shown). Gutierrez et al. (1974b)
reported an indirect relationship between soil moisture levels and aphid population dynamics. This was because moisture primarily affected host crop physiology and was ultimately manifested in aspects of the aphid biology. Thus, it was possible that since the cowpeas were adequately irrigated during the dry season experiment, any potential differences in the direct effect of amount of soil moisture on host crop performance, and thus the indirect effects on the aphid populations were nullified.
CONCLUSION
The results of this work suggest that the direction of wind currents is an important determinant of the pattern of spread of infestations by apterous morphs of Aphis craccivora within cowpea fields. Further, crop cultivar selection and wind speed, particularly during the rainy season, significantly influenced the rate of spread of infestations. Therefore, the deployment of aphid-resistant cultivars is useful, and is thus recommended as an integral management tool for suppressing the widespread occurrence of cowpea aphid infestations. It is also important for limiting growth of the aphid populations, and for ultimately reducing aphid damage to the growth and yield of field-grown cowpeas.
Acknowledgements—We thank the First
Presbyterian Church in Ithaca, Rockefeller Foundation and Cornell University, for financial
support; Cleophas Oduor, Silas Paul Ojwang, Charles Otuga Ouma, Charles Ondiek, Nicholas Odhiambo, Philip Othieno and John Odera for field assistance; Peter Nyongessa, John Olela and R.S. Pathak for supplying cowpea seeds; Martin Okwanyo and J.A. Mtei for building field cages; Tim Martinson, Zhang Zhi-Qiang, Felix H. Franc, a, Paul Taylor, Lane Smith, Edward Dwumfour, Kwesi Ampong Nyarko and K.V. Seshu-Reddy for other research support; John Andaloro, Dave Me Aulif f e and Chuck Lee for review and assistance with other aspects of the initial draft of the manuscript.
REFERENCES
Andrewartha H. G. and Birch L. C. (1954) The Distribution
and Abundance of Animals. University of Chicago
Press, Chicago. 782 pp.
Annan I. B. (1992) Mechanisms of aphid resistance in cowpea and population dynamics of cowpea aphid
Apliis craccivora Koch. PhD Dissertation, Cornell
University, Ithaca, NY. 195 pp.
Annan I. B., Ampong-Nyarko K., Tingey W. M. and Schaefers G. A. (1997) Interactions of fertiliser application, cultivar selection and infestation by cowpea aphid (Aphididae) on growth and yield of cowpeas. Int. J. Pest Manage. 43, 307-312. Annan I. B., Saxena K. N., Tingey W. M. and Schaefers
G. A. (1994) Effects of infestation by cowpea aphid (Homop tera: Aphididae) on different growth stages of resistant and susceptible cowpea cultivars. Insect
Sci. Applic. 15, 401-410.
Annan I. B., Schaefers G. A. and Tingey W. M. (1995) Influence of dura tion of infestation by cowpea aphid (Homoptera: Aphididae) on growth and yield of resistant and susceptible cowpeas. Crop Protection 14, 533-538.
Annan I. B., Schaefers G. A. and Tingey W. M. (1996) Impact of density of Aphis craccivora (Aphididae) on growth and yield of resistant and susceptible cowpea cultivars. Ann. Appl. Biol. 128,186-193.
Bata H. D., Singh B. B., Singh S. R. and Ladeinde T. A. O. (1987) Inheritance of resistance to aphid in cowpea. Crop Science 27, 892-894.
Batschelet E. (1981) Circular Statistics in Biology. Academic Press, New York. 371 pp.
Bommarco R. and Ekbom B. (1995) Phenology and prediction of pea aphid infestations on peas. Int. /.
Pest Manage. 41,109-113.
Deguine J.P., Goze E. and Leclant F. (1994) Incidence of early outbreaks of the aphid Aphis gossypii Glover in cotton growing in Cameroon. Int. j . Pest Manage. 40, 132-140.
Dixon A. F. G. (1973) Aphids. Ginn and Co., London. 175 pp.
Dixon A. F. G. (1978) Biology of Aphids. Edward Arnold, London. 58 pp.
Dixon A. F. G. (1985) Aphid Ecology. Blackie, London. 157 pp.
Dixon A. F. G. (1990) Ecological interactions of aphids and their hosts, pp. 7-19. In Aphid-Plant Genotype
Interactions. (Edited by R. K. Campbell and R. D.
Eikenbarry). Elsevier, Amsterdam.
Ferrar P. (1969) Interplant movement of apterous aphids with special reference to Myzns persicae (Sulz.) (Hem., Aphididae). Bull. Entomol. Res. 58, 653-660. Firempong S. (1988) Components of resistance to Aphis
craccivora in some cowpea varieties. Ent. Exp. Appl.
48,241-246.
Gardner F. P., Pearce R. B. and Mitchell R. L. (1985)
Physiology of Crop Plants. Iowa State University Press,
Ames. 327 pp.
Givovich A., Weibull J. and Pettersson J. (1988) Cowpea aphid performance and behavior on two resistant cowpea lines. Entomol. Exp. Appl. 49, 259-264. Gutierrez A. P. (1987) Analyzing the effects of climate
and weather on pests, pp. 203-224. In
Agrometeorology (Edited by F. Prodi, F. Rossi and G.
Cristoferi). 2nd International Cesena Agricultural Conference, October 8-9,1987, Cesena, Italy. Gutierrez A. P., Havenstein D. E., Nix H. A. and Moore
P. A. (1974a) The ecology of Aphis craccivora Koch and subterranean clover virus in south-east Australia—a model of cowpea aphid populations in temperate grasses. /. Appl. Ecol. 11,1-20. Gutierrez A. P., Havenstein D. E., Nix H. A. and Moore
P. A. (1974b) The ecology of Aphis craccivora Koch and subterranean clover virus in south-east Australia. A regional perspective on the phenology and migration of cowpea aphid. /. Appl. Ecol. 11,21-35.
Johnson C. G. (1954) Aphid migration in relation to weather. Biological Reviews 29, 87-118.
Johnson B. (1957) Studies on the dispersal by upper winds of Aphis craccivora Koch in New South Wales.
Proceedings of the Linnean Society of New South Wales
82,191-198.
Kennedy J. S. (1950) Aphid migration and the spread of plant viruses. Nature (London) 165,1024.
Kennedy J. S., Booth C. O. and Kershaw W. J. S. (1959) Host finding by aphids in the field. II. Aphis fabae Scop. (Gynoparae) and Brevicorynae brassicae L., with a re-appraisal of the role of host-finding behaviour in virus spread. Ann. Appl. Biol. 47,424-444.
Kennedy J. S., Booth C. O. and Kershaw W. J. S. (1961) Host finding by aphids in the field. III. Visual attraction. Ann. Appl. Biol. 49,1-21.
Messina F. J., RenwickJ. A. A. and BarmoreJ. L. (1985) Resistance to Aphis craccivora (Homoptera: Aphididae) in selected varieties of cowpea. /.
Entomol. Sci. 20, 263-269.
Ofuya T. I. (1989) The effect of pod growth stages in cowpea on aphid reproduction and damage by the cowpea aphid, Aphis craccivora (Homoptera: Aphididae). Ann. Appl. Biol. 115, 563-566. Ofuya T.I. (1993) Evaluation of selected cowpea varieties
16 I. B. ANNAN et al. for resistance to Aphis craccivom Koch (Homoptera:
Aphididae) at the seedling and podding phase.
Ann. Appl. Biol. 123,19-23.
Ombakho G. A., Tyagi A. P. and Pathak R. S. (1987) Inheritance of resistance to the cowpea aphid in cowpea. Theor. Appl. Gen. 74, 817-819.
Pathak R. S. (1988) Genetics of resistance to aphid in cowpea. Crop Science 28, 474-476.
Pathak R. S. and Olela J. C. (1986) Registration of 14 cowpea cultivars. Crop Science 26, 647-648. Pedgley D. E. (1982) Windborne Pests and
Diseases-Meteorology of Airborne Organisms. Ellis Horwood
Ltd., Chichester. 250 pp.
Rainey R. C. (1973) Airborne pests and the atmospheric environment. Weather 28, 224-239.
Robert Y. (1988) Dispersion and migration, pp. 299-313. In Aphids—Their Biology, Natural Enemies and
Control. World Crop Pests, Volume 2A (Edited by A.
K. Minks and P. Harrewijn). Elsevier, Amsterdam. SAS Institute (1990) SAS/STAT™ User's guide, Edition
6.0. SAS Institute Inc., Cary, N.C.
Saville D. J. (1990) Multiple comparison procedures— the practical solution. The American Statistician 44, 174-180.
SinghS. R. and Rachie K. O. (Eds) (1985) Cowpea Research,
Production and Utilization. John Wiley and Sons,
New York. 460 pp.
Singh S. R. and van Emden H. F. (1979) Insect pests of grain legumes. Annu. Rev. Entomol. 24, 255-278.
Sokal R. R. and Rohlf F. J. (1969) Biometry—The Principles
and Practice of Statistics in Biological Research. W.H.
Freeman and Co., San Francisco. 776 pp.
Southwood T. R. E. (1978) Ecological Methods With
Particular Reference to the Study of Insect Populations.
2nd edition. Chapman and Hall, London. 524 pp. Tatchell G. M. (1991) Monitoring and forecasting aphid
problems, pp. 215-230. In Aphid-Plant Interactions—
Populations to Molecules (Edited by D. C. Peters, J. A.
Webster and C. S. Chlouber). Miscellaneous
Publication 132, and Proceedings of the Oklahoma State University Centennial Event. August 12-17, 1990.
Oklahoma State University, Stillwater.
Tatchell G. M. and Woiwod I. P. (1989) Aphid migration and forecasting, pp. 15-28. in'Euraphid'
Network-Trapping and Aphid Prognosis (Edited by R.
Cavalloro). Commission of the European Communities, Brussels.
Tatchell G. M., Plumb R. T. and Carter N. (1988) Migration of alate morphs of the bird cherry aphid
(Rhopalosiphum padi) and implications for the
epidemiology of barley yellow dwarf virus. Ann.
Appl. Biol. 112,1-11.
Taylor L. R. (1977) Aphid forecasting and the Rothamsted insect survey. J. Royal Agric. Soc. England 138, 75-97.
Turl L. A. D. (1980) An approach to forecasting the incidence of potato and cereal aphids in Scotland.
European Plant Prot. Org. Bull. 10,135-141.
Wadley F. M. (1967) Experimental Statistics in Entomology. Graduate School Press, US Department of Agriculture Press, Washington DC. 133 pp.