HAL Id: hal-00297832
https://hal.archives-ouvertes.fr/hal-00297832
Submitted on 17 Jul 2006HAL is a multi-disciplinary open access
archive for the deposit and dissemination of sci-entific research documents, whether they are pub-lished or not. The documents may come from teaching and research institutions in France or abroad, or from public or private research centers.
L’archive ouverte pluridisciplinaire HAL, est destinée au dépôt et à la diffusion de documents scientifiques de niveau recherche, publiés ou non, émanant des établissements d’enseignement et de recherche français ou étrangers, des laboratoires publics ou privés.
Nitrous oxide in the North Atlantic Ocean
S. Walter, H. W. Bange, U. Breitenbach, D. W. R. Wallace
To cite this version:
S. Walter, H. W. Bange, U. Breitenbach, D. W. R. Wallace. Nitrous oxide in the North Atlantic Ocean. Biogeosciences Discussions, European Geosciences Union, 2006, 3 (4), pp.993-1022. �hal-00297832�
BGD
3, 993–1022, 2006Nitrous oxide in the North Atlantic Ocean
S. Walter et al. Title Page Abstract Introduction Conclusions References Tables Figures J I J I Back Close
Full Screen / Esc
Printer-friendly Version Interactive Discussion
EGU Biogeosciences Discuss., 3, 993–1022, 2006
www.biogeosciences-discuss.net/3/993/2006/ © Author(s) 2006. This work is licensed under a Creative Commons License.
Biogeosciences Discussions
Biogeosciences Discussions is the access reviewed discussion forum of Biogeosciences
Nitrous oxide in the North Atlantic Ocean
S. Walter, H. W. Bange, U. Breitenbach, and D. W. R. Wallace
Forschungsbereich Marine Biogeochemie, IFM-GEOMAR, Leibniz-Institut f ¨ur Meereswissenschaften, D ¨usternbrooker Weg 20, 24105 Kiel, Germany Received: 2 May 2006 – Accepted: 8 May 2006 – Published: 17 July 2006 Correspondence to: S. Walter ([email protected])
BGD
3, 993–1022, 2006Nitrous oxide in the North Atlantic Ocean
S. Walter et al. Title Page Abstract Introduction Conclusions References Tables Figures J I J I Back Close
Full Screen / Esc
Printer-friendly Version Interactive Discussion
EGU
Abstract
In order to investigate the role of the North Atlantic Ocean as a source of atmospheric nitrous oxide and to decipher the major formation pathways of nitrous oxide, mea-surements of dissolved nitrous oxide were made during three cruises in the tropical, subtropical and subpolar North Atlantic in October/November 2002, March/April 2004,
5
and May 2002, respectively. Nitrous oxide was close to equilibrium or slightly supersat-urated in the surface layers suggesting that the North Atlantic acts as a weak source of nitrous oxide to the atmosphere. Depth profiles showed supersaturation through-out the water column with a distinct increasing trend from the subpolar to the tropical region. Lowest nitrous oxide concentrations, near equilibrium and with an average of
10
11.0±1.7 nmol L−1, were found in the subpolar North Atlantic where the profiles showed no clear maxima. Highest values up to 37.3 nmol L−1occurred in the tropical North At-lantic with clear maxima at approximately 400 m. A positive correlation of nitrous oxide with nitrate, as well as excess nitrous oxide with AOU, was only observed in the sub-tropical and sub-tropical regions. Therefore, we conclude that the formation of nitrous oxide
15
occurs in the tropical region rather than in the subpolar region of the North Atlantic and suggest nitrification is the dominant formation pathway in the subtropical and tropical regions.
1 Introduction
Nitrous oxide (N2O) is an important atmospheric trace gas due to its influence on the
20
Earth’s climate. In the troposphere N2O acts as a greenhouse gas whereas in the stratosphere it is involved in the depletion of ozone by providing NO-radicals (Prather et al., 2001). Since the beginning of the industrial revolution the global mean tro-pospheric N2O mole fraction has risen rapidly from 270 ppb up to 314 ppb in 1998 (Prather et al., 2001). About 24% of the natural sources of atmospheric N2O are
con-25
BGD
3, 993–1022, 2006Nitrous oxide in the North Atlantic Ocean
S. Walter et al. Title Page Abstract Introduction Conclusions References Tables Figures J I J I Back Close
Full Screen / Esc
Printer-friendly Version Interactive Discussion
EGU an important component of the oceanic nitrogen cycle, mainly formed by the
micro-bial processes of nitrification and denitrification (Codispoti et al., 2001; Goreau et al., 1980): Nitrification is an aerobic two-step process in which ammonium is oxidized to nitrate (NH+4→NH2OH→NO−2→NO−3) by two different groups of bacteria. In this pro-cess nitrous oxide is assumed to be a by-product, however until now the exact pathway
5
for N2O production remains unclear. In suboxic habitats nitrate can be reduced by denitrification to molecular nitrogen (NO−3→NO−2→NO→N2O→N2), here nitrous oxide is an intermediate product. Especially at oxic/suboxic boundaries N2O is produced by coupled nitrification and denitrification, due to the transfer of common intermediates (Yoshinari et al., 1997). Another possibility is aerobic denitrification, whereby under
10
fully aerobic conditions organisms convert ammonia into nitrogen gas without the in-termediary accumulation of nitrite (Robertson et al., 1988). All processes depend on oxygen concentrations, as well as the availability of substrates such as ammonium and nitrate. Many organisms are able to switch between different pathways depend-ing on environmental conditions, and also the yield of N2O during a process depends
15
on environmental conditions (Goreau et al., 1980; Poth and Focht, 1985; Richardson, 2000). Positive correlations of N2O with apparent oxygen utilization (AOU) or nitrate are interpreted as production of nitrous oxide by nitrification (Yoshinari, 1976; Cohen and Gordon, 1978; Yoshida et al., 1989). However, up to now the dominant produc-tion pathway for N2O on the global scale and the contribution of different pathways still
20
remains unclear (Codispoti et al., 2001; Popp et al., 2002).
Information on the vertical N2O distribution in the North Atlantic is sparse, only a few profiles are available. The first vertical profiles for the North Atlantic were published by Junge and Hahn (1971) and Yoshinari (1976), additional data were collected by Butler et al. (1995), and recently data from a transect at 7◦300N were reported by Oudot
25
et al. (2002). In this paper we present a comprehensive set of 73 vertical profiles of nitrous oxide from three trans-Atlantic cruises, covering the subpolar North Atlantic, the subtropical and the tropical North Atlantic. Based on these new data, we examine the regional differences of the N2O distribution and its formation pathways.
BGD
3, 993–1022, 2006Nitrous oxide in the North Atlantic Ocean
S. Walter et al. Title Page Abstract Introduction Conclusions References Tables Figures J I J I Back Close
Full Screen / Esc
Printer-friendly Version Interactive Discussion
EGU
2 Study area
2.1 Research cruises
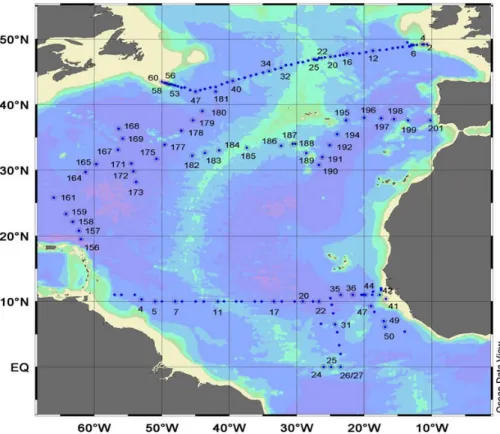
Samples from the three cruises were collected over the period from May 2002 to April 2004 (see Fig. 1).
The first cruise (May/June 2002), started in Hamburg, Germany with the German
5
research vessel “Gauss”. The cruise track followed the WOCE-A2 transect to Halifax, Canada. Depth profiles of N2O were measured at 16 stations. The WOCE-A2 transect is located between 42◦N and 49◦N.
The subtropical North Atlantic was investigated during March/April 2004 onboard the research vessel “Meteor”. The cruise started in Fort de France, Martinique (French
10
Antilles) in the western part of the Atlantic and ended in Lisbon (Portugal). Samples were taken at 37 stations. Most stations were co-located with stations where samples were taken during the Transient Tracers in the Ocean Program (TTO) in 1982.
The tropical North Atlantic samples were taken during the M55-SOLAS cruise (Wal-lace and Bange, 2004) in October/November 2002, again with the German research
15
vessel “Meteor”. This cruise started in the western tropical North Atlantic in Willemstad, Curac¸ao (Netherlands Antilles) and followed a cruise track along 10–11◦N to Douala (Cameroon). The track included a transect to the equator between 26◦W and 23.5◦W. N2O profiles were taken at 20 stations.
2.2 Hydrography
20
Several water masses in the North Atlantic can be identified in the T-S-diagram based on data from the three cruises (see Fig. 2). The main Atlantic water masses were identified according to commonly used classification schemes (Tomczak, 1999; Alvarez et al., 2004; Aiken et al., 2000; Joyce et al., 2001; Poole and Tomczak, 1999).
The WOCE A2 transect (Gauss 384-1 cruise), is located at the boundary region
be-25
BGD
3, 993–1022, 2006Nitrous oxide in the North Atlantic Ocean
S. Walter et al. Title Page Abstract Introduction Conclusions References Tables Figures J I J I Back Close
Full Screen / Esc
Printer-friendly Version Interactive Discussion
EGU region is highly variable, characterized by the exchange of upper-ocean water between
the gyres mainly via the North Atlantic Current, and the Labrador Current. One of the most important water masses here is the Labrador Sea Water (LSW). These water masses provide the major part of the North Atlantic Intermediate Water in combination with the outflow of Mediterranean Sea Water (MW), which is detected in the eastern
5
basin of the subtropical Atlantic Ocean near the Strait of Gibraltar (Richardson et al., 2000) and the Antarctic Intermediate Water (AAIW) from the south (Lorbacher, 2000). Additional water masses of the southern hemisphere that penetrate into the North At-lantic are the South AtAt-lantic Central Water (SACW) and the Antarctic Bottom Water (AABW). SACW flows northwards, and mixes with the North Atlantic Central Water
10
(NACW) at approximately 15◦N in the western and 20◦N in the eastern basin (Poole and Tomczak, 1999; Aiken et al., 2000).
A typical freshwater influence was found during the Meteor 55 cruise in the western tropical North Atlantic. Water of the Amazon was detected in the surface water, identi-fied by high temperatures and low salinity. These plumes of freshwater are transported
15
northwards by the North Brazil Current and eastwards by the equatorial current system (Fratantoni and Glickson, 2002).
3 Material and methods
Water samples for N2O analysis were collected in triplicate from various depths, taken with a 24-Niskin-bottle rosette, equipped with a CTD-sensor. The analytical method
20
applied is a modification of the method described by (Bange et al., 2001). Bubble free samples were taken immediately following oxygen sampling in 24 mL glass vials, sealed directly with butyl rubber stoppers and crimped with aluminium caps. To pre-vent microbial activity, samples were poisoned with 500 µL of 2 mM mercury chloride solution. Then 10 mL of sample was replaced with a helium headspace for each vial,
25
and the samples were allowed to equilibrate for at least two hours at room tempera-ture (temperatempera-ture was recorded continuously). A 9 mL subsample from the headspace
BGD
3, 993–1022, 2006Nitrous oxide in the North Atlantic Ocean
S. Walter et al. Title Page Abstract Introduction Conclusions References Tables Figures J I J I Back Close
Full Screen / Esc
Printer-friendly Version Interactive Discussion
EGU was used to flush a 2 mL sample loop after passing through a moisture trap (filled
with Sicapent®, Merck Germany). Gaschromatographic separation was performed at 190◦C on a packed molecular sieve column (6 ft×1/800SS, 5A, mesh 80/100, All-tech GmbH, Germany). The N2O was detected with an electron capture detector. A mixture of argon with 5% by volume methane was used as carrier gas with a flow
5
of 21 mL min−1. For the two-point calibration procedure we used standard gas mix-tures with 311.8 ±0.2 ppb and 346.5 ±0.2 ppb N2O in synthetic air (Deuste Steininger GmbH, M ¨uhlhausen Germany). The standard mixtures have been calibrated against the NOAA (National Oceanic and Atmospheric Administration, Boulder, Co.) standard scale in the laboratories of the Air Chemistry Division of the Max Planck Institute for
10
Chemistry, Mainz, Germany. 3.1 Calculations
N2O water concentrations (CN2O) were calculated as follows:
CN2Ohnmol L−1i = ( βxP Vwp+ xP
RT Vhs ) Vwp (1)
where β stands for the Bunsen solubility in nmol L−1atm−1 (Weiss and Price, 1980), x
15
is the dry gas mole fraction of N2O in the headspace in ppb, P is the atmospheric pres-sure in atm, Vwp and Vhs stand for the volumes of the water and headspace phases, respectively. R is the gas constant (8.2054×10⁻²L atm mol−1 K−1) and T is the tem-perature during equilibration. The salinity was measured by the CTD-Sensor during water sample collection. The overall relative mean analytical error was estimated to be
20
±1.8%.
The excess N2O (∆N2O) was calculated as the difference between the calculated N2O equilibrium concentration and the measured concentration of N2O as follows
BGD
3, 993–1022, 2006Nitrous oxide in the North Atlantic Ocean
S. Walter et al. Title Page Abstract Introduction Conclusions References Tables Figures J I J I Back Close
Full Screen / Esc
Printer-friendly Version Interactive Discussion
EGU To calculate the N2O equilibrium concentration we used three different atmospheric
mole fractions. Between the mixed layer and the atmosphere, N2O exchanges in about three weeks (Najjar, 1992), thus we calculated∆N2O in the mixed layer using the ac-tual atmospheric N2O value of 318 ppb measured during the “Meteor 55” cruise (Walter et al., 2004). Below the thermocline, exchange with the atmosphere is unlikely, thus,
5
calculated N2O equilibrium concentrations depend on the atmospheric N2O mole frac-tion at the time of deep-water formafrac-tion. However, the exact atmospheric mole fracfrac-tion of N2O during deep-water formation is unknown because of uncertainty in age deter-mination of water masses. Generally, tropical Atlantic deep waters below 2000 m seem to be older than 200 years (Broecker and Peng, 2000). Therefore for depths >2000 m
10
∆N2O was calculated with the tropospheric preindustrial value of 270 ppb (Fl ¨uckiger
et al., 1999). An average of the actual and the preindustrial atmospheric value (i.e., 294 ppb) was used for the depth range between the upper thermocline and 2000 m. The thermocline was defined as the depth where the temperature differs from the sur-face temperature by more than 0.5◦C (Tomczak and Godfrey, 2001). For the subtropical
15
and subpolar region we calculated∆N2O with these same mole fractions, although the age of water masses is different to the tropical Atlantic and therefore some values may be underestimated, whereas others may be overestimated. The resulting uncertainties of∆N2O are about 10–15%; however, our conclusions are not significantly affected by this uncertainty. The equilibrium values of dissolved oxygen (O2) were calculated with
20
the equation given by Weiss (1970).
The apparent oxygen utilization (AOU) was calculated as followed:
BGD
3, 993–1022, 2006Nitrous oxide in the North Atlantic Ocean
S. Walter et al. Title Page Abstract Introduction Conclusions References Tables Figures J I J I Back Close
Full Screen / Esc
Printer-friendly Version Interactive Discussion
EGU
4 Results
4.1 Distribution of nitrous oxide in the North Atlantic 4.1.1 N2O distribution along isopycnal levels
In the surface layer of the North Atlantic (Fig. 3a) N2O concentrations were relatively uniform with 8.5 ±1.2 nmol L−1. In the region of the Labrador Current N2O
concentra-5
tions were enhanced with an average of 11.6 ±0.9 nmol L−1. During the “Meteor 55” cruise, a plume of Amazon Water had been identified in the western basin of the trop-ical North Atlantic (K ¨ortzinger, 2003). In contrast to Oudot et al. (2002), who reported enhanced values in the plume of the Amazon River, we found no influence on N2O concentrations (Walter et al., 2004).
10
Below the thermocline, N2O concentrations were variable with respect to depths and regions. We found highest concentrations in the eastern basin of the tropical North Atlantic throughout the water column, with maximum concentrations on σθ surfaces between 26.3 and 27.1 (Figs. 3b–e). At the Midatlantic Ridge, located at approximately 40◦W, a distinct boundary between the western and eastern Atlantic basins was
ob-15
served (Figs. 3d–e). In the eastern subtropical North Atlantic, at approximately 1000 m (σθ27.6–27.7), a tongue of outflow water from the Mediterranean Sea was detected by higher values of salinity and temperature (Richardson et al., 2000). However, we found no apparent influence of the Mediterranean water on N2O concentrations.
Like the surface layer, deep waters (Fig. 3f) showed nearly uniform N2O
concen-20
trations, though with higher values of 13.3±1.6 nmol L−1. However, a weak but distinct trend of decreasing concentrations from the tropics (13.1±1.3 nmol L−1) to the subpolar North Atlantic (11.1±1.4 nmol L−1) could be observed.
BGD
3, 993–1022, 2006Nitrous oxide in the North Atlantic Ocean
S. Walter et al. Title Page Abstract Introduction Conclusions References Tables Figures J I J I Back Close
Full Screen / Esc
Printer-friendly Version Interactive Discussion
EGU 4.1.2 Vertical N2O distribution
The vertical distribution of N2O showed characteristically different profiles in different regions of the North Atlantic (Figs. 4a–c), and between the western and eastern basins of these regions (Figs. 5a–c).
In the subpolar North Atlantic (Fig. 4a) vertical gradients of nitrous oxide were weak
5
over the complete cruise track, with no clear or only a very weakly pronounced sub-surface maximum. N2O concentrations were near equilibrium (11.0±1.3 nmol L−1) throughout the water column, with average concentrations of 8.6±1.4 nmol L−1 in the surface layer (σθ25.3–27.0) and 11.3±1.5 nmol L−1below the thermocline down to the bottom (σθ26.2–27.7). No differences between the western and the eastern basin were
10
found (Fig. 5a).
In contrast, N2O distributions and profiles in both the subtropical and tropical North Atlantic showed strong variations with water depth (Figs. 4b–c, Figs. 5b–c). In both regions, the profiles generally had one distinct maximum. In the surface layer (σθ19.3– 26.8) concentrations were uniform, increasing below the thermocline up to a maximum
15
and decreasing down to approximately 2000 m (σθ22.1–27.8). Below 2000 m (σθ27.8– 27.9) N2O concentrations were nearly constant with depth in both basins.
In the subtropical North Atlantic (Fig. 4b) N2O surface concentrations were 8.7±0.7 nmol L−1, comparable to those in the subpolar North Atlantic. Maximum val-ues were found at depths between 600 to 1000 m (σθ 26.7–27.7); values ranged from
20
14.0 in the eastern basin (#198) to 21.3 nmol L−1 in the western basin (#156). Below 2000 m (σθ>27.8), concentrations were nearly constant at 13.1±0.9 nmol L−1. Pro-files in the western subtropical North Atlantic showed distinct maxima, while in the eastern basin no clear maximum was expressed (Fig. 5b). From the western to the eastern basin maximum concentrations decreased slightly from 17.7±1.4 nmol L−1 to
25
15.1±0.7 nmol L−1. East of the Midatlantic Ridge maxima were not clearly expressed and were broader. Additionally, maximum ∆N2O values were lower in the eastern (5.5±0.6 nmol L−1) than in the western basin (7.9±1.3 nmol L−1).
BGD
3, 993–1022, 2006Nitrous oxide in the North Atlantic Ocean
S. Walter et al. Title Page Abstract Introduction Conclusions References Tables Figures J I J I Back Close
Full Screen / Esc
Printer-friendly Version Interactive Discussion
EGU In the tropical North Atlantic (Fig. 4c) surface concentrations, with an average of
7.4±1.1 nmol L−1, were slightly lower than in the subtropical and subpolar North At-lantic. In contrast to the subtropical North Atlantic, maxima of N2O concentrations were found at shallower depths of approximately 400 m (σθ26.8–27.1). The maximum values were higher in general, and ranged from 23.8 nmol L−1 in the western basin
5
(#4) to 32.1 nmol L−1 in the eastern basin (#44). At station #36, located in the Guinea Dome area (Siedler et al., 1992; Snowden and Molinari, 2003), we observed the high-est N2O values of about 37.3 nmol L−1 at 400 m (σθ 27.0) (Fig. 4c). At the equatorial stations the N2O maxima were found at shallower water depths (240 m to 280 m, σθ 26.6–27.0). Maximum values ranged from 22.3 nmol L−1 (#26) to 24.9 nmol L−1 (#24).
10
Below 2000 m (σθ>27.8) concentrations in the tropical North Atlantic were similar to
those in the subtropics with an average of 13.2 ±1.3 nmol L−1. In both basins of the tropical North Atlantic profiles looked similar with sharp and clear maxima, however, concentrations throughout the water column increased from west to east (Fig. 5c). Be-low 2000 m (σθ>27.8) N2O concentrations were about 2 nmol L−1higher in the eastern
15
than in the western basin, whereas the difference of the maximum values was even higher (approximately 8 nmol L−1).
N2O profiles of the subtropical and tropical North Atlantic are in good agreement, both in absolute concentrations and shape of profiles, with those measured during the Bromine Latitudinal Air/Sea Transect II (BLAST II) cruise in October/November 1994
20
(Butler et al., 1995, http://www.cmdl.noaa.gov/hats/ocean/blast2/blastii.html). Below 1500 m in the North Atlantic as far as 20◦S, the mean N2O concentration observed by Butler et al. (1995) was about 13.5±1.0 nmol L−1 (n=18) which is in good agreement with our measurements (12.6±1.5 nmol L−1, n=449).
4.2 Comparison of nitrous oxide with other parameters
25
Parameters most relevant for comparison with nitrous oxide are those assumed to be directly in connection with production pathways of N2O, like oxygen or the apparent
BGD
3, 993–1022, 2006Nitrous oxide in the North Atlantic Ocean
S. Walter et al. Title Page Abstract Introduction Conclusions References Tables Figures J I J I Back Close
Full Screen / Esc
Printer-friendly Version Interactive Discussion
EGU oxygen utilization (AOU), and nitrate. In general, we found the excess of N2O (∆N2O)
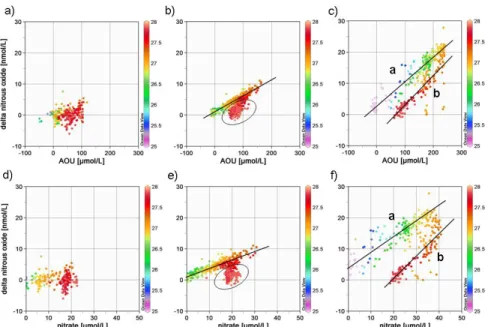
positively correlated with AOU and nitrate (Fig. 6). However, in view of differences be-tween the basins, these correlations might not be sufficient and need higher resolution. Therefore data were divided as shown in Fig. 7.
In Figs. 7a–f correlations between the excess of N2O with AOU (Figs. 7a–c) and with
5
NO−3 (Figs. 7d–f) are divided for all data of the respective regions.
Since a multiple regression analysis turned out to be not applicable due to the co-linearity between the independent variables nitrate and AOU, we applied simple re-gression analysis for the isopycnal levels below the thermocline (see Table 1). Above the thermocline in the surface layer no correlations were found.
10
In the subpolar North Atlantic (Figs. 7a, d)∆N2O is low, with values near zero. There were no significant correlations found with AOU (Fig. 7a) or nitrate (Fig. 7d; see Ta-ble 1).
In the subtropical North Atlantic (Figs. 7b, e)∆N2O was also low with values ranging from 0 to 10 nmol L−1. In contrast to the subpolar North Atlantic we found significant
15
correlations between∆N2O, AOU (Fig. 7b) and nitrate (Fig. 7e; see Table 1), especially at depths down to the N2O maxima (ca. 1000 m; σθ<27.7; see regression lines in
Figs. 7b, e). Below 1000 m (σθ27.7)∆N2O did not correlate with AOU or NO−3 (circled data in Figs. 7b, e).
In the tropical North Atlantic (Figs. 7c, f) correlations between∆N2O, AOU (Fig. 7c)
20
and nitrate (Fig. 7f) were more pronounced. We observed different ∆N2O/AOU ratios at depths down to∆N2O maxima and below the∆N2O maxima down to the bottom. From the surface layer down to 500 m (σθ<27.1; see regression line a) the slope of
the regression line (∆N2O/AOU) was approximately 20 % lower than at depths below 500 m (σθ>27.1; see regression line b), what implies that the yield of N2O at equal
25
BGD
3, 993–1022, 2006Nitrous oxide in the North Atlantic Ocean
S. Walter et al. Title Page Abstract Introduction Conclusions References Tables Figures J I J I Back Close
Full Screen / Esc
Printer-friendly Version Interactive Discussion
EGU
5 Discussion
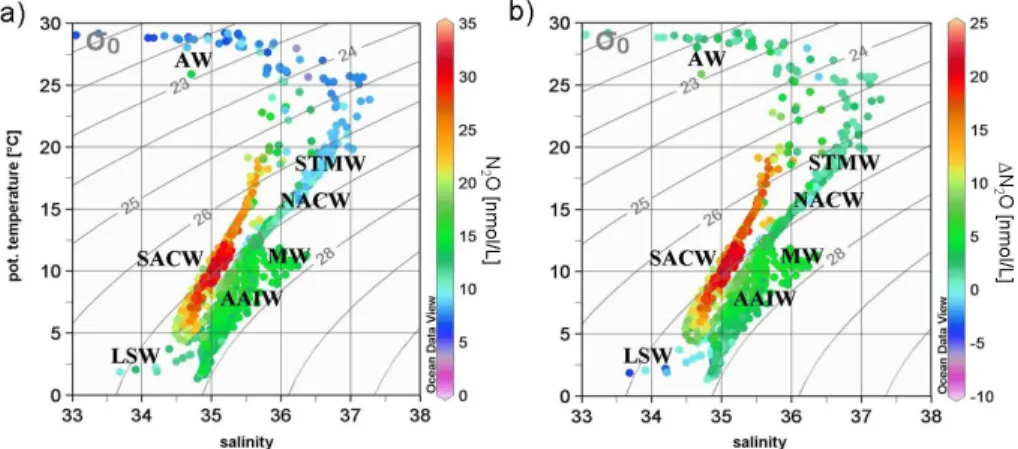
Based on our results, we were able to assign measured N2O concentrations to the water masses as shown in Fig. 2a (see Fig. 8). In the following we discuss distributions and possible origins of nitrous oxide at different depths with regard to these water masses.
5
5.1 N2O in the surface layer of the North Atlantic
In the surface layer of the North Atlantic the distribution of N2O was relatively uni-form, with concentrations near equilibrium. This is in line with the assumption that denitrification and nitrification as sources of nitrous oxide in the surface layer seem to be negligible due to the high oxygen concentrations and light inhibition of
nitrifica-10
tion (Horrigan et al., 1981). Thus, correlations between∆N2O, AOU and nitrate were nonexistent. Accordingly, we suggest that the N2O distribution in the surface layer is most likely driven by solubility and mixing effects. This is also applicable for the en-hanced N2O concentrations found in the Labrador Current. The∆N2O concentrations, which are corrected for temperature, showed no enhanced values in this region. Thus,
15
higher N2O concentrations in the Labrador Current are likely caused by the solubility effect as well. In the warmer surface layer of the tropical North Atlantic ∆N2O values were up to 4 nmol L−1, indicating the tropical North Atlantic acts as a weak source for atmospheric N2O (Walter et al., 2004).
5.2 N2O below the surface layer down to 2000 m
20
Variations of N2O vertical profiles reflected effects of water mass ventilation and sub-surface N2O production history. In the subpolar North Atlantic we assume that the hydrographic setting (such as convection processes during deep water formation and vertical mixing) is responsible for the observed concentrations and distributions of N2O and∆N2O. The most important feature in the subpolar North Atlantic is the formation
BGD
3, 993–1022, 2006Nitrous oxide in the North Atlantic Ocean
S. Walter et al. Title Page Abstract Introduction Conclusions References Tables Figures J I J I Back Close
Full Screen / Esc
Printer-friendly Version Interactive Discussion
EGU of deep water in winter in the Labrador and Irminger Seas as part of the North Atlantic
circulation in 500 to 2000 m (Rhein, 2000), which carries the atmospheric N2O imprint to depth. Labrador Sea Water spreads rapidly east- and southwards (Rhein, 2000) and thus causes the uniform distribution of N2O within the subpolar North Atlantic. Al-though the productivity of phytoplankton is relatively high in the subpolar North Atlantic,
5
we assume low biological production of N2O because of two factors: 1) high oxygen concentrations and 2) low temperatures. The yield of N2O depends on oxygen concen-tration (Goreau et al., 1980; Poth and Focht, 1985; Richardson, 2000; Codispoti et al., 1992), whereas high oxygen concentrations weaken the production of N2O. Further-more the low temperatures of the North Atlantic might have been crucial as well. The
10
temperature dependence of both nitrification rates and enzyme activities is controver-sially discussed (Berounsky and Nixon, 1990; Vouve et al., 2000; Barnard et al., 2005; Herbert, 1999; Rheinheimer, 1964; Hansen et al., 1981; Rysgaard et al., 1996), how-ever growth rates and biological production of bacteria clearly depend on the prevailing temperatures (Bock and Wagner, 2001; Hoppe et al., 2002). Thus, N2O production
15
might not be limited directly by temperature but indirectly by the limited abundance of N2O producing bacteria.
In the subtropical North Atlantic concentrations of N2O and ∆N2O were distinctly higher compared to the subpolar North Atlantic. Profiles differed clearly between the western and eastern basin. N2O profiles in the western basin showed clearly
ex-20
pressed N2O maxima between 600 to 1000 m. This pattern was not observable east of the Midatlantic Ridge where N2O and∆N2O concentrations were lower than in the western basin, and no peak maxima were observed. Hydrographic processes likely explain the shape of profiles, especially the advection of Labrador Sea Water (LSW) into the eastern basin. LSW with low N2O concentrations is transported either along
25
the eastern continental slope of America or across the Charlie-Gibbs-Fracture-Zone (Bower et al., 2002). It flows into the eastern subtropical basin at 500–2000 m (Rhein, 2000; Alvarez et al., 2004), and spreads north- and southwards (Bower et al., 2002; Rhein, 2000). In the western basin N2O concentrations and profiles are in
agree-BGD
3, 993–1022, 2006Nitrous oxide in the North Atlantic Ocean
S. Walter et al. Title Page Abstract Introduction Conclusions References Tables Figures J I J I Back Close
Full Screen / Esc
Printer-friendly Version Interactive Discussion
EGU ment with profiles published by Yoshinari (1976), who also found maximum values in
water masses with lower oxygen concentrations. These were identified as Antarctic Intermediate Water (AAIW), which flows northwards. We assume the AAIW transports N2O from the south to the subpolar North Atlantic. At depths shallower than 1000 m (σθ<27.7)∆N2O was significantly correlated with oxygen utilization and nitrate
concen-5
trations (Figs. 7b, e; Table 1), indicating nitrification has contributed to measured N2O concentrations.
In the tropical North Atlantic the N2O profiles and the observed trend along the West-East transect are in overall agreement with recently published data from a transect along 7.5◦N (Oudot et al., 2002) and a previous study in the Guinea Dome area (Oudot
10
et al., 1990). Although the overall pattern is the same, we observed generally lower N2O concentrations than Oudot et al. (2002). This might be a result of a calibration dis-agreement, supported by measured atmospheric N2O values of 316 ppb in 1993. For example, we found a peak N2O concentration of up to 37.3 nmol L−1 in South Atlantic Central Water (SACW) of the eastern basin, whereas Oudot et al. (2002) reported
val-15
ues of up to 60 nmol kg−1. Oudot et al. (2002) assumed enhanced biological activity and remineralization of organic matter in upwelling ecosystems to be responsible for these higher values in the east. However, upwelling in this area is a temporary event (Voituriez et al., 1982; Siedler et al., 1992), and during our cruise no upwelling was observed.
20
Despite the fact that upwelling might have a long-term large-scale effect, we sup-pose additional reasons for the higher N2O concentrations in the eastern basin. The productivity in the eastern basin is fueled not only by coastal upwelling (Signorini et al., 1999) but also by dust deposition off the West African coast (Mills et al., 2004). Moreover, nutrient input by major tropical rivers such as the Senegal, Gambia and
25
Niger (Perry et al., 1996) contribute to enhanced production off the West African coast, indicated by enhanced chlorophyll a concentrations (for the 2002 seasonal cycle of chlorophyll a see monthly data set of Sea-viewing Wide Field-of-view Sensor (Sea-WiFS:http://earthobservatory.nasa.gov/Observatory/Datasets/chlor.seawifs.html).
BGD
3, 993–1022, 2006Nitrous oxide in the North Atlantic Ocean
S. Walter et al. Title Page Abstract Introduction Conclusions References Tables Figures J I J I Back Close
Full Screen / Esc
Printer-friendly Version Interactive Discussion
EGU Enhanced productivity leads to a high export production (Antia et al., 2001).
Sub-sequently lowered O2 concentrations in the eastern intermediate layers due to the demineralization of organic matter support the production of N2O. Therefore, enhanced N2O concentrations in the eastern basin at this time of year (October/November 2002) might be a residual signal of past high production episode (Signorini et al., 1999).
5
Upwelling events, indicated by lower sea surface temperatures, were only found at the equator. Surface N2O concentration and sea surface temperature were positively correlated (Walter et al., 2004), and the comparably shallow N2O maxima along the equator were caused by upwelling.
Due to the occurrence of linear relationships between∆N2O and AOU and between
10
N2O and nitrate we conclude that nitrification might be the major pathway of N2O for-mation in the tropical Atlantic Ocean (Yoshida et al., 1989). Like N2O,∆N2O showed an increasing trend from West to East indicating that nitrification is more pronounced in the eastern than the western basin of the tropical Atlantic.
5.3 N2O in deep waters >2000 m (σθ>27.8) 15
Because the deep ocean contains high nitrate concentrations, nitrification was as-sumed to be responsible for N2O production (Zehr and Ward, 2002; Bange and An-dreae, 1999). Due to the low∆N2O in deep waters and insufficient correlations with nitrate and AOU, we assume N2O at these depths probably originates from deep water formation and mixing processes of southern and northern hemisphere water masses.
20
N2O profiles from a cruise into the Antarctic circumpolar current (2◦E/49.5◦S) (Walter et al., 2005) and BLAST II data east of Patagonia reveal distinctly higher N2O con-centrations in the deep waters of the southern hemisphere, with values of approxi-mately 17 nmol L−1. Northwards transport within Antarctic Bottom Water could lead to enhanced N2O concentrations in the deep water of the North Atlantic by mixing and
25
BGD
3, 993–1022, 2006Nitrous oxide in the North Atlantic Ocean
S. Walter et al. Title Page Abstract Introduction Conclusions References Tables Figures J I J I Back Close
Full Screen / Esc
Printer-friendly Version Interactive Discussion
EGU
6 Conclusions
N2O concentrations in the North Atlantic showed characteristic variations in the vertical and horizontal distributions. In general, distribution of N2O can be explained by a com-bination of biological and hydrographic reasons. The main conclusions of the present study are
5
– Production of N2O by nitrification occurs mainly in the tropical North Atlantic, es-pecially in the eastern basin. Maximum values were found in the Antarctic In-termediate Water (AAIW) in the western basin, and in the South Atlantic Central Water (SACW) in the eastern basin.
– Vertical N2O distribution and shape of profiles in the subtropical North Atlantic
10
originate from production by nitrification and advection of AAIW from the south into the western subtropical North Atlantic, respectively advection of LSW from the north in the eastern subtropical North Atlantic.
– In the subpolar North Atlantic mainly mixing processes may control the distribution
of N2O, particularly the deep water formation in the Labrador Sea. Production
15
seems to be negligible.
– Tropical and subtropical regions showed supersaturation throughout the water
column, thus the tropical and subtropical North Atlantic act as a source of atmo-spheric N2O.
– Outflow water of the Amazon or the Mediterranean Sea does not affect the N2O
20
concentration.
Acknowledgements. We thank the captains and crews of FS Meteor and FS Gauss for their
help during sampling. We especially thank P. Fritsche, H. P. Hansen, F. Malien and J. Schafstall for nutrient and oxygen measurements and CTD handling during the Meteor cruises. Thanks to K. P. Koltermann and his colleagues of the Bundesamt f ¨ur Seeschifffahrt und Hydrographie in
25
BGD
3, 993–1022, 2006Nitrous oxide in the North Atlantic Ocean
S. Walter et al. Title Page Abstract Introduction Conclusions References Tables Figures J I J I Back Close
Full Screen / Esc
Printer-friendly Version Interactive Discussion
EGU
(Max Planck Institute for Chemistry, Mainz, Germany) for calibration of our standard gas mix-tures. This study was financially supported by the Deutsche Forschungsgemeinschaft (DFG) by grants no WA1434/1, WA1434/3, and WA 1434/5.
References
Aiken, J., Rees, N., Hooker, S., Holligan, P., Bale, A., Robins, D., Moore, G., Harris, R., and
Pil-5
grim, D.: The Atlantic Meridional Transect: overview and synthesis of data, Prog. Oceanogr., 45(3–4), 257–312, 2000.
Alvarez, M., Perez, F. F., Bryden, H., and Rios, A. F.: Physical and biogeochemical transports structure in the North Atlantic subpolar gyre, J. Geophys. Res.-Oceans, 109(C3), 2004. Antia, A. N., Koeve, W., Fischer, G., Blanz, T., Schulz-Bull, D., Scholten, J., Neuer, S., Kremling,
10
K., Kuss, J., Peinert, R., Hebbeln, D., Bathmann, U., Conte, M., Fehner, U., and Zeitzschel, B.: Basin-wide particulate carbon flux in the Atlantic Ocean: Regional export patterns and potential for atmospheric CO2sequestration, Global Biogeochem. Cycles, 15(4), 845–862, 2001.
Bange, H. W. and Andreae, M. O.: Nitrous oxide in the deep waters of the world’s oceans,
15
Global Biogeochem. Cycles, 13(4), 1127–1135, 1999.
Bange, H. W., Rapsomanikis, S., and Andreae, M. O.: Nitrous oxide cycling in the Arabian Sea, J. Geophys. Res.-Oceans, 106(C1), 1053–1065, 2001.
Barnard, R., Leadley, P. W., and Hungate, B. A.: Global change, nitrification, and denitrification: A review, Global Biogeochem. Cycles, 19(1), doi:10.1029/2004GB002282, 2005.
20
Berounsky, V .M. and Nixon, S. W.: Temperature and the annual cycle of nitrification in waters of Narragansett Bay, Limnol. Oceanogr., 35(7), 1610–1617, 1990.
Bock, E. and Wagner, M.: Oxidation of inorganic nitrogen compounds as an energy source, in: The Prokaryotes: An Evolving Electronic Resource for the Microbiological Community, 3rd edition, release 3.7, Springer Verlag, New York,http://141.150.157.117:8080/prokPUB/ 25
index.htm, 2001.
Bower, A. S., Le Cann, B., Rossby, T., Zenk, W., Gould, J., Speer, K., Richardson, P. L., Prater, M. D., and Zhang, H. M.: Directly measured mid-depth circulation in the northeastern North Atlantic Ocean, Nature, 419(6907), 603–607, 2002.
BGD
3, 993–1022, 2006Nitrous oxide in the North Atlantic Ocean
S. Walter et al. Title Page Abstract Introduction Conclusions References Tables Figures J I J I Back Close
Full Screen / Esc
Printer-friendly Version Interactive Discussion
EGU
Broecker, W. S. and Peng, T.-H.: Comparison of 39Ar and 14C ages for waters in the deep ocean, Nucl. Instrum. Meth. B, 172, 473–478, 2000.
Butler, J. H., Lobert, J. M., Yvon, S. A., and Geller, L. S.: The distribution and cycling of halo-genated trace gases, in: Reports on Polar Research No. 168 – The expedition ANTARKTIS XII of RV “Polarstern” in 1994/95: Reports of legs ANT XII/1 and 2, edited by: Kattner, G.
5
and F ¨utterer, D. K., 33–40, Alfred Wegener Institute for Polar and Marine Research, Bremer-haven, 1995.
Codispoti, L. A., Brandes, J. A., Christensen, J. P., Devol, A. H., Naqvi, S. W. A., Paerl, H. W., and Yoshinari, T.: The oceanic fixed nitrogen and nitrous oxide budgets: Moving targets as we enter the anthropocene?, Sci. Mar., 65(Suppl. 2), 85–105, 2001.
10
Codispoti, L. A., Elkins, J. W., Yoshinari, T., Friederich, G. E., Sakamoto, C. M., and Packard, T. T.: On the nitrous oxide flux from productive regions that contain low oxygen waters, 271– 284, Oxford and IBH, New Delhi (India), 1992.
Cohen, Y. and Gordon, L. I.: Nitrous oxide in the oxygen minimum of the eastern tropical North Pacific: evidence for its consumption during denitrification and possible mechanisms for its
15
production, Deep-Sea Res., 25(6), 509–524, 1978.
Fl ¨uckiger, J., Dallenbach, A., Blunier, T., Stauffer, B., Stocker, T. F., Raynaud, D., and Barnola, J. M.: Variations in atmospheric N2O concentration during abrupt climatic changes, Sci., 285(5425), 227–230, 1999.
Fratantoni, D. M. and Glickson, D. A.: North Brazil current ring generation and evolution
ob-20
served with SeaWiFS, J. Phys. Oceanogr., 32(3), 1058–1074, 2002.
Gordon, A. L.: Interocean exchange of thermohaline water, J. Geophys. Res., 91, 5037–5047, 1986.
Goreau, T. J., Kaplan, W. A., Wofsy, S. C., McElroy, M. B., Valois, F. W., and Watson, S. W.: Production of NO−2 and N2O by nitrifying bacteria at reduced concentrations of oxygen, Appl.
25
Environ. Microbiol., 40(3), 526–532, 1980.
Hansen, J. I., Blackburn, T. H., and Henriksen, K.: Seasonal distribution of nitrifying bacteria and rates of nitrification in coastal marine sediments, Microb. Ecol., 7(4), 297–304, 1981. Herbert, R. A.: Nitrogen cycling in coastal marine ecosystems, FEMS Microbiol. Rev., 23, 563–
590, 1999.
30
Hoppe, H. G., Gocke, K., Koppe, R., and Begler, C.: Bacterial growth and primary production along a north-south transect of the Atlantic Ocean, Nature, 416(6877), 168–171, 2002. Horrigan, S. G., Carlucci, A. F., and Williams, P. M.: Light inhibition of nitrification in sea-surface
BGD
3, 993–1022, 2006Nitrous oxide in the North Atlantic Ocean
S. Walter et al. Title Page Abstract Introduction Conclusions References Tables Figures J I J I Back Close
Full Screen / Esc
Printer-friendly Version Interactive Discussion
EGU
films, J. Mar. Res., 39(3), 557–565, 1981.
Joyce, T. M., Hernandez-Guerra, A., and Smethie, W. M.: Zonal circulation in the NW Atlantic and Caribbean from a meridional World Ocean Circulation Experiment hydrographic section at 66◦W, J. Geophys. Res.-Oceans, 106(C10), 22 095–22 113, 2001.
Junge, C. and Hahn, J.: N2O measurements in the North Atlantic, J. Geophys. Res., 76(33),
5
8143–8146, 1971.
K ¨ortzinger, A.: A significant CO2sink in the tropical Atlantic Ocean associated with the Amazon River plume, Geophys. Res. Lett., 30(24), 2287, doi:10.1029/2003GL018841, 2003.
Krauss, W.: Comments on the development of our knowledge of the general circulation of the North Atlantic Ocean, in: The Warmwatersphere of the North Atlantic Ocean, edited by:
10
Krauss, W., 1–31, Gebr ¨uder Borntraeger, Berlin-Stuttgart, 1996.
Lorbacher, K.: Niederfrequente Variabilit ¨at meridionaler Transporte in der Divergenzzone des nordatlantischen Subtropen- und Subpolarwirbels – Der WOCE-Schnitt A2, Bericht des Bun-desamtes f ¨ur Seeschifffahrt und Hydrographie, 22, 156, 2000.
Mills, M. M., Ridame, C., Davey, M., La Roche, J., and Geider, R. J.: Iron and phosphorus
15
co-limit nitrogen fixation in the eastern North Atlantic, Nature, 429, 292–294, 2004.
Najjar, R. G.: Marine biogeochemistry, in: Climate System Modeling, edited by: Trenberth, K. E., 241–280, Cambridge University Press, Cambridge, 1992.
Oudot, C., Andrie, C., and Montel, Y.: Nitrous oxide production in the tropical Atlantic Ocean, Deep-Sea Res. I, 37(2), 183–202, 1990.
20
Oudot, C., Jean-Baptiste, P., Fourre, E., Mormiche, C., Guevel, M., Ternon, J.-F., and Le Corre, P.: Transatlantic equatorial distribution of nitrous oxide and methane, Deep-Sea Res. I, 49, 1175–1193, 2002.
Perry, G .D., Duffy, P. B., and Miller, N. L.: An extended data set of river discharges for validation of general circulation models, J. Geophys. Res., 101(D16), 21 339–21 349, 1996.
25
Poole, R. and Tomczak, M.: Optimum multiparameter analysis of the water mass structure in the Atlantic Ocean thermocline, Deep-Sea Res. I-Oceanographic Research Papers, 46(11), 1895–1921, 1999.
Popp, B. N., Westley, M. B., Toyoda, S., Miwa, T., Dore, J. E., Yoshida, N., Rust, T. M., Sansone, F. J., Russ, M. E., Ostrom, N. E., and Ostrom, P. H.: Nitrogen and oxygen isotopomeric
30
constraints on the origins and sea-to-air flux of N2O in the oligotrophic subtropical North
Pacific gyre, Global Biogeochem. Cycles, 16(4), 1064, doi:10.1029/2001GB001806, 2002. Poth, M. and Focht, D. D.:15N kinetic analysis of N2O production by Nitrosomonas europaea
-BGD
3, 993–1022, 2006Nitrous oxide in the North Atlantic Ocean
S. Walter et al. Title Page Abstract Introduction Conclusions References Tables Figures J I J I Back Close
Full Screen / Esc
Printer-friendly Version Interactive Discussion
EGU
an examination of nitrifier denitrification, Appl. Environ. Microbiol., 49(5), 1134–1141, 1985. Prather, M., Ehhalt, D., Dentener, F., Derwent, R., Dlugokencky, E., Holland, E., Isaksen, I.,
Katima, J., Kirchhoff, V., Matson, P., Midgley, P., and Wang, M.: Atmospheric chemistry and greenhouse gases, in: Climate Change 2001: The Scientific Basis. Contribution of Working Group I to the Third Assessment Report of the Intergovernmental Panel on Climate Change,
5
edited by: Houghton, J. T., Ding, Y., Griggs, D. J., Noguer, M., Van der Linden, P. J., Dai, X., Maskell, K., and Johnson, C. A., 239–287, Cambridge University Press, Cambridge, UK, 2001.
Rhein, M.: Oceanography – Drifters reveal deep circulation, Nature, 407(6800), 30–31, 2000. Rheinheimer, G.: Untersuchungen ¨uber den Einfluß der Temperatur auf die Nitrifikation im
10
Elbe-Aestuar, Arch. Mikrobiol., 49, 283–290, 1964.
Richardson, D. J.: Bacterial respiration: a flexible process for a changing environment, Micro-biol., 146, 551–571, 2000.
Richardson, P. L., Bower, A. S., and Zenk, W.: A census of Meddies tracked by floats, Prog. Oceanogr., 45(2), 209–250, 2000.
15
Robertson, L. A., van Niel, E. W. J., Torremans, R. A. M., and Kuenen, J. G.: Simultaneous nitrification and denitrification in aerobic chemostat cultures of Thiosphaera pantotropha, Appl. Environ. Microbiol., 54(11), 2812–2818, 1988.
Rysgaard, S., Finster, K., and Dahlgaard, H.: Primary production, nutrient dynamics and min-eralisation in a northeastern Greenland fjord during the summer thaw, Polar Biol., 16(7),
20
497–506, 1996.
Seitzinger, S. P., Kroeze, C., and Styles, R. V.: Global distribution of N2O emissions from aquatic systems: Natural emissions and anthropogenic effects, Chemosphere: Global Change Sci., 2(3), 267–279, 2000.
Siedler, G., Zangenberg, N., and Onken, R.: Seasonal changes in the tropical Atlantic
circula-25
tion - Observation and simulation of the Guinea Dome, J. Geophys. Res.-Oceans, 97(C1), 703–715, 1992.
Signorini, S. R., Murtugudde, R. G., McClain, C. R., Christian, J. R., Picaut, J., and Busalacchi, A. J.: Biological and physical signatures in the tropical and subtropical Atlantic, J. Geophys. Res.-Oceans, 104(C8), 18 367–18 382, 1999.
30
Snowden, D. P. and Molinari, R. L.: Subtropical cells in the Atlantic Ocean: An observational summary, in: Interhemispheric Water Exchange in the Atlantic Ocean, edited by: Goni, G. J. and Malanotte-Rizzoli, P., 287–312, Elsevier, New York, 2003.
BGD
3, 993–1022, 2006Nitrous oxide in the North Atlantic Ocean
S. Walter et al. Title Page Abstract Introduction Conclusions References Tables Figures J I J I Back Close
Full Screen / Esc
Printer-friendly Version Interactive Discussion
EGU
Tomczak, M.: Some historical, theoretical and applied aspects of qualitative water mass analy-sis, J. Mar. Res., 57, 275–303, 1999.
Tomczak, M. and Godfrey, J. S.: Regional Oceanography: An Introduction, http://www.es.
flinders.edu.au/∼mattom/regoc/pdfversion.html, 2001.
Voituriez, B., Herbland, A., and Leborgne, R.: Equatorial upwelling in the eastern Atlantic during
5
FGGE, Oceanol. Acta, 5(3), 301–314, 1982.
Vouve, F., Guiraud, G., Marol, C., Girard, M., Richard, P., and Laima, M. J. C.: NH+4 turnover in intertidal sediments of Marennes-Oleron Bay (France): effect of sediment temperature, Oceanol. Acta, 23(5), 575–584, 2000.
Wallace, D. W. R. and Bange, H. W.: Introduction to special section: Results of the Meteor 55:
10
Tropical SOLAS Expedition, Geophys. Res. Lett., 31, L23S01, 1–4, 2004.
Walter, S., Bange, H. W., and Wallace, D. W. R.: Nitrous oxide in the surface layer of the tropical North Atlantic Ocean along a west to east transect, Geophys. Res. Lett., 31(23), L23S07, doi:10.1029/2004GL019937, 2004.
Walter, S., Peeken, I., Lochte, K., and Bange, H. W.: Nitrous oxide measurements during
15
EIFEX, the European Iron Fertilisation Experiment in the subpolar South Atlantic Ocean, Geophys. Res. Lett., 32, L23613, doi:10.1029/2005GL024619, 2005.
Weiss, R. F.: The solubility of nitrogen, oxygen and argon in water and seawater, Deep-Sea Res., 17, 721–735, 1970.
Weiss, R. F. and Price, B. A.: Nitrous oxide solubility in water and seawater, Mar. Chem., 8,
20
347–359, 1980.
Yoshida, N., Morimoto, H., Hirano, M., Koike, I., Matsuo, S., Wada, E., Saino, T., and Hattori, A.: Nitrification rates and15N abundances of N2O and NO−3 in the western North Pacific, Nature, 342, 895–897, 1989.
Yoshinari, T.: Nitrous oxide in the sea, Mar. Chem., 4, 189–202, 1976.
25
Yoshinari, T., Altabet, M. A., Naqvi, S. W. A., Codispoti, L., Jayakumar, A., Kuhland, M., and De-vol, A.: Nitrogen and oxygen isotopic composition of N2O from suboxic waters of the eastern tropical North Pacific and the Arabian Sea - Measurement by continuous-flow isotope-ratio monitoring, Mar. Chem., 56(3–4), 253–264, 1997.
Zehr, J. P. and Ward, B. B.: Nitrogen cycling in the ocean: New perspectives on processes and
30
BGD
3, 993–1022, 2006Nitrous oxide in the North Atlantic Ocean
S. Walter et al. Title Page Abstract Introduction Conclusions References Tables Figures J I J I Back Close
Full Screen / Esc
Printer-friendly Version Interactive Discussion
EGU Table 1. Regression analyses between∆N2O and AOU, and∆N2O and NO−3 at different
isopy-cnal levels. Bold numbers mean relationships with significance levels of p<0.001 and R2>0.5.
The coefficients a and b mean slope and intercept.
∆N2O/AOU ∆N2O/NO − 3 region sigma n a b R2 a b R2 subpolar thermocline–26.0 – – – – – – – 26.1–26.5 – – – – – – – 26.6–27.0 13 0.045 −0.209 0.21 0.205 −0.882 0.09 27.1–27.5 49 0.028 −0.452 0.23 0.159 −1.087 0.14 27.6–27.9 179 0.022 −1.714 0.07 0.164 −3.240 0.03 subtropical thermocline–26.0 – – – – – – – 26.1–26.5 45 0.038 1.307 0.58 0.297 1.337 0.51 26.6–27.0 106 0.065 0.397 0.75 0.390 0.186 0.68 27.1–27.5 121 0.055 0.426 0.67 0.312 −0.052 0.60 27.6–27.9 355 0.069 −3.083 0.38 −0.126 4.579 0.02 tropical thermocline–26.0 34 0.080 3.783 0.72 0.599 4.681 0.61 26.1–26.5 39 0.099 −1.421 0.83 0.777 −3.212 0.81 26.6–27.0 98 0.107 −3.112 0.49 0.376 6.068 0.20 27.1–27.5 63 0.114 −10.638 0.43 1.289 −35.05 0.42 27.6–27.9 69 0.075 −4.853 0.67 0.619 −11.83 0.66
BGD
3, 993–1022, 2006Nitrous oxide in the North Atlantic Ocean
S. Walter et al. Title Page Abstract Introduction Conclusions References Tables Figures J I J I Back Close
Full Screen / Esc
Printer-friendly Version Interactive Discussion
EGU f01
Fig. 1. Cruise tracks for “Gauss 384-1” (subpolar North Atlantic, 16 May to 14 June 2002),
“Meteor 60-5” (subtropical North Atlantic, 9 March to 14 April 2004) and “Meteor 55” (tropical North Atlantic, 13 October to 16 November 2002). Numbers are given for stations where N2O profiles were measured.
BGD
3, 993–1022, 2006Nitrous oxide in the North Atlantic Ocean
S. Walter et al. Title Page Abstract Introduction Conclusions References Tables Figures J I J I Back Close
Full Screen / Esc
Printer-friendly Version Interactive Discussion
EGU f02
Fig. 2. T-S-diagram of the North Atlantic; (a) T-S-diagram with data from all three cruises; (b)
T-S-diagram in (a) framed by box.; AW: Amazon Water; STMW: Subtropical Mode Water; MW: Mediterranean Water; SACW: South Atlantic Central Water; NACW: North Atlantic Central Water; AAIW: Antarctic Intermediate Water, AABW: Antarctic Bottom Water; lNADW: lower North Atlantic Deep Water; uNADW: upper North Atlantic Deep Water; LSW: Labrador Sea Water.
BGD
3, 993–1022, 2006Nitrous oxide in the North Atlantic Ocean
S. Walter et al. Title Page Abstract Introduction Conclusions References Tables Figures J I J I Back Close
Full Screen / Esc
Printer-friendly Version Interactive Discussion
EGU f03
Fig. 3. Distribution of N2O in the North Atlantic along isopycnal levels σθ[kg m
−3
]. Dots indicate stations with available data for the isopycnal levels. (a) surface–thermocline; (b) thermocline–
BGD
3, 993–1022, 2006Nitrous oxide in the North Atlantic Ocean
S. Walter et al. Title Page Abstract Introduction Conclusions References Tables Figures J I J I Back Close
Full Screen / Esc
Printer-friendly Version Interactive Discussion
EGU
f04
Fig. 4. N2O concentration in the North Atlantic plotted against depth. (a) subpolar, (b)
BGD
3, 993–1022, 2006Nitrous oxide in the North Atlantic Ocean
S. Walter et al. Title Page Abstract Introduction Conclusions References Tables Figures J I J I Back Close
Full Screen / Esc
Printer-friendly Version Interactive Discussion
EGU
f05
Fig. 5. Selected vertical N2O profiles in the western basin (filled symbols) and the eastern basin (open symbols) in the North Atlantic. Stations were indicated by numbers. (a) subpolar, (b) subtropical, (c) tropical North Atlantic.
BGD
3, 993–1022, 2006Nitrous oxide in the North Atlantic Ocean
S. Walter et al. Title Page Abstract Introduction Conclusions References Tables Figures J I J I Back Close
Full Screen / Esc
Printer-friendly Version Interactive Discussion
EGU
f06
Fig. 6. ∆N2O in comparison with AOU (a) and nitrate (b) for the North Atlantic, sigma σθ is
colour coded in kg m−3. y(∆N2O)=0.089x(AOU)–3.245, R 2=0.714 y(∆N2O)=0.331x(NO − 3)−1.263, R 2=0.322.
BGD
3, 993–1022, 2006Nitrous oxide in the North Atlantic Ocean
S. Walter et al. Title Page Abstract Introduction Conclusions References Tables Figures J I J I Back Close
Full Screen / Esc
Printer-friendly Version Interactive Discussion
EGU
f07
Fig. 7. ∆N2O in comparison with AOU(a–c) and nitrate (d–f), sigma σθis colour coded in kg
m−3.
(a) and (d) subpolar North Atlantic (b) and (e) subtropical North Atlantic; y (∆N2O)=0.0473x(AOU)+1.1409, R 2=0.86 for σ θ< 27.7(∼ <1000 m); y (∆N2O)=0.2497x(NO − 3)+1.1776, R 2=0.80 for σ θ< 27.7(∼ <1000 m);
circled data represent σθ> 27.7(∼>1000 m)
(c) and (f) tropical North Atlantic;
line a: y (∆N2O)=0.0785x(AOU)+2.4381, R
2=0.87 for σ
θ< 27.1(∼<500 m);
line b: y (∆N2O)=0.0942x(AOU)−6.6675, R2=0.81 for σθ> 27.1(∼>500 m);
line a: y (∆N2O)=-0.4848x(NO−3)+3.1756, R2=0.79 for σ< 27.1(∼<500 m); line b: y (∆N2O)=0.7379x(NO
−
3)−14.665, R
BGD
3, 993–1022, 2006Nitrous oxide in the North Atlantic Ocean
S. Walter et al. Title Page Abstract Introduction Conclusions References Tables Figures J I J I Back Close
Full Screen / Esc
Printer-friendly Version Interactive Discussion
EGU
f08
Fig. 8. N2O concentration(a) and∆N2O(b) distributed in a T-S-diagram, the N2O and∆N2O concentrations are colour coded in nmol L−1. AW: Amazon Water; STMW: Subtropical Mode Water; MW: Mediterranean Water; SACW: South Atlantic Central Water; NACW: North Atlantic Central Water; AAIW: Antarctic Intermediate Water; LSW: Labrador Sea Water.