Advance Access publication 6 February 2007
COMPARING ALCOHOL CONSUMPTION IN CENTRAL AND EASTERN EUROPE TO OTHER
EUROPEAN COUNTRIES
SVETLANA POPOVA1,2∗, J ¨URGEN REHM1,3,4, JAYADEEP PATRA1 and WITOLD ZATONSKI5
1Centre for Addiction and Mental Health, Toronto, Canada 2Faculty of Social Work University of Toronto, Canada 3Research Institute for Public Health and Addiction, Zurich, Switzerland
4Technische Universit¨at Dresden, Germany
5Cancer Center and Institute of Oncology, Cancer Epidemiology and Prevention Division, Warsaw, Poland (Received 9 December 2006; accepted 26 December 2006; advance access publication 6 February 2007)
Abstract — Aims: To give an overview of the volume of alcohol consumption, beverage preference, and patterns of drinking among
adults (people 15 years and older) in central and eastern Europe (Bulgaria, Czech Republic, Estonia, Hungary, Latvia, Lithuania, Poland, Romania, Slovakia, and Slovenia) and to compare it to southern and western Europe, Russia and Ukraine. Methods: Secondary data analysis. Consumption and preferred beverage type data for the year 2002 were taken from the WHO Global Status Report on Alcohol and the WHO Global Alcohol Database. Results: Average consumption in central and eastern Europe is high with a relatively large proportion of unrecorded consumption ranging from one litre in Czech Republic and Estonia to 10.5 l in Ukraine. The proportion of heavy alcohol consumption (more than 40 g of pure alcohol per day) among men was the lowest in Bulgaria (25.8%) and the highest in Czech Republic (59.4%). Among women, the lowest proportion of heavy alcohol consumption was registered in Estonia (4.0%) and the highest in Hungary (16.0%). Patterns of drinking are detrimental with a high proportion of binge drinking, especially in the group of countries traditionally drinking vodka. In most countries, beer is now the most prevalent alcoholic beverage. Conclusions: Other studies suggest that the population drinking levels found in central and eastern Europe are linked with higher levels of detrimental health outcomes. Known effective and cost-effective programs to reduce levels of risky drinking should, therefore, be implemented, which may, in turn, lead to a reduction of alcohol-attributable burden of disease.
INTRODUCTION
Alcohol consumption is an important risk factor for morbidity, mortality and social harm worldwide (Rehm et al ., 2004; Rehm et al ., 2003a). Europe has the highest level of drinking in the world (Rehm et al ., 2003b; WHO, 2004a). A recent report from the Institute of Alcohol Studies estimates that every year alcohol is responsible for 115 000 net deaths in Europeans up to the age of 70 (Anderson and Baumberg, 2006). Alcohol is the leading contributor to death among young adult men with about 25% mortality being due to alcohol. 7.4% of all disability and premature deaths are alcohol-attributable in the European Union (EU). The report also estimated the tangible costs of alcohol to the EU in 2003 to be 125 billion Euro, which is 1.3% of the EU GDP (Anderson and Baumberg, 2006).
On a national level, the severity of the alcohol-related con-sequences depends on the volume of alcohol consumption over time, the pattern of drinking, and in some regions, such as Russia, on the quality of the alcoholic beverage (BBC News, 2005; Nuzhnyi, 2004; Rehm et al ., 2004). Overall, the higher the level of consumption, the higher the morbid-ity and mortalmorbid-ity (e.g. Her and Rehm, 1998; Norstr¨om, 2004; Norstr¨om and Ramstedt, 2005). High levels of alcohol intake, especially in binges (e.g. more than 60 g of pure alcohol con-sumption per day; Gmel et al ., 2003) increase the risk of liver cirrhosis, injuries, some forms of malignant neoplasms, alco-hol use disorders, and cardiovascular disease (Rehm et al .,
*Author to whom correspondence should be addressed at: Social, Prevention and Health Policy Research Department, Centre for Addiction and Mental Heath, 33 Russell Street, Room # T406, Toronto, Ontario, Canada M5S 2S1, Canada. Tel: (416) 535-8501 ext.4558; Fax: (416) 260-4156;
E-mail: lana [email protected]
2003c). However, moderate regular alcohol consumption has a cardioprotective effect as evidenced mainly in studies in populations with low levels of binge drinking (Puddey et al ., 1999; Rehm et al ., 2003d).
Europe is traditionally known for its high alcohol consump-tion, and central and eastern Europe (CEE) are no exception. In this report, countries of CEE refers to those countries that recently joined the EU or are candidate countries: Bulgaria, Czech Republic, Estonia, Hungary, Latvia, Lithuania, Poland, Romania, Slovakia, and Slovenia. Historically, in these coun-tries, three different cultures of alcohol drinking can be dis-tinguished based on both product tradition, drinking pattern, and social reactions to alcohol (Iontchev, 1998):
• The Mediterranean pattern: In the south of CEE (Bulgaria, Hungary, Romania, Slovenia), as well as in other former Yugoslavian countries, which are not part of our focus, there have traditionally been wine and fruit brandy coun-tries, which are strongly influenced by the Mediterranean, especially the Greek and Italian, way of drinking. The Mediterranean style of drinking is characterized by almost daily drinking of alcohol, often drinking wine with meals, and no acceptance of public drunkenness.
• The Central European pattern: Czech Republic and Slo-vakia can be distinguished specifically as beer-drinking countries, very similar in style to Germany. Although, in recent decades, spirits consumption (often based on fruits) has increased in Slovakia. The beer drinking culture in the Czech Republic is similar to the Mediterranean style in both the frequency of drinking and the lack of acceptance of public drunkenness.
• The Northern European pattern: Traditional vodka drink-ing cultures constitute the northern part of CEE (Esto-nia, Latvia, Lithua(Esto-nia, Poland), and are also found in the The Author 2007. Published by Oxford University Press on behalf of the Medical Council on Alcohol. All rights reserved The online version of this article has been published under an open access model. Users are entitled to use, reproduce, disseminate, or display the open access version of this article for non-commercial purposes provided that: the original authorship is properly and fully attributed; the Journal and Oxford University Press are attributed as the original place of publication with the correct citation details given; if an article is subsequently reproduced or disseminated not in its entirety but only in part or as a derivative work this must be clearly indicated. For commercial re-use, please contact [email protected]
Ukraine and Russia, which were used as eastern comparator countries in this report, and in Nordic countries (Denmark, Finland, Iceland, Norway, and Sweden). The production of distilled spirits began after the invention of the alcohol distillation process and, thus, has a substantially shorter tra-dition than wine drinking in the Mediterranean. The pattern of drinking in spirits (vodka) countries can be characterized by non-daily drinking, irregular binge drinking episodes (e.g. during weekends and at festivities), and the acceptance of drunkenness in public.
Historically, in the 20th century, the countries also differed with respect to legality of home production of alcohol: in cultures of wine and fruit brandy, home production has been acceptable until recent times, whereas home production was illegal in CEE countries of the Northern European pattern of drinking.
In the time of Communist rule, however, the traditional cultures of drinking were strongly influenced by the Soviet way of vodka drinking, and became more similar to one another in that respect. In terms of time trends, there was an increase in consumption after World War II. In the 1980s, there were periods during which alcohol production was decreased by the state (Gorbachev reform in former Soviet countries, Poland’s martial law), with consequent drops in consumption and disease (Leon et al ., 1997; Zatonski and Jha, 2000). In times of transition after the collapse of the Soviet bloc, alcohol consumption increased for a period, in part due to the lack of regulation (Zatonski and Jha, 2000). Although European countries in general, and CEE in particular, currently still vary in beverage preferences and drinking patterns, recent studies report a slow homogenization in terms of consumption levels and main beverage preferences (Norstr¨om, 2002).
The objective of this report is to provide an overview and comparison of current alcohol consumption, beverage preferences and patterns of drinking among adults (people 15 years and older) in CEE to southern and western Europe, Russia and Ukraine. The year 2002 was chosen as reference year, as this is the most recent year for which relevant information was available for many countries.
METHOD
Thirty-one European countries were combined into six groups and analysed as follows:
1. New EU member states from central and eastern Europe: Czech Republic, Estonia, Hungary, Latvia, Lithuania, Poland, Slovakia, and Slovenia.
2. Candidates for EU Membership from central and eastern Europe: Bulgaria and Romania.
3. Comparison countries to the east: Russia and Ukraine. 4. Mediterranean countries: Cyprus, France, Greece, Italy,
Malta, Portugal, and Spain.
5. Nordic countries: Denmark, Finland, Iceland, Norway, and Sweden.
6. Rest of EU: Austria, Belgium, Germany, Ireland, Luxem-bourg, Netherlands, and United Kingdom (UK).
Exposure data on recorded and unrecorded1 adult per capita alcohol consumption were taken from the WHO Global Status Report on Alcohol 2004 (WHO, 2004a) for New EU member states and the comparison countries of Russia and Ukraine. For the rest of the countries the data were obtained from large representative surveys conducted in the respective countries which were in closest temporal proximity to the year 2002. Per capita consumption records were obtained from the WHO Global Alcohol Database (GAD) (WHO, 2006). The GAD estimates are based on industry publications on alcohol produced and sold, as well as on data from the Food and Agriculture Organization (FAO) and national sources (Rehm
et al ., 2003b). Main preferred beverage and its volume of
recorded consumption were obtained from the GAD (WHO, 2006). Information on beverage for unrecorded consumption was taken from the Global Status Report on Alcohol (WHO, 2004a) (countries profiles).
Data on abstention and volume of consumption (Table 2) were taken from surveys and adjusted for adult per capita consumption (i.e. average consumption by everyone aged 15 and above) (see Rehm et al ., 2004). Specifically, these data were taken from the following sources: Bulgaria (Health Sur-vey of Bulgarian population, 2001 by the National Statistical Institute, data provided by Plamen Dimitrov); Czech Repub-lic (World Health Survey, 2003; for information see ¨Ust¨un
et al ., 2003; WHO, 2004a); Estonia (2001 survey reported in
Reitan, 2004; World Health Survey, 2003; see ¨Ust¨un et al ., 2003; WHO, 2004a); Hungary (National Health Survey, 2000, by Hungarian Gallup Institute TGO, 2001; World Health Sur-vey, 2003; see ¨Ust¨un et al ., 2003; WHO, 2004a); Lithuania (based on surveys reported by Brunovskis and Ugland, 2002, for abstainer information; McKee et al ., 2000; Reitan, 2004, for drinking categories; surveys were conducted in 1999, 1997 and 2001, respectively); Latvia (2001 survey reported by Reitan, 2004); Poland (survey of The States Agency for Prevention of Alcohol Related Problems, 2002, data provided by J. Moskalewicz); Romania (1992 survey reported in Ferrer
et al ., 1995; Russia (World Health Survey, 2003; see ¨Ust¨un
et al ., 2003; WHO, 2004a); Slovakia (World Health Survey,
2003; see ¨Ust¨un et al ., 2003; WHO, 2004a); and Slovenia (Public Opinion Survey, 2002, provided by T. Albreht).
Patterns of drinking were obtained from Rehm et al . (2004). A pattern of drinking score, which consists of a four-point scale, reflects how people drink instead of how much they drink. This scale ranges from 1 (lowest risk) to 4 (highest risk) and combines scores in six dimensions: high quantities of drinking per occasion; frequency of getting drunk; festive drinking being common; drinking in public places being common; drinking with meals being uncommon; low rate of daily drinking (Gmel et al ., 2001; Rehm et al ., 2001; Rehm
et al ., 2003b; Rehm et al ., 2004). The score measures not
the overall rate of hazardous drinking, but the degree of hazard associated with each extra per capita litre of alcohol consumed. This approach provides meaningful comparisons
1Unrecorded alcohol consumption is a proportion which is not reflected in official national records or surveys. The sources of unrecorded alcohol include most importantly: 1) home production (especially spirits); 2) alcohol intended for industrial, technical and medical uses, 3) illegal industrial production or import; 4) beverages with alcohol levels below the legal definition (WHO, 2004a).
across countries because drinking patterns have been found to be relatively stable over time (Simpura, 2001). A number of studies showed that this score is an important and reliable indicator for determining alcohol-attributable harm (Rehm
et al ., 2004).
The data of the countries, when combined and analysed as a group, have been weighted by population of the countries for the year 2002 (United Nations, 2005). The results for countries were compared to the world and WHO Europe A region (own calculations; for methods see Rehm et al ., 2006).
RESULTS
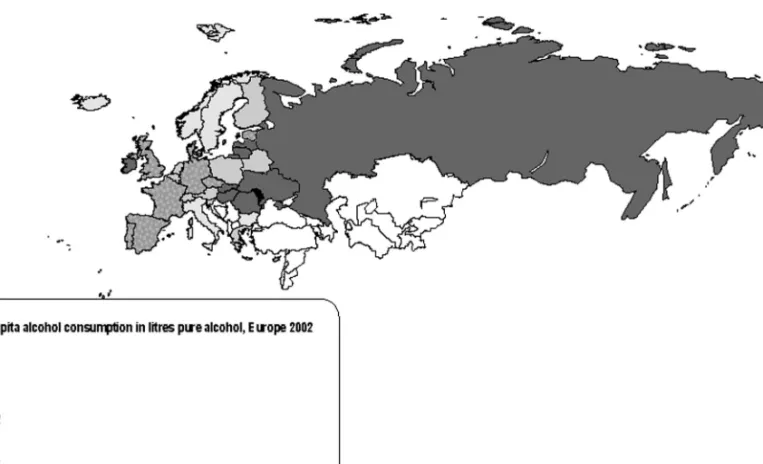
As shown in the map of Europe (Fig. 1), the highest overall per capita recorded and unrecorded alcohol consumption (14–25 l of pure alcohol per year) for the year 2002 were found predominantly in the eastern European countries. The highest level of consumption was in Moldova Republic (24.9 l of pure alcohol per adult resident) followed by Lithuania, Latvia, Slovakia, Hungary, Russia, Ukraine, and Romania as well as in some western countries such as Ireland. This contrasts with the lowest levels of alcohol consumption (6–10 l) which was observed in Malta, followed by Nordic countries such as Iceland, Norway, Sweden, and finally by countries that engage in the Mediterranean drinking style, such as Bulgaria and Italy.
Table 1 gives an overview of recorded and unrecorded per capita alcohol consumption and main beverage of recorded and unrecorded consumption in European countries.
There was considerable variation in levels of recorded per capita alcohol consumption among European countries. The highest recorded consumption was also found in eastern Europe (new EU member states): Czech Republic (12.9 l of pure alcohol per capita), followed by Slovakia (12.4 l) and Lithuania (12.3 l). The most preferred beverages of recorded consumption in these countries were beer and spirits. More spirits were consumed in Eastern countries compared to other countries, and binge drinking was more frequent in these countries as well (data not shown).
Recorded consumption was noticeably lower in Bulgaria (6.4 l) and in the Nordic countries (7.9 l). The beverages of choice were wine and spirits in Bulgaria, and beer in the Nordic countries. Recorded consumption in all European countries included in this analysis was higher compared to the world (4.4 l) (own calculations, see Rehm et al ., 2006).
In the western European countries, the main types of beverage consumed were wine in Mediterranean countries, and beer in Nordic countries as well as in the rest of the EU. Unrecorded per capita alcohol consumption showed a similar trend to recorded consumption, with eastern European countries reporting the high consumption of unrecorded alcohol, with the highest level in Ukraine (10.5 l), Latvia (7.0 l), Lithuania and Russia (4.9 l). On average, unrecorded per capita alcohol consumption was higher in CEE countries and their eastern European neighbours as compared to the
T able 1 . A lcohol cons umption in E uropean region and the world, 2002 Recorded per M ain b everage o f Overall (recorded capita Main beverage of recorded Main beverage’s Unrecorded & unrecorded) cons umption in recorded cons umption in % of recorded consumption in B everage o f u nrecorded consumption in Countries litres a consumption litres consump tion litres consumption litres N ewE UM em b er States 10.2 b eer/s pirits 5.2 0 .5 3.1 13.3 Czech Republic 12.9 b eer 9.2 71.3 1 .0 Slivovitz (moonshine made from d istilling plumps : 2 5 – 70% of alcohol) 13.9 Es tonia 11.4 b eer/s pirits 4.3 37.7 1 .0 Spirits (vodka: 40% of alcohol) 12.4 Hungary 11.9 w ine/beer/s pirits 4.7 39.5 4 .0 Home made fruit brandies (palinka: 60 – 80% of alcohol) 15.9 Latvia 9.5 spirits 6.8 71.6 7 .0 Low quality, toxic alcohol 16.5 Lithuania 12.3 b eer/s pirits 4.5 36.6 4 .9 Home brew sp irits (> 40% o f alcohol) 17.2 Poland 8.7 b eer/s pirits 4.3 49.4 3 .0 B imber, samogon, ks iezyc ´owka (homemade liqueur: 4 0 – 6 0% of alcohol); sliwowica, lacka sliwowica (moons hine made from distilling p lumps: 40 – 6 0% of alcohol) 11.7 Slovakia 12.4 b eer/spirits 5.7 46.0 4 .0 Domaka (fruit homemade h ard alcohol: 60% o f alcohol) 16.4 Slovenia 7 .1 beer 4.0 56.3 3 .0 T ropinovec o r ˇ Snopc is distilled from fermented g rapes : 60 – 70% of alcohol; homemade R akija (fruit brandy: > 40% alcohol) 10.1 C andidates for EU Membership 9.2 w ine/s p irits 3.4 37.5 3 .7 13.0 B u lgaria 6.4 w ine/s p irits 2.8 44.1 3 .0 R akija (homemade fruit brandy: 50 – 60% of alcohol), boza (beer made with grain: up to 4% of alcohol) 9.4 (C o ntinued o ver leaf )
Ta b le 1 . (C ontinued ) Recorded per M ain b everage o f Overall (recorded capita Main beverage of recorded Main beverage’s Unrecorded & unrecorded) cons umption in recorded cons umption in % of recorded consumption in B everage o f u nrecorded consumption in Countries litres a consumption litres consump tion litres consumption litres Romania 10.3 b eer/wine/spirits 3.6 35.0 4 .0 Palinka, switka (homemade fruit distilled brandy: 40% of alcohol) 14.3 Co m p ariso n C ountries 9.2 spirits 5.7 55.0 6 .3 15.5 R u ss ia 10.6 spirits 7.4 69.8 4 .9 Samogon (vodka: > 40 % o f alcohol) 15.5 Ukraine 4 .9 spirits 0.5 10.2 1 0.5 D istilled alcohol, p yvo (hopped b eer: 3 – 6 % of alcohol), b raha (unhopped m illet b eer: 3 – 6 % o f alcohol) 15.4 Mediterranean C ountries : C yprus , France, Greece, Italy, Malta, Portugal, Spain 10.6 w ine 6 .2 59.4 1 .2 R elatively low unrecorded alcohol cons umption; ouzo and raki (s p irits : 40% of alcohol) in Greece and C yprus; w ine (8.5 – 20% of alcohol) production u se d o r sold informally by farmers in o thers. 11.8 Nordic C ountries : Denmark, Finland, Iceland, Norway, Sweden 7.9 b eer 4.2 54.0 2 .3 T ravelers ’ imports and homemade spirits 10.2 R es t of EU: A us tria, Belgium, Germany, Ireland, Luxembour g, Netherlands, U K 11.6 b eer 6.6 56.6 1 .2 Overall low proportion o f unrecorded alcohol cons umption 12.8 Wo rl d b 4.4 spirits 2.0 45.5 1 .7 V aries by countries 6.2 aAdult p er capita (age 15 + ) consumption for 2002 in litres of pure alcohol, d erived as average o f y early consumptions, incl uding unrecorded consumption. bOwn calculations (see Rehm et al ., 2006).
world average (1.7 l), and compared to the average in other European regions.
It had been found that countries of CEE and its eastern neighbors (i.e. Croatia, Hungary, Moldova Republic, Roma-nia, SloveRoma-nia, and Ukraine) have experienced a steep rise in mortality from alcoholic liver diseases and cirrhosis (Zatonski and Jha, 2000; WHO, 2004b; see also diverse contributions on www.hem.waw.pl). This increase in mortality could be associated with the consumption of illegally produced home-made spirits containing hepatotoxic aliphatic alcohols (McKee
et al ., 2005; Szucs et al ., 2005).
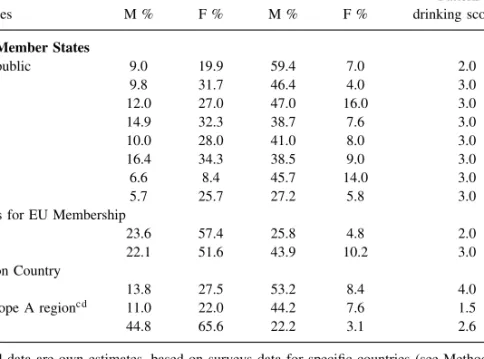
Table 2 presents abstention percentage and volume of alco-hol consumption, as well as drinking patterns for countries in central and eastern Europe, and the world. For both men and women, the lowest proportion of abstainers or very light drinkers was in Czech Republic, and the highest was in countries of candidates for EU membership: Bulgaria and Romania. The proportion of on average heavy drinkers (40+ g/day) among men was the highest in Czech Republic (59.4%) and Russia (53.2%). Among women the highest proportion of heavy drinkers was in Hungary (16%).
The majority of the countries of CEE show a similar detrimental pattern of drinking (pattern 3), with the preferred type of beverages being beer and spirits. Bulgaria and Czech Republic have a less detrimental pattern value of 2, which is similar to the countries of Western Europe. Russia has the most detrimental patterns of drinking of all countries examined (pattern 4).
DISCUSSION
Overall, in the CEE, alcohol is consumed in a way which has been identified as being potentially linked to detrimental consequences (Rehm et al ., 2004; Rehm et al ., in press). • The overall volume of consumption in this region is the
second highest in the world (Rehm et al ., 2003b; WHO, 2004a) only surpassed by countries in Eastern Europe, such as the Moldova Republic, Russia, or Ukraine.
• With few exceptions, the style of drinking can be charac-terized by irregular binge drinking patterns.
• The proportion of unrecorded consumption is relatively high compared to other European countries.
Unrecorded consumption in eastern European countries was predominantly of homemade and more highly concen-trated alcoholic beverages (alcohol content higher 35%). For example, the production of homemade spirits, most commonly samogon, was found to be very popular in many parts of Russia (McKee et al ., 2005), though, in some instances in Russia, the alcohol was of poor quality and was contaminated by toxic components (McKee et al ., 2005; Nuzhnyi, 2004). Samogon contains approximately 39% ethanol and its con-sumption has been linked to considerable liver damage. All examined samples of homemade spirits in Russia contained detectable amounts of 1-propanol, isoamyl alcohol and isobu-tanol, which exceeded the limit set by the Council of Europe (McKee et al ., 2005). Their limit was set at 2.5 mg/100 g and the mean amount of isobutanol found in Russian samogon
was 38.7 mg/100 ml (McKee et al ., 2005). Samogon also contains high amounts of the by-product aliphatic alcohol congeners which has been shown to cause hepatic damage in studies on animals (McKee et al ., 2005). Three important factors of danger associated with homemade spirits produc-tion have been found (McKee et al ., 2005). First, it is cheaper than industrially produced vodka (since homemade spirits are untaxed) and it has a much higher ethanol concentration. Sec-ondly, the by-products of homemade spirits production are toxic, and they have been found to cause organ damage, espe-cially to the liver. Lastly, the samogon must be diluted before consumption due to the high concentration of ethanol, and this process of dilution is difficult for those already intoxi-cated.
One of the limitations of this study was that the data on heavy episodic drinking are not comparable as they stem from different sources with different definitions and, unlike the estimation of average volume of consumption, there is no algorithm as to how to make these data comparable. Moreover, common definitions of heavy episodic drinking rely on thresholds such as 4 or 5 drinks per occasion or per day (Gmel and Rehm, 2004). In countries, where about half of the male population drink 4 or more drinks on a daily basis (see Table 2), such a definition does not make a lot of sense for characterizing high episodic drinking. This is especially true for Czech Republic. Although the proportion of Czech men who drink more than 40 g of pure alcohol per day or per occasion is the highest among all studied coun-tries (Table 2), binge drinking is not as common in Czech Republic as in Russia. For example, Bobak et al . (2004) found that the rates of problem drinking were significantly higher in Russian men than in Czechs or Poles. Yet, Rus-sian men reported a substantially lower mean annual alcohol intake than Czech men, with a low mean drinking frequency in Russia (67 drinking sessions per year in comparison to 179 sessions among Czech men). However, Russian men consumed the highest dose of alcohol per drinking session (means 71 g in Russians, 46 g in Czechs, and 45 g in Poles; Bobak et al ., 2004), and thus, by definition, had the highest prevalence of binge drinking behavior. Consumption rates as high as 90 g of pure alcohol per drinking session with occa-sional peaks of 160 g pure alcohol and higher, were reported in parts of Russia (Bobak et al ., 1999; Malyutina et al ., 2002). Moreover, there were very few drinkers in Russia who drank less than 40 g of alcohol per occasion (Malyutina
et al ., 2002).
Overall, the CEE region and its eastern neighbors can be characterized by a high level of binge drinking compared to other European countries. For instance, in Lithuania, a high proportion of cardiovascular deaths were reported on weekends and on Mondays, which is an indirect indicator for binge drinking on the weekends (Chenet et al ., 2001). Binge drinking is also recognized in Estonia and Latvia (McKee and Britton, 1998). In Ukraine and Russia binge drinking is a norm among men and has been linked to illness and premature death (Charles et al ., 2005; Pridemore and Kim, 2006).
Given these characteristics, it is no surprise that alcohol-attributable burden of disease in CEE, as assessed by the Comparative Risk Assessment (CRA) of WHO (Rehm et al ., 2003a; Rehm et al ., 2004), is also one of the highest in
Table 2. Key indicators for alcohol consumption in CEE in comparison Abstainer or very
light drinker: Heavy drinker: 0− <0.25 g/day 40+ g/daya
Pattern of
Countries M % F % M % F % drinking scoreb
New EU Member States
Czech Republic 9.0 19.9 59.4 7.0 2.0 Estonia 9.8 31.7 46.4 4.0 3.0 Hungary 12.0 27.0 47.0 16.0 3.0 Latvia 14.9 32.3 38.7 7.6 3.0 Lithuania 10.0 28.0 41.0 8.0 3.0 Poland 16.4 34.3 38.5 9.0 3.0 Slovakia 6.6 8.4 45.7 14.0 3.0 Slovenia 5.7 25.7 27.2 5.8 3.0
Candidates for EU Membership
Bulgaria 23.6 57.4 25.8 4.8 2.0
Romania 22.1 51.6 43.9 10.2 3.0
Comparison Country
Russia 13.8 27.5 53.2 8.4 4.0
WHO Europe A regionc d 11.0 22.0 44.2 7.6 1.5
Worldd 44.8 65.6 22.2 3.1 2.6
aPresented data are own estimates, based on surveys data for specific countries (see Methodology section), adjusted for adult per capita consumption. One standard drink equals 10–14 g of pure alcohol, depending on country.
bPattern of drinking (1–4 with 4 being the most detrimental pattern) (Rehm et al ., 2003c). cThe WHO Europe A region consists of the following countries: Andorra, Austria, Belgium, Croatia, Czech Republic, Denmark, Finland, France, Germany, Greece, Iceland, Ireland, Israel, Italy, Luxembourg, Malta, Monaco, Netherlands, Norway, Portugal, San Marino, Slovenia, Spain, Sweden, Switzerland, and United Kingdom.
dOwn calculations (see Rehm et al ., 2006).
the world. However, no detailed data exist as the CRA has categorized the CEE countries in three different regions: countries with the relatively highest economic power are part of Europe A, most of CEE is in Europe B, and countries with relatively lowest economic power are part of Europe C. As all these three WHO regions are made up from other countries as well, details on CEE cannot be ascertained. One of the most pressing tasks, especially with keeping the development of alcohol policy in mind, is to conduct a study on alcohol-attributable burden of disease specifically for the CEE region.
However, some conclusions can be made even now, with-out the knowledge of which specific disease categories are responsible for the high alcohol-attributable burden of disease in CEE. Firstly, the overall level of consumption should be reduced. Secondly, the specific pattern of irreg-ular binge drinking, prevailing in so many countries of the region, should be changed. And thirdly, the proportion of unrecorded consumption should be reduced. This is espe-cially true given the very high liver cirrhosis rates in the southern part of CEE, especially in Hungary, which are sus-pected to be linked with homemade alcohol products (Szucs
et al ., 2005).
As experiences in other parts of the world have shown, effective (Anderson and Baumberg, 2006; Babor et al ., 2003) and cost-effective (Chisholm et al ., 2004) policies exist to achieve the above objectives. However, the recent integration into the EU may not make easy the implementation of some of
these measures such as taxation or alcohol monopolies; some of the most effective measures to reduce alcohol-attributable harm are considered by the EU as impinging on free trade, and thus, are either not allowed, or strongly discouraged. Two solutions seem feasible: First, the EU should reconsider the value of public health, even if in conflict with free trade. Second, politicians in the CEE should implement some of the other known effective alcohol policies. However, it seems clear that some policies should be implemented, because without interventions, the current situation of a high level of principle avoidable alcohol-attributable burden will prevail.
Acknowledgements — The work on this manuscript was conducted within the European Commission Public Health Project: HEM—Closing the Gap— Reducing Premature Mortality. Baseline for Monitoring Health Evo-lution Following Enlargement (grant agreement no 2003121) to the Cancer Center and Institute of Oncology, Cancer Epidemiology and Prevention Divi-sion, Warsaw (Principal Investigator: Witold Zatonski). Paolo Boffetta, John Powles, and J¨urgen Rehm are investigators on this project. Marta Manczuk and Urszula Sulkowska helped in the data gathering and we would like to thank them for their kind assistance. Finally, we would especially like to thank Plamen Dimitrov (Bulgaria), Iveta Pudule (Latvia), Jacek Moskalewicz (Poland) and Tit Albreht (Slovenia) who kindly provided exposure data for their countries. We also thank Dolly Baliunas for her thoughtful comments on earlier version of this manuscript. Funding to pay the Open Access publi-cation charges for this article was provided by the Centre for Addiction and Mental Health, section Public Health.
REFERENCES
Anderson, P. and Baumberg, B. (2006) Alcohol in Europe. Institute of Alcohol Studies, London, England.
Babor, T., Caetano, R., Casswell, S. et al . (2003) Alcohol: No Ordinary Commodity. Research and Public Policy. Oxford University Press, Oxford.
BBC News (2005) Putin Plans Russia Vodka Monopoly. Available from: http://news.bbc.co.uk/2/hi/europe/4645599.stm.
Bobak, M., McKee, M., Rose, R. et al . (1999) Alcohol consumption in a national sample of the Russian population. Addiction 94 (6), 857–866.
Bobak, M., Room, R., Pikhart, H. et al . (2004) Contribution of drinking patterns to differences in rates of alcohol related problems between three urban populations. Journal of Epidemiology and Community Health 58, 238–242.
Brunovskis, A. and Ugland, T. (2002) Alcohol Consumption in the Baltic States: Developments from 1994 to 1999, Fafo-paper, ISSN 0804–5135. Institute for Applied Social Science, Oslo.
Charles, P. M. W., Evelyn, J. B., Semyon, G. et al . (2005) Epidemiology of heavy alcohol use in Ukraine: findings from the world mental health survey. Alcohol and Alcoholism 40 (4), 327–335.
Chenet, L., Britton, A., Kalediene, R. et al . (2001) Daily variations in deaths in Lithuania: the possible contribution of binge drinking. International Journal of Epidemiology 30, 743–748.
Chisholm, D., Rehm, J., Van Ommeren, M. et al . (2004) Reducing the global burden of hazardous alcohol use: a comparative cost-effectiveness analysis. Journal of Studies on Alcohol 65 (6), 782–793.
Ferrer, X. et al . (1995) Phare Multi-Country Programme on Drugs; European Commission. Intersalus and ABS, Barcelona, (cited from WHO, 2004a).
Gmel, G. and Rehm, J. (2004) Measuring alcohol consumption. Contemporary Drug Problems 31, 467–540.
Gmel, G., Rehm, J. and Frick, U. (2001) Methodological approaches to conducting pooled cross-sectional time series analysis: the example of the association between all-cause mortality and per capita alcohol consumption for men in 15 European states. European Addiction Research 7, 128–137.
Gmel, G., Rehm, J. and Kuntsche, E. (2003) Binge drinking in Europe: definitions, epidemiology, and consequences. Sucht
49 (2), 105–116.
Her, M. and Rehm, J. (1998) Alcohol consumption and all-cause mortality in Europe 1982–1990: a pooled cross-section time-series analysis. Addiction 93, 1335–1340.
Hungarian Gallup Institute TGO (2001) National Health Survey 2000: Preliminary Report. Hungarian Gallup Institute, The Gallup Organization, Princeton, NJ.
Iontchev, A. (1998) Central and eastern Europe. In Alcohol and Emerging Markets: Patterns, Problems and Responses, Grant, M. ed., pp. 177–201. Brunner/Mazel, Taylor and Francis, Philadelphia, PA.
Leon, D. A., Chenet, L., Shkolnikov, V. M. et al . (1997) Huge variation in Russian mortality rates 1984–94: artefact, alcohol, or what? Lancet 350 (9075), 383–388.
Malyutina, S., Bobak, M., Kurilovitch, S. et al . (2002) Relation between heavy and binge drinking and all-cause and cardiovascular mortality in Novosibirsk, Russia: a prospective cohort study. The Lancet 360, 1448–1454.
McKee, M. and Britton, A. (1998) The positive relationship between alcohol and heart disease in eastern Europe: potential physiological mechanisms. Journal of the Royal Society of Medicine 91 (8), 402–407.
McKee, M., Pomerlau, J., Robertson, A. et al . (2000) Alcohol consumption in the Baltic Republics. Journal of Epidemiology and Community Health 54, 361–366.
McKee, M., Suzcs, S., Sarvary, A. et al . (2005) The composition of surrogate alcohols consumed in Russia. Alcoholism: Clinical and Experimental Research 29 (10), 1884–1888.
Norstr¨om, T. (2002) Alcohol in Post-war Europe. Consumption, Drinking Patterns, Consequences and Policy Responses in 15 European Countries. National Institute of Public Health, Stockholm.
Norstr¨om, T. (2004) Per capita alcohol consumption and all-cause mortality in Canada, 1950–98. Addiction 99 (10), 1274–1278. Norstr¨om, T. and Ramstedt, M. (2005) Mortality and population
drinking: a review of the literature. Drug Alcohol Review 24 (6), 537–547.
Nuzhnyi, V. (2004) Chemical composition, toxic, and organoleptic properties of noncommercial alcohol samples. In Moonshine Markets: Issues in Unrecorded Alcohol Beverage Production and Consumption, Haworth, A. and Simpson, R. eds, pp. 177–199. Brunner-Routledge, New York.
Pridemore, W. A. and Kim, S. W. (2006) Research note: patterns of alcohol-related mortality in Russia. Journal of Drug Issues 36 (1), 229–248.
Puddey, I. B., Rakic, V., Dimmitt, S. B. et al . (1999) Influence of pattern of drinking on cardiovascular disease and cardiovascular risk factors–a review. Addiction 94, 649–663.
Rehm, J., Monteiro, M., Room, R. et al . (2001.) Steps towards constructing a global comparative risk analysis for alcohol consumption: determining indicators and empirical weights for patterns of drinking, deciding about theoretical minimum, and dealing with different consequences. European Addiction Research 7, 138–147.
Rehm, J., Room, R., Monteiro, M. et al . (2003a) Alcohol as a risk factor for global burden of disease. European Addiction Research
9, 157–164.
Rehm, J., Rehn, N., Room, R. et al . (2003b) The global distribution of average volume of alcohol consumption and patterns of drinking. European Addiction Research 9, 147–156.
Rehm, J., Room, R., Graham, K. et al . (2003c) The relationship of average volume of alcohol consumption and patterns of drinking to burden of disease–an overview. Addiction 98 (10), 1209–1228.
Rehm, J., Sempos, C. and Trevisan, M. (2003d) Average volume of alcohol consumption, patterns of drinking and risk of coronary heart disease–a review. Journal of Cardiovascular Risk 10, 15–20.
Rehm, J., Patra, J., Baliunas, D., Popova, S., Roerecke, M. and Taylor, B. (2006) Alcohol Consumption and the Global Burden of Disease 2002. WHO, Department of Mental Health and Substance Abuse, Management of Substance Abuse (Internal document for the meeting of the WHO Technical Advisory Group on Alcohol Epidemiology at Geneva, Switzerland), Geneva.
Rehm, J., Room, R., Monteiro, M. et al . (2004) Alcohol use. In Comparative Quantification of Health Risks. Global and Regional Burden of Disease Attributable to Selected Major Risk Factors, Ezzati, M., Lopez, A. D., Rodgers, A. and Murray, C. J. L. eds, vol. 1, pp. 959–1109. World Health Organization, Geneva. Rehm, R., Sulkowska, U., Ma´nczuk, M. et al . Alcohol accounts for
a high proportion of premature mortality in central and eastern Europe. The International Journal of Epidemiology, (in press). Reitan, T. C. (2004) On the verge of EU membership: alcohol
cultures in the Baltic Sea region in a European perspective. Contemporary Drug Problems 31, 287–327.
Simpura, J. (2001) Trends in alcohol consumption and drinking pat-terns: sociological and economic explanations and alcohol poli-cies. Nordic Studies on Alcohol and Drugs 18 (English Suppl), 3–13.
Szucs, S., Sarvary, A., McKee, M. et al . (2005) Could the high level of cirrhosis in central and eastern Europe be due partly to the quality of alcohol consumed? An exploratory investigation. Addiction 100 (4), 536–542.
The States Agency for Prevention of Alcohol Related Problems (2002) Alcohol and Society. Attitudes and Behaviours to Alcohol and Alcohol Problems. State Agency for Prevention of Alcohol Related Problems, Warsaw.
United Nations (2005) World Population Prospects. The 2004 Revision [CD-ROM] United Nations Department of Economic and Social Affairs. Population Division, United Nations, New York.
¨
Ust¨un, T. B., Chatterji, S., Mechbal, A. et al . (2003) The world health surveys. In Health Systems Performance Assessment: Debates, Methods, and Empiricism, Murray, C. J. L. and Evans, D. eds, pp. 797–808. World Health Organization, Geneva.
World Health Survey. WHO, (2003) Geneva. Available from http://www.who.int/healthinfo/survey/en/
WHO (2004a) Global Status Report on Alcohol 2004. Department of Mental Health and Substance Abuse, WHO, Geneva. WHO (2004b) WHO/Europe HFA Database. WHO Regional Office
for Europe, Copenhagen.
WHO (2006) Global Alcohol Database (GAD). WHO, Geneva, Available from: http://www3.who.int/whosis/alcohol/alcohol apc data.cfm?path=whosis,alcohol,alcohol apc,alcohol apc data&language=english.
Zatonski, W. A. and Jha, P. (2000) The Health Transformation in Eastern Europe After 1990: A Second Look (ISBN 8391193-5-5). Marie Sklodowska-Curie Memorial Cancer Center and Institute of Oncology, Warsaw.