J~irgen Rehm 1,2,3, Susanne Eschmann 1 Section: international comparison of health determinants
1 Addiction Research Institute, Zurich
2 Centre forAddictions and Mental Health, Toronto
3 Department o f Public Health Sciences, University o f Toronto
I Global monitoring of average volume of alcohol consumption
Summary
Objectives: To estimate the prevalence of different categories of average volume of alcohol consumption for World Health Organization (WHO) regions. To check how the monitored in- dicator of average volume relates to prevalence of alcohol de- pendence. To discuss conclusions for establishing a global mon- itoring system.
Methods: Prevalence of different categories of average volume of alcohol consumption was estimated by a triangulation of survey results, production, and sales figures. The relation be- tween average volume of consumption and prevalence of al- cohol dependence was analysed by regression techniques.
Results: Alcohol consumption varies widely by sex, age, and re- gion. It can predict prevalence of dependence with about 74 % of the variation of the latter explained.
Conclusions: With current data, global monitoring of alcohol is possible. However, more and better surveys are necessary for the future. They should include patterns of drinking to improve prediction of other health outcomes like coronary heart dis- ease (CHD) and accidents.
K e y w o r d s : Alcohol consumption - Prevalence - D e p e n d e n c e - Moni- toring.
In a recent editorial of this journal, Morabia and Abel (2001) underlined the necessity to provide the basis for interna- tional comparisons of health determinants. Their arguments tie in with the current efforts of World Health Organiza- tion (WHO) to establish a global monitoring system of risk factors for chronic disease and to try to comparative- ly evaluate the impact of risk factors (for further informa-
Soz.- Pr~ventivmed. 47 (2002) 4 8 - 5 8 0303-8408/02/010048-11 $1.50 + 0.20/0 9 8irkh~user Verlag, Basel, 2002
tion on the comparative risk analysis - C R A 2000 -, see http://www.ctru.auckland.ac.nz/CRA/main.html). Consump- tion of alcohol is one of the major health determinants (National Institute on Alcohol Abuse and Alcoholism 2000), related in different ways to more than 60 ICD (International Statistical Classification of Diseases and Re- lated Health Problems) categories (see Gutjahr et al. 2001). Alcohol has been included as one of 10 risk factors in the original Global Burden of Disease (GBD) Study (Murray & Lopez 1996; Murray & Lopez 1997) where the beneficial effects had been subtracted from the detrimental effects to come up with a net burden. Using this procedure, the disease burden attributable to alcohol (3.5 % of total dis- ability adjusted life years - DALYs) was estimated higher than the disease burden of tobacco (2.6%) (Murray & Lopez 1997).
Given this impact, it is no surprise that alcohol consumption has been monitored regularly by the World Health Organi- zation (1999). In addition, another UN organization, the Food and Agriculture Organization, and the alcohol in- dustry (e.g., Productschap voor Gedistilleerde Dranken 2000), regularly monitor alcohol production and sales, albeit for different reasons. The purpose of this contribution is to combine these and other data sources to estimate prevalence of different categories of consumption and dependence in different parts of the world. It is based on previous efforts described in detail elsewhere (Rehm & Gruel 2001). Specifically the paper has three main ob- jectives:
- To estimate prevalence of different categories of average volume of alcohol consumption for W H O regions. - To check how the monitored indicator of average volume
related to prevalence of alcohol dependence.
-- To discuss conclusions for establishing a global monitor- ing system.
Rehm J, Eschmann S Global monitoring alcohol
Section: International comParison of health determinants 49
M e t h o d s
Dimensions of alcohol consumption
Alcohol as a risk factor has different dimensions, which are relevant for health. Two main dimensions have been identi- fied as minimally necessary: average volume of consumption and drinking patterns (Rehm et al. 1996; Dawson 2000; Rehm et al. 2001b). Unfortunately, most health surveys con- centrate on average volume only. Thus, population survey information around the world is almost exclusively available for average volume only and patterns of drinking still have to be assessed using other methods (see Rehm et al. 2001b; Gruel et al. 2001). As a result, this paper concentrates on average volume of alcohol consumption.
Classifying average volume of alcohol consumption
Average volume of alcohol consumption, as many other health determinants (e.g., Murray & Lopez 1999) is a continuous variable. However, based on epidemiological tradition, recta-analytical overviews on relationships be- tween average volume and disease outcomes have been using the following categories (Gutjahr et al. 2001; English et al. 1995; Single et al. 1999; Gutjahr & Gruel 2001); for a discussion of origin of these categories see (English et al. 1995; Holman et al. 1996):
- Abstainer: defined as no drink of alcohol within last year - Average volume drinking category I: for females 0 - 19,99 g pure alcohol daily; for males 0-39.99 g pure alco- hol daily
- Average volume drinking category II: for females 2 0 - 39.99 g pure alcohol daily; for males 40-59.99 g pure alcohol daily
- Average volume drinking category III: for females 40 g pure alcohol and above; for males 60 g pure alcohol and above daily. 1
1 For comparison: a 75 cl. bottle of wine contains about 70 gm of pure alcohol.
Note, that in this tradition average volume drinking cate- gories are defined differently by sex. This categorisation of av- erage volume makes it possible to derive different shapes of risk curves (e.g., linear, J-shape, threshold etc.), but at the same time allows inclusion of data from studies that collected only categorical information on levels of alcohol consump- tion.
Data sources for average volume of alcohol consumption Two main sources exist for average volume of alcohol con- sumption: survey data and per capita consumption figures. Per capita and unrecorded consumption data were taken from the Global Status Report on Alcohol (World Health Organization 1999) and from the W H O data bank created by the Marin Institute for the Prevention of Alcohol and Other Drug Problems (California, USA) and currently maintained by the Swiss Institute for the Prevention of Al- cohol and Drug Problems (Lausanne, Switzerland). The term "unrecorded consumption" refers to data that are not reflected in official sales and production of alcohol statistics such as homebrew or illegally produced alcohol. However, such consumption can be estimated either from surveys or indirectly from raw products that can be used to produce al- cohol (Rehm et al. 2001a; R e h m et al. 2001b).
Surveys were also collected from this data bank, but addi- tional surveys were accessed based on individual contacts and by announcing the C R A on a specific W H O listserve (Rehm et al. 2001a). The procedure to decide in cases where there was more than one source of information for surveys andper capita data is described in detail elsewhere (Rehm et al. 2001a). Basically, information was pooled once the crite- ria for quality like representativeness, large sample size, etc. were all fulfilled.
Regions used
The following 14 regions were defined by WHO, based on a clustering of mortality figures (see World Health Organiza- tion 2000b for details).
Region MP* Countries included A f t D
A f t E
A m r A
Algeria, Angola, Benin, Burkina Faso, Cameroon, Cape Verde, Chad, Comoros,
Equatorial Guinea, Gabon, Gambia, Ghana, Guinea, Guinea-Bissau, Liberia, Madagascar, Mall, Mauritania, Mauritius, Niger, Nigeria, Sao Tome and Principe, Senegal, Seychelles, Sierra Leone, Togo
Botswana, Burundi, Central African Republic, Congo, C6te d'Ivoire, Democratic Republic of the Congo, Eritrea, Ethiopia, Kenya, Lesotho, Malawi, Mozambique, Namibia, Rwanda, South Africa, Swaziland, Uganda, United Republic of Tanzania, Zambia, Zimbabwe Canada, Cuba, United States of America
Soz,- Pr~ventivmed. 47 (2002) 48 58 @ Birkh~user Verlag, Basel, 2002
26
50 Section: International comparison of health determinants Rehm J, Eschmann S Global monitoring alcohol
Region Amr
A m r Emr
MP* Countries included N**
B Antigua and Barbuda, Argentina, Bahamas, Barbados, Belize, Brazil, Chile, Colombia, 26
Costa Rica, Dominica, Dominican Republic, E1 Salvador, Grenada, Guyana, Honduras, Jamaica, Mexico, Panama, Paraguay, Saint Kitts and Nevis, Saint Lucia, Saint Vincent and the Grenadines, Suriname, Trinidad and Tobago, Uruguay, Venezuela
D Bolivia, Ecuador, Guatemala, Haiti, Nicaragua, Peru 6
B Bahrain, Cyprus, Iran (Islamic Republic of), Jordan, Kuwait, Lebanon, Libyan Arab Jamahiriya, 13 Oman, Qatar, Saudi Arabia, Syrian Arab Republic, Tunisia, United Arab Emirates
Emr D Afghanistan, Djibouti, Egypt, Iraq, Morocco, Pakistan, Somalia, Sudan, Yemen 9
Eur A Andorra, Austria, Belgium, Croatia, Czech Republic, Denmark, Finland, France, Germany, 26
Greece, Iceland, Ireland, Israel, Italy, Luxembourg, Malta, Monaco, Netherlands, Norway, Portugal, San Marino, Slovenia, Spain, Sweden, Switzerland, United Kingdom
Eur B Albania, Armenia, Azerbaijan, Bosnia and Herzegovina, Bulgaria, Georgia, Kyrgyzstan, Poland, 16 Romania, Slovakia, Tajikistan, The Former Yugoslav Republic of Macedonia, Turkey,
Turkmenistan, Uzbekistan, Yugoslavia
Eur C Belarus, Estonia, Hungary, Kazakhstan, Latvia, Lithuania, Republic of Moldova, Russian 9
Federation, Ukraine
Sear B Indonesia, Sri Lanka, Thailand 3
Sear D Bangladesh, Bhutan, Democratic People's Republic of Korea, India, Maldives, Myanmar, Nepal 7
Wpr A Australia, Brunei Darussalam, Japan, New Zealand, Singapore 5
Wpr B Cambodia, China, Cook Islands, Fiji, Kiribati, Lao People's Democratic Republic, Malaysia, 22 Marshall Islands, Micronesia (Federated States of), Mongolia, Nauru, Niue, Palau, Papua New
Guinea, Philippines, Republic of Korea, Samoa, Solomon Islands, Tonga, Tuvalu, Vanuatu, Viet Nam
191 *" MP stands for pattern of mortality, with the following denotations: A: Very low adult, very low child mortality, B: low adult, low child, C: low child, high adult, D: high adult, high child, E: very high adult, high child.
**: N denotes the number of countries included in the region.
Strategy to triangulate different sources of information on average volume of alcohol consumption
The global burden of disease framework requires a disag- gregated approach that involves estimating the burden sep- arately by sex, age, and regions. Clearly, per capita per se can- not be used at it is not specific for sex and age. On the other hand, survey data is problematic for a number of reasons. First, survey data is globally not available. But even if it were available, it has important limitations due to both subjective tendencies of underreporting and to sampling. As moderate consumption is the norm in many countries, especially in Western established market economies, people often tend to underreport their consumption, e.g., by not including or downsizing heavy consumption occasions. As a result, most surveys there tend to cover only 50%-70% of the sales or production figures (Midanik 1988; Midanik & Harford 1994; Rehm 1998). This is not uniformly so. Interestingly, there are indications that the recent changes in norms in Great Britain resulted in higher coverage rates, although there may be other reasons for this (Leifman 2002). Also, in Soz.- Praventivmed. 47 (2002) 48-58
9 Birkh~user Verlag, BaseL, 2002
countries, where heavy drinking occasions and abstinence are the norm rather than the exception, over-coverage has been reported (e.g. Mexico, see Rehm et al. 2001a). Still these are exceptions and under-coverage is very frequent and thus, in some countries taking surveys as a basis, would result in only half of the consumption being recognised. De- scriptions of alcohol consumption would be grossly underes- timating actual drinking behaviour and the impact of alcohol would be severely underestimated.
At this point, it should be noted that household-based sam- pling strategies also show underestimations of consumption, as groups not covered (e. g., hospitalised, homeless) have on average higher consumption. Thus, to accurately describe actual behaviour, survey data have to be corrected by other sources. And the best and most reliable alternative source of information in this respect are per capita data (see Rehm et al. 2001a, for a discussion on reliability of different forms of per capita data).
Using per capita consumption data from production and sales plus unrecorded consumption as the first estimate of
Rehm J, Eschmann S Global monitoring alcohol
Section: International comparison of health determinants 51
overall alcohol consumption, the following strategy was adopted to generate sex-age-specific prevalence rates for the W H O regions:
- Firstly, for each W H O region the average per capita con- sumption including unrecorded consumption for the pop- ulation 15 and above was estimated as a population- weighted average of country-specific per capita consump- tion data. The weights were derived from the average population over age 15 in each country for all years after 1995 on the basis of U N population data. Country-specif- ic per capita data were estimated for 131 countries. - Secondly, country-specific survey data of the ratio of
male/female consumption were used to proportionally al- locate the overall per capita consumption into male and female per capita consumption. This assumes that there are no country-specific gender biases in reporting within one region. Such an assumption may be problematic for regions with many countries with different cultures, e.g., A f r D with both Moslem and non-Moslem regions. - Thirdly, again based on surveys, the age-specific preva-
lence of drinking was calculated under the assumptions that the average per capita consumption and the propor- tions of male and female abstainers were correct. It should be noted that survey information on abstention was avail- able for 63 countries, including almost all of the countries with populations larger than 100 million. This means that about 50 % of the countries for which data were available on per capita consumption also had available survey data. Range of estimates and uncertainty analysis
Uncertainty analysis is undertaken to give an indication on the variability of the estimated data (for a detailed descrip- tion of procedures see R e h m et al. 2001a). Classically, confi- dence intervals on prevalence are determined by sample size, assuming that the underlying individual data are repre- sentative for the region. However, for some regions we do not have probabilistic samples. As alcohol consumption is a social activity and can vary markedly from one country to another within a region, one cannot automatically assume that the countries without surveys would have the same al- cohol distribution as the countries with surveys. Thus, the procedure based on sample size cannot be used for calculat- ing a range around the point estimates of prevalence. More- over, prevalence was derived both from aggregate (per capita consumption) and from individual level data in a triangulation of information, for which there is no statistical theory to derive confidence intervals.
The algorithms specified below were developed after inten- sive discussions with experts from the field. They are in- tended to reflect the quantity and quality of the underlying Soz.- Praventivmed. 47 (2002) 48-58
9 Birkh~user Verla9, Basel, 2002
data sources (e.g., amount of survey data available, local case studies, knowledge about cultural and legal restrictions including probability of reinforcement of norms). Aggregate level data exist for all countries included. To estimate aver- age volume of alcohol consumption, we propose to base uncertainty analysis on the amount of survey information available in a region. In looking at the range of estimates ob- tained, it should be noted that the procedure allowed for some boundaries even if no survey information existed. For example, with Muslim countries such as Pakistan, the per capita information set clear upper boundaries for the highest drinking categories. Most hypothetical distributions were not possible with the overall volume consumed in this coun- try. These considerations led to the following proposals: Based on the percentage coverage of the population with underlying survey information for each region, different intervals around the point estimate were drawn, ranging from + / - 1 0 % for regions, where more than 75% of the population was covered by surveys, to intervals of +/- 100 % for regions without a survey.
This applies to both sexes, as most surveys include both males and females. We had to correct further based on per capita consumption for regions where certain distributions were not plausible (for region E m r B: maximum range of es- timates for abstainers + l - 15 %; minimum: +/- 1%; for E m r D: maximum range of estimates for abstainers +/- 10%; minimum: +/- 1%; for Sear B: maximum range of estimates for abstainers +/- 10 %; minimum: +/- 1%; for Sear D and W p r B: minimum: +/- 0.2%; for definitions of regions see above). The result can be seen in the A p p e n d i x 1.
Strategy on finding surveys to calculate prevalence of alcohol dependence
In addition to using the W H O database, Medline searches were conducted on surveys on alcohol dependence. All sur- veys were included which measured dependence with a stan- dardised and validated test (e.g., Composite International Diagnostic Interview, Diagnostic Interview Schedule, Alco- hol Use Disorders Identification Test, etc.) using either ICD 10 or D S M criteria (either DSM III, D S M III-R, or DSM IV). This resulted in 180 different data points. The complete list with all citations is available upon request from the author. F o r this paper, lifetime diagnoses were excluded, as the aim was to compare prevalence and average consump- tion at the same time point. To arrive at the figures in Table 1, data were submitted together with estimates on case fatality (Harris & Barraclough 1998) and duration to yield consistent estimates, using the software D I S M O D (http://www.hsph.harvard.edu/organizations/bdu/dismod/ index.htm ).
52 Section: International comparison of health determinants Rehm J, Eschmann S Global monitoring alcohol
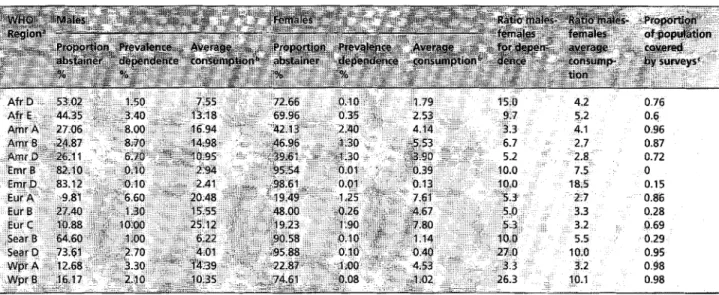
Table 1 Average volume of consumption and prevalence of dependence by sex and WHO region
a Definition of WHO regions, see text. b In g pure alcohol per day.
c If there was a survey with a probability sample in a country, the whole population of this country was seen as covered by surveys. The final proportion was calculated by the population (age 1 5 years and above) covered by surveys, divided by the total population (age 1 5 and above) for the respective region.
Please note that average volume of alcohol consumption and alcohol dependence were derived from non-overlapping datasets with different indicators and thus are statistically in- dependent.
Results
Appendix 1 shows the main results for all W H O regions, separate by sex and age. It is interesting that huge differ- ences in overall drinking persisted for the turn of the centu- ry, even though the general trend over the past decade was an increase in developing nations and a decrease in estab- lished market economies, which leads to a more similar level of average consumption (e. g., World Health Organiza- tion 1999). In addition, there are marked differences in the distribution between the drinking categories.
Also, the ratio in volume of alcohol consumed between males and females varies dramatically. On a country level, there are extremes like China with a ratio of 16:1 (Wei et al. 1999) on the one side (i.e., males consume 16 times more alcohol than females) and 3:1 in established market economies such as E U countries (Simpura & Karlsson 2001). On a regional level there are the same differences with some of the estimates for regions with very low average volume of alcohol consumption being higher than for China (see Tab. 1).
To give a first estimate on how closely the average volume of alcohol consumption is related to one health outcome, the relationship between this variable and prevalence of alcohol dependence was assessed. Both variables co-vary to a con- Soz.- Pr~ventivrned. 47 (2002) 48-58
9 Birkhfiuser Verlag, Basel, 2002
siderable degree (Pearson's r = 0.86). If dependence is pre- dicted from average volume of consumption on the regional level, about 74% of the variation in prevalence of depen- dence can be predicted (see Fig. 1). As can be seen in Figure 1, the American regions tend to have higher than predicted dependence rates, whereas the European regions except Eu- ro C (Russia) have lower than predicted dependence rate for males. For females, few of the regions fall outside the 95 % confidence interval around the linear regression line, with North America (Amr A) being the most notable exception. Thus, if this relationship holds for countries or provinces/ states within countries, monitoring average volume would be helpful in predicting dependence and planning health care facilities for this diagnosis. Aetiologically, dependence is related to heavy and uncontrolled drinking. On the other hand, per capita consumption depends very heavily on heavy drinkers as in most societies. In Switzerland, for instance, 11% of the adults are responsible for 50% of the overall consumption (Schweizerische Fachstelle ft~r Alkohol- und andere Drogenprobleme 1999). In the US, the proportion responsible for half of the consumption is even less, and 20 % of the adults drink about 90 % of the total amount of alcohol consumed (Greenfield & Rogers 1999). To give an example outside of established market eco- nomies: in China, 12.5 % of the drinkers consumed 60 % of all alcohol consumed (Wei et al. 1999). Thus, a strong rela- tionship between average volume of alcohol consumption and prevalence of alcohol dependence was theoretically ex- pected.
Rehm J, Eschmann S Section: International comparison of health determinants 53 GIobal monitoring alcohol
12 10 8 O e- O "O c- O e~ 9 6 O O C -~ 4 e~ t z" J .Eur C j - -A ,.,. Amr B "" AmrA / " j AmrD~, . " .~-~I A . - .- i , ,,.-. Amr;A . " , j " 0-" , - S e a r D / . ' " t / . - ' " 9 .." 6 O , ~ r A
..~" ~.,-~
o
2 4 6 8 10 12 14 16 18 20 22 24 26 average volume of alcohol consumption in g per day" ~ . females 28 ~.~. males
Figure 1 Alcohol dependence by average volume of alcohol consumption
Conclusions
It was shown that there is sufficient information to estimate average volume of alcohol consumption in different cate- gories separate by sex and age for all regions of the world for the late 1990s. However, information became scarce in some regions of the world, notably in Muslim countries in North Africa, the Mid-East and the Far East (see Tab. 1). Also for the former socialist economies of Europe (Eur B), there is not enough recent information. As alcohol consumption is closely related to detrimental health outcomes, it should be monitored globally. Surveys should play an important part of this monitoring, but, as argued before, surveys alone are not enough. Subjective norms and usual sampling techniques lead to marked biases in estimating average con- sumption by surveys alone. As a result the estimates should be cross-validated with sales and production statistics. As production and sales figures are available on a global level, their inclusion in a continuous monitoring of average vol- ume of alcohol consumption seems possible.
The quality of underlying surveys varied, and it would help in the future, if common standards of assessment were es- tablished (Rehm 1998; Dawson & R o o m 2000). In addition, even though average volume of consumption is closely linked to many diseases (Gutjahr et al. 2001; English et al. 1995; Single et al. 1999; Gutjahr & Gmel 2001), the links of this indicator to important other health outcomes are less SOz.- Pr~ventivmed. 47 (2002) 48-58
9 Birkh~user Verlag, Basel, 2002
pronounced. The beneficial effect of alcohol consumption on C H D for example depends on certain patterns of regular and moderate drinking (Puddey et al. 1999), which means that the same amount consumed in different ways results in different outcomes for CHD. The same is true for the large area of injuries, which is responsible for a large proportion of the disease burden attributable to alcohol (e. g., Murray & Lopez 1996; English et al. 1995; Single et al. 1999; Gutjahr & Gmel 2001). Thus, monitoring average volume of alcohol consumption is not enough. As a consequence, surveys in- cluding questions on average volume of alcohol consump- tion only should be enlarged to include measures for pat- terns of drinking, especially heavy drinking occasions. If questions on average volume and heavy drinking occasions were to be established as a minimal standard for assessing alcohol in health surveys, future monitoring of this health determinant could be even more helpful in shaping health policy (see World Health Organization 2000 a for a more thorough discussion on alcohol monitoring).
Acknowledgements
The WHO, the Swiss Federal Office of Public Health (con- tract # 00.001588), the Addiction Research Institute in Zurich, Switzerland, and the Centre for Addiction and Mental Health in Toronto, Canada, financially supported this study.
54 Section: International comparison of health determinants Rehm J, Fschmann S Global monitoring alcohol
Zusammenfassung
Globales Monitoring des durchschnittlichen Alkoholkonsums Fragestellung: Sch~tzung der Pr&valenz verschiedener Kate- gorien des Durchschnittskonsums von Alkohol fQr die Region nach Definition der Weltgesundheitsorganisation (WHO). Er- mittlung der Beziehung zwischen Durchschnittskonsum und der Pr~valenz von Alkoholabh~ngigkeit. Diskussion yon Im- plikationen fQr ein globales Monitoringsystem.
Methoden: Die Pr~valenz des Durchschnittskonsums von Alko- hol wurde mittels der Triangulation yon Survey-Daten, Produk- tions- und Verkaufszahlen gesch~tzt. Die Beziehung zwischen Durchschnittskonsum und Alkoholabh~ngigkeit wurde durch Regressionstechniken ermittelt.
Ergebnisse: Durchschnittlicher Alkoholkonsum variiert welt- weit nach Geschlecht, Alter und Region. Der Durchschnittskon- sum kann die Pr~valenz yon Alkoholabh~ngigkeit gut vorher- sagen mit 74% erkl~rter Varianz.
Schlussfolgerungen: Die derzeitigen Daten erlauben ein glo- bales Monitoring des durchschnittlichen Alkoholkonsums. Den- noch sind for die Zukunft mehr und bessere Surveys notwendig. Diese Surveys sollten auch Trinkmuster mit einschliessen, um auch andere Gesundheitsindikatoren als Abh~ngigkeit wie koronare Herzkrankheiten oder Unf~lle besser vorhersagen zu k6nnen.
R 6 s u m 6
Monitoring global de consommation moyenne d'alcool Objectifs: Estimer la pr6valence de diff6rentes categories de volume moyen de consommation d'alcool dans les r6gions de I'Organisation Mondiale de la Sant6 (OMS). Examiner si les in- dicateurs de monitoring du volume moyen sont corr616s ~ la pr6valence de la d6pendance ~ I'alcool. Discuter les implica- tions pour un syst~me de monitoring global.
M6thodes: La pr6valence de diff6rentes cat6gories de volume moyen de consommation d'alcool a 6t6 estim6e & partir de donn6es provenant d'enqu~tes et de statistiques de produc- tion et de vente. La relation entre le volume moyen de con- sommation et la pr6valence de la d6pendance ~ I'alcool a 6t~ analys6e par des techniques de r6gression lin6aire.
R6sultats: La consommation de I'alcool varie selon le sexe, I'~ge et la r6gion. La consommation peut pr6dire la pr6valence de d6pendance pour environ 74 % de la variance expliquee, Conclusions: Un syst6me de monitoring global de la consom- mation moyenne d'alcool est possible avec les donn6es courantes. Pourtant, de nouvelles enqu~tes sont n6cessaires. Elles doivent inclure des profils de consommation pour am61iorer la pr6diction d'autres indicateurs de sant6, comme par exemple I'infarctus du myocarde et les accidents.
I References
Dawson D (2000). Measuring alcohol consump-
tion. J Subst Abuse; 12 (special issue) 1-212.
Dawson D, Room R (2000). Towards agreement
on ways to measure and report drinking patterns
and alcohol-related problems in adult general
population surveys: the Skarp6 Conference overview. J Subst Abuse 12 (special issue): 1-21.
English D, Holman D, Milne E, et al. (1992).
The quantification of drug caused morbidity and mortality in Australia. Canberra: Commonwealth Department of Human Services, 1995.
Gmel G, Rehm J, Frick U (2001). Methodologi-
cal approaches to conducting pooled cross-sec- tional time series analysis: the example of the E U states. Eur Addict Res 7: 128-37.
Greenfield TK, Rogers JD (1999). Who drinks
most of the alcohol in the US: the policy implica- tions. J Stud Alcohol 60: 78-89.
Soz.- Pr~ventivmed. 47 (2002) 48-58 @ Birkh~user Verlag, Basel, 2002
Gutjahr E, Gmel G (2001). Die sozialen Kosten
des Alkoholkonsums in der Schweiz: epidemiologisehe Grundlagen 1995-1995.
Lausanne: Schweizerische Fachstelle ftir
Alkohol- und audere Drogenprobleme (SFA). (Report; Nr. 36).
Gutjahr E, Gruel G, Rehm J (2001). The relation
between average alcohol consumption and dis- ease: an overview. Eur Addict Res 7: 117-27.
Harris EC, Barraclough B (1998). Excess mortal-
ity of mental disorder. Br J Psychiatry 173:
11-53.
Holman C, English D, Milne E, Winter M (1996).
Meta-analysis of alcohol and all-cause mortality: a validation of N H M R C recommendations. Med J Aust 164: 141-45.
Leifman H (2002). Validity problems in alcohol
surveys with special emphasis on the compara- tive six-country ECAS survey. Coutemp Drug Prob (in press).
Midanik L (1988). Validity of self-reported alco-
hol use: a literature review and assessment. Br J Addict 83: 1019-29.
Midanik L, Harford T (1994). Overview of alco-
hol consumption measurement papers. Addic- tion 89: 393-4.
Morabia A, Abel T (2001). International com-
parison of health determinants. Soz. Praven- tivmed 46: 5.
Murray C, Lopez A (1996). Quantifying the bur-
den of diseas and injury attributable to ten major risk factors. In: Murray C, Lopez A, eds. The global burden of disease: a comprehensive as- sessment of mortality and disability from dis- eases, injuries and risk factors in 1990 and pro- jected to 2020. Boston: Harvard School of Public Health on behalf of the World Health Organiza- tion and the World Bank: 295-324.
Murray C, Lopez A (1997). Global morality,
disability, and the contribution of risk factors: global burden of disease study. Lancet 349:
Rehm J, Eschmann S GIobal monitoring a{coho{
Section: International comparison of health determinants 55
Murray C, Lopez A (1999). On the comparable
quantification of health risks: lessons from the Global Burden of Disease Study. Epidemiology
10: 594~505.
National Institute on Alcohol Abuse and Alcoholism (2000). ]0th special report to the U.S. Congress on alcohol and health. Washington, DC: U.S. Department of Health and Human Services.
Productschap voor Gedistilleerde Dranken (2000). World drink trends, 2000: international beverage consumption and production trends. Schiedam: NTC.
Puddey 1, Rakic V, Dimmitt S, Beilin L (1999).
Influence of pattern of drinking on cardiovascu- lar disease and cardiovascular risk factors: a re- view. Addiction 94: 649-63.
Rehm J (1998). Measuring quantity, frequency
and volume of drinking. Alcohol Clin Exp Res
22: 4S-14S.
Rehm J, Ashley M, Room R, et aI. (1996). Drink-
ing patterns and their consequences: report from an international meeting. Addiction 91: 1615-21.
Rehm J, Gmel G (2001). Alcohol, illicit drugs
and the global burden of disease. Eur Addict Res 12 (special issue): 95-157.
Rehm J, Gruel G, Room R, et al. (2001a). Alcohol
as a risk factor for burden of disease. Geneva: WHO.
Rehm J, Monteiro M, Room R, et al. (2001b).
Steps towards constructing a global comparative risk analysis for alcohol consumption: determin- ing indicators and empirical weights for patterns of drinking, deciding about theoretical minimum, and dealing with different consequences. Eur Addict Res 7 (3, special issue): 138-47.
Schweizerische Fachstelle ffir Alkohol- und andere Drogenprobleme (1999). Zahlen und Fakten zu Alkohol nnd anderen Drogen. Lausanne: SFA.
Simpura J, Karlsson T (2001). Trends in drinking
patterns among adult population in 15 European countries, 1950 to 2000: a review. Nordic Stud Alcohol Drugs 18 (English suppl.): 31-53,
Single E, Robson L, Rehm J, Xie X (1999).
Morbidity and mortality attributable to alcohol, tobacco, and illicit drug use in Canada. Am J Public Health 89: 385-90.
Wei H, Derson Y, Shuiyuan X, Lingjiang L, Yalin
Z (1999). Alcohol consumption and alcohol-relat- ed problems: Chinese experience from six area samples, 1994. Addiction;94: 1467-76.
World Health Organization (1999). Global status report on alcohol. Geneva: WHO.
World Health Organization (2000a). Interna- tional guide for monitoring alcohol consumption and related harm. Geneva: WHO, Department of Mental Health and Substance Dependence.
World Health Organization (2000b). The World Health Report 2000: health systems: improving performance. Geneva: WHO.
Address for correspondence
Prof. Dr. Jiirgen Relun Addiction Research Institute Konradstrasse 32 P.O. Box CH-g031 Zurich e-mail: [email protected] or [email protected] 5oz.- Pr~ventJvmed. 47 (2002)48-58 9 Birkh~user Veriag, Basel, 2002
56 S e c t i o n : International comparison of health determinants Rehm J, Eschmann S Global monitoring alcohol
Appendix 1 Prevalence of different categories f o r average volume of alcohol consumption in WHO regions b
fr! 0.9% 0,0% 37.1% 9.3% 11.6% ,2,9% 3.3% 08% 72.0% 18.0% 3.5% 0.9% , 1.2% 0.3% 3~'!4~ 3.7% 52,1% 5.2% 9.8% I 0% 0.7% 0.1% cr 14.9% 1.5% : ' % .75.0 ~ 7.5Vo 3.6% 0.4% ,, 6.5% 0.6% 43.8% 4.4% ; ~59.1% 14,8% ' 3 . 5 % 0 . 9 % 9 1 t . 0 % 1 ' t . 0 % !,0.4% 1.0% ' 0 . 1 % 1 . 0 % ~!~ ~0.0% , 1,0% 8 9 : 7 % 10.0% 1,0.1% 5~1% " " 0.0% 1 . 0 % .... 160:o% l O . O % 0,0% 1.0%
!,.:;~
0.0% I.o% 0.0% L o % 6.2% 61.6% 6,2% 3.6% 35.7% 3.6% 0.2% 2.0% 0.2% 0.1% 0.7% 0.1% 8.0% 79.6% 8.0% 1.9% 18.7% 1.9% 0.1% 1.5% 0.1% 0.2% 0,0% 0.2% 0.0% 53.3% 13,3% 53.3% 13,3% 35,7% 8.9% 35.7% 8.9% 8,2% 2.0% 8.2% 2,0% 2.9% 0.7% 2.9% 0.7% 77,1% 19.3% 77.1% 19.3% 18.9% 4.7% 18,9% 4.7% 3.4% 0.9% 3.4% 0.9% 0,6% 0.1% 0.6% 0.1% 43.2% 4 , 3 % 43.2% 4.3% 49.6% 5.0% 49.6% 5.0% 6.6% 0.7% 6.6% 0.7% 0,7% 0.1% 0.7% 0.1% 63.3% 6.3% 63,3% 6.3% 32.5% 3.3% 32.5% 3.3% 3.4% 0.3% 3.4% 0.3% 0.7% 0.1% 0.7% 0.1% 29.8% 3.0% 29.8% 3.0% 62.6% 6.3% 62.6% 6,3% 4,8% 0.5% 4.8% 0,5% 2.8% 0.3% 2.8% 0.3% 43.8% 4.4% 43.8% 4.4% 50.1% 5,0% 50.1% 5.0% 3,9% 0.4% 3.9% 0.4% 2.2% 0.2% 2.2% 0.2% 30.3% 7.6% 30.3% 7.6% 64,6% 16.1% 64.6% 16.1% 4,7% 1.2% 4,7% 1,2% 0.4% 0.1% 0~4% 0.1% 36,8% 9.2% 36.8% 9.2% 58,4% 14.6% 58.4% 14.6% 4.4% 1.1% 4.4% 1,1% 0,4% 0.1% 0.4% 0,1% 97.4% 15.0% 97.4% 15.0% 2.6% 2.6% 2.6% 2,6% 0.0% 1.0% 0,0% 1,0% 0.0% 1.0% 0.0% 1.0% 100.0% 15.0% 100.0% 15.0% 0.0% 1.0% 0.0% 1.0% 0,0% 1.0% 0.0% 1.0% 0,0% 1.0% 0.0% 1.0% 98.7% 10.0% 98.7% 10.0% 1.3% 1.0% 1.3% 1.0% 0.0% 1.0% 0.0% 1.0% 0.0% 1.0% 0.0% 1.0% 100.0% 10.0% 100.0% 10.0% 0.0% 1.0% 0.0% 1.0% 0.0% 1.0% 0.0% 1,0% 0.0% 1.0% 0.0% 1,0% Soz.- Pr~ventJvmed. 47 (2002) 48-58 9 B[rkh~user Vedag, Basal, 2002Rehm J, Eschmann S Global monitoring alcohol
Section: International comparison of health determinants 57
Appendix 1 (continued) 07% 9.3% 0,9% 7.5% ~ . 9 % 6.9% 0 , 9 % 1 0 , 2 % 1.0% 0,9% 1 1 . 7 % 1.2% 1,4% 1 7 , 3 % 1.7% 7.2% 6 6 . 0 % 6.6% 1.0% 1 2 . 5 % 1.3% 0.3% 4.2% 0.4% 7.0% 28,2% 7.0% 1r 60.2% 15.0% 1,6% 5,8% 1.5% 1,9% 5.8% 1.5% 11.5% 5 1 , 0 % 12.8% 11.2% 41.3% 10.3% 1.8% 5.5% 1.4% 0.6% 2.2% 0.5% 8.7% 2 , 2 % 1 0 , 9 % 2.7% 61.7% 1 5 . 4 % 5 3 . 0 % 13.3% 19.4% 4,8% 2 2 . 5 % 5.6% 10,2% 2.5% 1 3 . 5 % 3.4% 140% 3 , 5 % 1 7 . 5 % 4.4% 702% 1 7 . 6 % 6 3 . 3 % 15.8% 13.6% 3 . 4 % 1 6 . 5 % 4.1% 2.2% 0.5% 2,7% 0.7% 56.0% 1 0 . 0 % 7 0 , 0 % 10.0% 35,9% 1 7 , 9 % 2 8 , 8 % 14.4% 6.5% 3.2% 0.8% 1.0% 1.6% 1.0% 0.4% 1.0% 91.4% 1 0 . 0 % 9 1 . 4 % 10.0% 5.4% 3.2% 6.4% 3.2% 2.2% 1.1% 2.2% 1.1% ~.0% 1.0% 0.0% 1.0% 3.7% 6 . 4 % 7 9 . 6 % 8,0% 3.8% 3.4% 2 0 . 1 % 2.0% 2,0% 02% 0,2% 0.2% ~5% 0.2% 0.1% 0.2% 5.8% 9.7% 96.8% 9.7% 2.8% 0.3% 2.8% 0.3% 0.4% 0.2% OA% 0.2% 0.0% 0.2% 0.0% 0.2% 13,9% 1 . 4 % 1 8 . 6 % 1 , 9 % 1 8 . 6 % 1,9% 71.4% 7.1% 7 1 . 1 % 7.1% 7 1 . 1 % 7.1% 7.3% 0.7% 4.4% 0.4% 4.4% 0.4% 7.3% 0.7% 5.9% 0.6% 5.9% 0,6% 25.9% 2 . 6 % 3 4 . 6 % 3 . 5 % ~ . 6 % 3,5% ~ , 4 % 6.3% 5 7 . 0 % 5.7% ~ . 0 % 5.7% 8,6% 09% 6,6% 0.7% 6.6% 0.7% 2.1% 0.2% 1.8% 0.2% 1.8% 0.2% 32.9% 8.2% 3 7 . 6 % 9.4% 37.6% 9.4% ~.0% t4.5% 5 5 . 9 % 1~0% 5 5 . 9 % 14.0% 4.6% 1,1% 2.6% 0.7% 2.6% 0.7% 4.6% 1.1% 3.9% 1.0% 3.9% 1.0% 61.2% 1 5 . 3 % 61.2% 1 5 . 3 % 6 1 . 2 % 15.3% 32.8% 8.2% 3 3 . 9 % 8.5% 3 3 . 9 % 8.5% 4.9% 1.2% 3.8% 1.0% 3.8% t.0% 1.1% 03% 1.1% 0.3% 1.1% 0.3% 16.4% 4,1% 21.8% 5,5% 2 1 . 8 % 5,5% 59.2% 1 4 , 8 % 6 2 , 0 % 1 5 , 5 % 6 2 . 0 % 15,5% 16.0% 4.0% 9.5% 2.4% 9.5% 2.4% 8.4% 2.1% 6.7% 1.7% 6.7% 1.7% 26.2% 6 , 6 % 35.0% 8 . 7 % 3 5 . 0 % 8.7% 61.2% 1 5 , 3 % 55~2% 1 3 . 8 % 5 5 . 2 % 13.8% 11.2% 2.8% ~6% 2.2% 8.6% 2.2% 1.4% 0.4% 1.2% 0.3% 1.2% 0.3% 84.0% 1 0 . 0 % 9 8 . 0 % 100% 9 8 . 0 % 10.0% 15.2% 7.6% 1.8% 1.0% 1.8% 1.0% 0.6% 1.0% 0.1% 1,0% 0.1% 1.0% 0.2% 1.0% 0,0% 1.0% 0,0% 1.0% ~ . 3 % 1 0 . 0 % 9 5 . 2 % I0.0% 9 5 . 2 % 100% 4.5% 2,2% 4.8% 2.4% 4,8% 2,4% 1.2% 1.0% 0.0% 1.0% 0.0% 1.0% 0.0% 1.0% 0.0% 1=0% 0.0% 1.0% 95.6% 9 . 6 % 100,0% 10.0% 100.0% 10.0% 4,4% 0.4% 0~% 0.2% ~0% 0.2% 0.1% 0.2% 0.0% 02% 0.0% 0.2% 0.0% 0,2% 0,0% 0,2% 0.0% 0.2% 99,8% 1 0 . 0 % 100.0% 10.0% 1~,0% 100% 02% 0.2% 0.0% 0.2% 0.0% 0-2% 0,0% 0,2% 0,0% 0.2% 0.0% 0,2% 0.0% 0.2% 0.0% 0,2% 0,0% 0.2% 5oz.- Pr~ventivmed 47 (2002) 48-58 9 Birkh~user Verlag, Basel, 2002
58 Section: International comparison of health determinants Rehm J, Eschmann S Global monitoring alcohol
A p p e n d i x 1 (continued)
a Definition o f WHO regions, see text.
b For explanation of drinking categories and calculation o f ranges o f estimates, see text.
Soz.- Pr~ventivmed. 47 (2002) 48-58 9 8irkh~user Verlag, Basel, 2002