HAL Id: hal-00304710
https://hal.archives-ouvertes.fr/hal-00304710
Submitted on 1 Jan 2002HAL is a multi-disciplinary open access archive for the deposit and dissemination of sci-entific research documents, whether they are pub-lished or not. The documents may come from teaching and research institutions in France or abroad, or from public or private research centers.
L’archive ouverte pluridisciplinaire HAL, est destinée au dépôt et à la diffusion de documents scientifiques de niveau recherche, publiés ou non, émanant des établissements d’enseignement et de recherche français ou étrangers, des laboratoires publics ou privés.
stream: 1. Nitrate 2. Ammonium
A. Butturini, F. Sabater
To cite this version:
A. Butturini, F. Sabater. Nitrogen concentrations in a small Mediterranean stream: 1. Nitrate 2. Ammonium. Hydrology and Earth System Sciences Discussions, European Geosciences Union, 2002, 6 (3), pp.539-550. �hal-00304710�
Nitrogen concentrations in a small Mediterranean stream:
1. Nitrate 2. Ammonium
Andrea Butturini
and Francesc Sabater
Department of Ecology, University of Barcelona, Avgda. Diagonal, 645, 08028 Barcelona, Spain. Email for corresponding author: [email protected]
Abstract
The importance of storm frequency as well as the groundwater and hyporheic inputs on nitrate (NO3-N) and ammonium (NH4-N) levels in stream water were studied in a small perennial Mediterranean catchment, Riera Major, in northeast Spain. NO3-N concentrations ranged from 0.15 to 1.9 mg l-1. Discharge explained 47% of the annual NO
3-N concentration variance, but this percentage increased to 97% when single
floods were analysed. The rate of change in nitrate concentration with respect to flow, ∆NO3-N/∆Q, ranged widely from 0 to 20 µg NO3-N
s l-2. The ∆NO
3-N/∆Q values fitted to a non linear model with respect to the storm flow magnitude (∆Q) ( r2=0.48, d.f.=22, P<0.01) . High
values of ∆NO3-N/∆Q occurred at intermediate ∆Q values, whereas low ∆NO3-N/∆Q values occurred during severe storms (∆Q> 400 l s-1).
NO3-N concentrations exhibit anticlockwise hysteresis patterns with changing flow and the patterns observed for autumnal and winter storms indicated that groundwater was the main NO3-N source for stream and hyporheic water. At baseflow, NO3-N concentration in groundwater was higher (t=4.75, d.f.=29, P>0.001) and co-varied with concentrations in the stream (r=0.91, d.f.=28, P<0.001). In contrast, NO3-N concentration in hyporheic water was identical to that in stream water. The role of the hyporheic zone as source or sink for ammonium was studied hyporheic was studied comparing its concentrations in stream and hyporheic zone before and after a major storm occurred in October 1994 that removed particulate organic matter stored in sediments. Results showed high ammonium concentrations (75±28 s.d. µg NH4-N l-1)
before the storm flow in the hyporheic zone. After the storm, the ammonium concentration in the hyporheic dropped by 80% (13.6±8 µg NH4
-N l-1) and approached to the level found in stream water (11±8 µg NH
4-N l-1) indicating that indisturbed hyporheic sediments act as a source
for ammonium. After the storm, the ammonium concentrations in the stream, hyporheic and groundwater zones were very similar suggesting that stream ammonium concentrations are sustained mainly by input from groundwater. The present study provides evidence that storm flow magnitude is an important source of variability of nitrate concentration and fluxes in Mediterranean streams subjected to an irregular precipitation regime with prolonged dry periods.
Keywords: nitrate, discharge regime, hyporheic zone, groundwater, Mediterranean, stream, Riera Major
Introduction
Studies on nutrient dynamics in catchments point out that terrestrial processes are the major factors controlling the supply and availability of nutrients in a stream (Likens et al. 1977, Meyer et al. 1988). The factors involved relate to catchment lithology, hydrology, topography, soil and vegetation processes, atmospheric deposition, and the direct and indirect effects of human activity such as land-use practices, point and diffuse pollution, and changing atmospheric deposition.
Nitrogen is probably the nutrient most studied in element cycling ecology because it is considered one of the most important element limiting vegetation growth (Ågren and Bosatta 1996). Nitrogen retention, transformation and loads in drainage waters are important for the management of
streams and their basins. Nitrate is the most abundant and mobile form of nitrogen within stream waters (Schlesinger 1997) and its concentration in many areas has increased in recent years (Mayewski et a1., 1990, Whelan et al., 1995). Stream nitrate concentration often varies according to the season. The most common pattern in forested catchments show low nitrate concentration during the growing season, and high nitrate during the dormant season: nitrate is leached when the forest soil temperature, and transpiration rate are low and vegetation uptake is at its lowest (Vitousek 1977, Foster et al., 1989, Sloan et al., 1994, Evans et al., 1996, Ruiz et al., 2002). However, in-stream uptake and release processes can induce an opposite seasonal pattern of nitrate (Mulholland 1992, Mulholland and Hill 1997).
The study of solute behaviour during storms provides useful information on water flow paths and solute sources within catchment (Evans and Davies 1998). The behaviour of nitrate concentrations during storms appears to be variable. Depending on the nitrogen availability in the catchment, during storms nitrate concentration increases (i.e. flushing, McDowell and Wood 1984, Grimm and Fisher 1986), decreases (i.e. dilution, Lewis and Grant 1979), or stays relatively constant (Mulholland et al., 1990, Hill 1993, Creed et al., 1996). Most studies focused on nitrate-discharge relationship are based on individual or a series of short sequence storm events. One possible explanation is that most of these studies are focused on humid and temperate streams characterized by high annual rainfall distributed evenly throughout the year (Mulholland and Hill 1997), or influenced by a strong hydrological event such as the snowmelt period (Creed and Band 1998). However, little attention has focused on the variability of the nitrate-discharge relationship under a wide spectrum of hydrological conditions even though factors such as rain intensity and antecedent hydrological conditions can induce complex patterns of nitrate during storm (Avila et al., 1992; Biron et al., 1999).
This paper examines the temporal dynamics of nitrate (NO3-N) and ammonium (NH4-N) for a stream subjected to a Mediterranean discharge regime. Stream nitrate dynamics is examined with respect to season, storm intensity and the relative duration of inter-storm periods (i.e. baseflow conditions). The nitrate response variability during storms is examined and linked to the magnitude of the hydrologic changes and the duration of antecedent inter-storm period. The comparison of NO3-N concentration in stream, hyporheic and groundwater is used to evaluate the contribution of the different nitrate inputs from the catchment and role of in-stream processes on the nitrate concentration and export in stream water. Ammonium dynamics is examined with the objective to detect whether the stream acts as source of or a sink for ammonium. For this purpose, the ammonium concentrations in stream and hyporheic water as well as organic matter content in sediments, were compared before and after a major storm of October 1994. The study provides an important “endmember” case for examining and modelling nitrogen dynamics at a European and broader scale level (Wade et al., 2002).
Study site
Riera Major is a second-order stream located on the north side of the Montseny Mountains (NE Spain, latitude 41º55´, longitude 2027´) 90 km north of Barcelona. The stream is
6 km long and drains a forested 15.5 km2 siliceous area dominated by granodiorite. Climate is typically humid-Mediterranean (Piñol et al., 1992). The stream water exhibits summer maximum temperatures of 17 to 25ºC and winter minimum temperatures of 2º to 5ºC (Fig. 1a). Annual precipitation ranges widely. For example, during the present study, the annual rainfall varied between 855 mm in 1994 and 1660 mm in 1996. Alders (Alnus glutinosa) dominate the riparian vegetation and leaf fall is concentrated into a short period (20–30 days) in October when the particulate organic matter transported in the stream can increase by up to 8–10 mg l-1 (Romaní et al., 1998). The stream channel is ~2.5 m wide and is characterised by step-pools with large pebbles and boulders. The total area of the streambed is approximately 15 000 m2: sand-sized sediments cover ~30% of the streambed. The hyporheic zone is composed mainly of mobile sand and ranges in depth from a few centimetres to 80–100 cm. Conservative trace experiments showed that the hyporheic water residence time ranged from 0.3 h at 10 cm depth, to 1–2 h at 25 cm depth and the relative contribution of stream water to the total hyporheic water ranged from 35% at 25 cm depth during basal discharege conditions to 100% at high discharges and shallow sediments (Butturini and Sabater, 1999).
Q ( l s -1 ) a j a o d f a j a n j m m j s n j m m j s n j m 1994 1995 1996 1997 1998 o Time 0 1 2 3 N O3 -N ( m g l -1) 0 500 1000 1500 2000 25 20 15 10 5 0 T (o C )
b
a
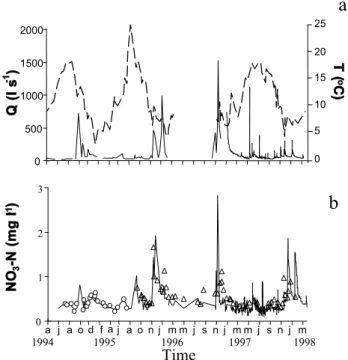
Fig. 1. Seasonal variation of discharge and water temperature
(panel a), nitrate (panel b) in stream water (solid line), in hyporheic water (open circles) and in groundwater (open triangles). Mean values from NO3-N from hyporheic waters were calculated from eight samples. Mean values of NO3-N in surface and groundwater were calculated from 3–6 samples.
At stream baseflow, the electrical conductivity in surface, hyporheic and groundwater averages 206±22, 219±32 and 237±8 µS cm–1, respectively (Butturini, 1999). Conductivities in surface and hyporheic waters are inversely correlated to discharge, whereas in groundwater conductivity is steadier and decreases only during intense storms (Butturini and Sabater, 2000).
Stream flow is perennial, and baseflow discharge fluctuates from 30 l s–1 (summer) to 62 l s–1 (autumn and winter). During storms, discharges increase to as much as 1600 l s–1 (December 1996, Fig. 1a).
Material and methods
FIELD METHODOLOGY
Stream water (NO3-NS) was sampled every 7–14 days from May 1994 to March 1996. From February 1997 to April 1998, stream water samples were collected daily at 12:00 with an automatic sampler (Sigma 900 Max). From October 1997 to January 1998, storms were also sampled on an intensive basis (0.5–2 hours sampling frequency). Nitrate in hyporheic and groundwater was sampled from July 1994 to March 1995, and from August 1995 to February 1998 respectively.
Ammonium in the stream and hyporheic zone was collected from April 1994 to March 1996 and groundwater samples from August 1995. Samples of particulate organic matter stored in stream sediments expressed on ash free dry weight (POMH, mg AFDW g–1) were collected at a depth of 7–10 cm from six cores in a stretch of the stream where leaf accumulation occurred.
Samples of hyporheic waters were collected from eight wells (PVC pipes of 4 mm diameter) placed in the sediment to sample at 10 cm and 50 cm depths in the middle of the stream channel. From hyporheic wells, small amounts (30 ml) of water were sampled to avoid entraining surface water. Samples of groundwater were collected from a permanent spring located on the bank side of the riparian zone.
Stream discharge was measured at each sampling date by mass balance calculation using short-term chloride injections (Stream Solute Workshop, 1990). After February 1997 a pressure transducer connected to the automatic sampler recorded the water level of the stream continuously. The discharge was then estimated by using an empirical relationship between the discharge measured by the conservative tracer and the water level (Butturini, 1999).
CHEMICAL ANALYSIS
All water samples were filtered through pre-ashed fibreglass filters (Whatman GF/F), cold-stored and analysed for nitrate within 18 h of sample collection. Nitrate was analysed by Capillary Electrophoresis (Waters, CIA-Quanta 5000, Romano and Krol, 1993).
Ammonium was analysed using the indophenol-blue colorimetric method (Solorzano, 1969).
DATA ANALYSIS
NO3-N stream fluxes. NO3-Nstream exports were calculated at baseflow and storm conditions, for the growing (April– September 1997) and dormant (October 1997–March 1998) periods. NO3-N fluxes were calculated in two different ways depending on the hydrological conditions. During baseflow periods, daily NO3-N fluxes were calculated by multiplying average daily discharges by NO3-N instantaneous concentrations. During storm flows, when Dischargepeak/ Dischargepre-storm>1.5, NO3-N fluxes were estimated adding the products of the instantaneous discharge by the instantaneous nitrate concentration. Continuous NO3-N concentrations were estimated by linear interpolation of the measured NO3-N concentrations (Hinton et al., 1997). The end of each storm period was determined when the rate of the discharge decrease was lower that 10% d–1. Volume-weighted stream water NO3-N concentrations (the ratio between NO3-N export and water export) were calculated during inter-storm conditions to detect a seasonal concentration tendency without the discharge influence. Stream NO3-N concentration - discharge relationships. The variance (r2, %) of the relationship discharge v. NO
3-N
concentration was studied by fitting the data into a linear model on both an annual (r2
year), and an individual storm (r2
storm) basis. The NO3-N changes during storms were also
studied by examining the stream NO3-N concentration change with respect to stream discharge change (∆NO3-N/ ∆Q). The variability of ∆DNO3-N/∆Q was analysed with respect to the duration of the antecedent inter-storm periods (∆t-1) and the magnitude of the storms (∆Q).
To assess the role of the rapid runoff and groundwater as nitrate sources during storm flows, the NO3-N hysteresis was compared with those of DOC for the storm-sampling period from October 1997 to January 1998. The comparison was performed by converting the observed DOC data into “expected” nitrate data (Nexp); it was assumed therefore that nitrate dynamics followed the same temporal pattern of DOC. The DOC data were converted into NO3-Nexp at each time step using the following formula:
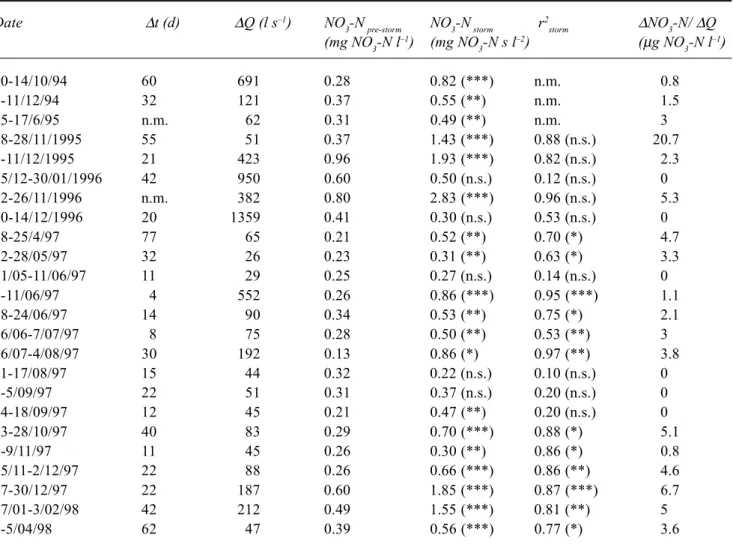
Table 1. Summary of the antecedent inter-storm length (∆t-1), storm magnitude (∆Q), stream NO3-N concentration before
(NO3-N pre storm) and during the storm flow (NO3-N storm), the explained variance of individual storm (r2
storm), and the
∆NO3-N/∆Q values measured during the entire study period.
Date ∆t (d) ∆Q (l s–1) NO
3-N pre-storm NO3-N storm r2storm ∆NO3-N/ ∆Q
(mg NO3-N l–1) (mg NO 3-N s l –2) (µg NO 3-N l –1) 10-14/10/94 60 691 0.28 0.82 (***) n.m. 0.8 7-11/12/94 32 121 0.37 0.55 (**) n.m. 1.5 15-17/6/95 n.m. 62 0.31 0.49 (**) n.m. 3 18-28/11/1995 55 51 0.37 1.43 (***) 0.88 (n.s.) 20.7 8-11/12/1995 21 423 0.96 1.93 (***) 0.82 (n.s.) 2.3 15/12-30/01/1996 42 950 0.60 0.50 (n.s.) 0.12 (n.s.) 0 22-26/11/1996 n.m. 382 0.80 2.83 (***) 0.96 (n.s.) 5.3 10-14/12/1996 20 1359 0.41 0.30 (n.s.) 0.53 (n.s.) 0 18-25/4/97 77 65 0.21 0.52 (**) 0.70 (*) 4.7 22-28/05/97 32 26 0.23 0.31 (**) 0.63 (*) 3.3 31/05-11/06/97 11 29 0.25 0.27 (n.s.) 0.14 (n.s.) 0 3-11/06/97 4 552 0.26 0.86 (***) 0.95 (***) 1.1 18-24/06/97 14 90 0.34 0.53 (**) 0.75 (*) 2.1 26/06-7/07/97 8 75 0.28 0.50 (**) 0.53 (**) 3 26/07-4/08/97 30 192 0.13 0.86 (*) 0.97 (**) 3.8 11-17/08/97 15 44 0.32 0.22 (n.s.) 0.10 (n.s.) 0 2-5/09/97 22 51 0.31 0.37 (n.s.) 0.20 (n.s.) 0 14-18/09/97 12 45 0.21 0.47 (**) 0.20 (n.s.) 0 23-28/10/97 40 83 0.29 0.70 (***) 0.88 (*) 5.1 3-9/11/97 11 45 0.26 0.30 (**) 0.86 (*) 0.8 25/11-2/12/97 22 88 0.26 0.66 (***) 0.86 (**) 4.6 17-30/12/97 22 187 0.60 1.85 (***) 0.87 (***) 6.7 27/01-3/02/98 42 212 0.49 1.55 (***) 0.81 (**) 5 1-5/04/98 62 47 0.39 0.56 (***) 0.77 (*) 3.6
Differences between NO3-N pre storm and NO3-N storm were tested with t-test (df=4)* p < 0.05; ** p < 0.01;*** p < 0.001; n.s.: not significant; n.m. :not measured
NO3-Nexp(t)= NO3-N(0) DOC(t) DOC(0)–1
For this equation, NO3-N(0) and DOC(0) are the observed nitrate and DOC concentrations at baseflow prior to the individual storm examined and DOC(t) is the observed DOC concentration at time “t” during storm.
Ammonium concentration comparison
Average ammonium concentration in stream, hyporheic and groundwater before and after the storm was compared using the t-test for paired samples. The data were collected at low flow conditions (15 < Q < 40 l s–1) in spring-summer of 1994 and 1995. Differences in ammonium concentration were considered significant at P < 0.05 level.
Results
(1) : Nitrate
STREAM NO3-N CONCENTRATION WITH RESPECT
TO DISCHARGE VARIABILITY
Stream NO3-N concentration ranged from 0.150 mg NO3-N l–1 (mainly in August and September) to 1.9 mg NO3-N l–1 during storm periods (Fig. 1b). During the daily sampling period (from April 1997 to March 1998), 17 storms were monitored (eleven storms in the growing period and six in the dormant period). The duration of the inter-storm periods (∆t-1) ranged between 4 and 77 days. The NO3-N concentration increased from 14% to 280% over the
pre-storm NO3-N concentrations of three quarters of the storms monitored (Table 1). Discharge was an important variable in regulating the stream nitrate concentration since, during this period, r2
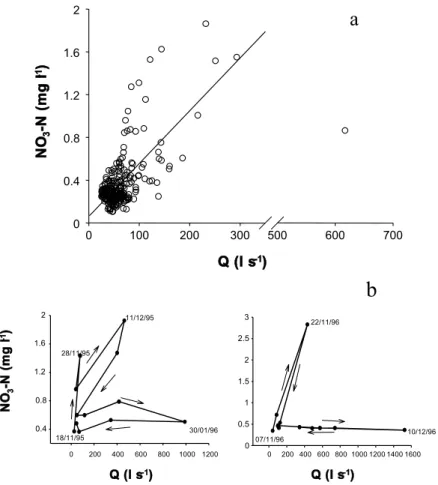
year= 47% (r2=0.47, d.f.=231, P<0.001, Fig. 2a). When each flood was analysed separately, discharge explained up to 97% of the total NO3-N variance (r2
storm,
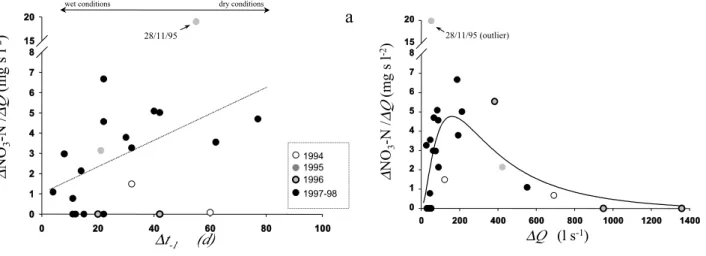
Table 1). During this period, ∆NO3-N/∆Q values ranged from 0 to 6.7 mgNO3-N s l–2 and did not show any clear seasonal pattern, but were positively related to ∆t-1 (r2=0.31, d.f.=14, P<0.05). Nevertheless, this relationship disappeared when the ∆NO3-N/∆Q values of the severe storm sequences of November 1995–January 1996 (three storms) and November–December 1996 (two storms) were included (Fig. 3a) (r2=0.13, d.f.=20, n.s.). During these high discharge periods, an anomalous high ∆NO3-N/∆Q value (20 mg N s l–2) was recorded on 28/11/95, and the ∆NO
3-N/∆Q
values dropped to zero mg NO3-N s l–2 at higher storm flow magnitudes (Fig. 2b, Table 1). The ∆NO3-N/∆Q values were fitted to a non-linear log model with respect to the storm magnitude (∆Q): ∆NO3-N/∆Q values were positively related to storm flow magnitude if 0<∆Q<400 l s–1, (with an outlier
0 100 200 300 500 600 700 0 0.4 0.8 1.2 1.6 2 N O3 -N ( m g l -1) Q (l s-1)
a
Fig. 2. Relationships between NO3-N in stream water and discharge during the study period of four years. Panel a shows the data from April 1997 to March 1998 (r2=0.47, d.f.=231, P<0.001). Panel b shows the
data during high discharge periods of November 1995–January 1996 and November–December 1996 respectively. Arrows indicate the time sequence.
0 200 400 600 800 1000 1200 0.4 0.8 1.2 1.6 2 18/11/95 28/11/95 11/12/95 30/01/96 0 200 400 600 800 1000 1200 1400 1600 0 0.5 1 1.5 2 2.5 3 22/11/96 10/12/96 07/11/96 N O3 -N ( m g l -1) Q (l s-1) Q (l s-1)
b
measurement on 28/11/95), whereas they were negatively related to storm flow magnitude if ∆Q> 400 l s–1 (Fig. 3b)
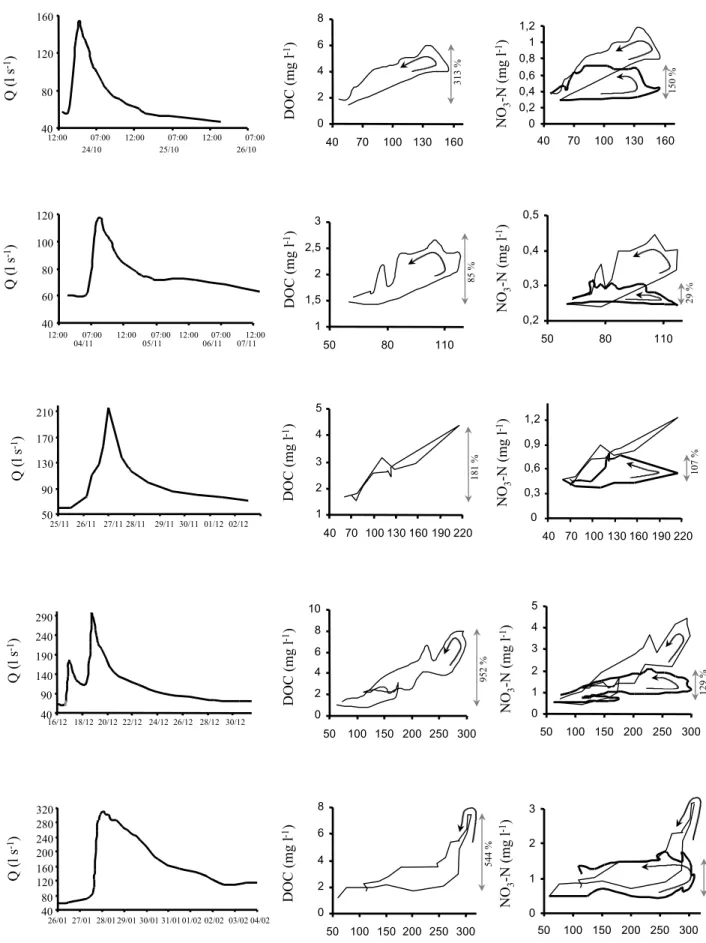
NO3-N HYSTERESIS LOOPS: A COMPARISON WITH DOC DATA
For five storms monitored between October 1997 and January 1998, NO3-N and DOC hysteresis were found. DOC hysteresis showed mainly anticlockwise rotational patterns (four events) and DOC concentration peaks coincided close to the peak in discharge. During the discharge recession limb, the DOC concentration rapidly approached the pre-storm values. The DOC hysteresis suggested the input of dissolved organic matter from the surrounding riparian zone during the discharge rising limb, and the subsequent DOC dilution due to the increase of low DOC groundwater contribution during the discharge recession limb (Butturini, 1999; Butturini and Sabater, 2000). Similarly, the dominant NO3-N hysteresis showed an anticlockwise pattern. Nevertheless, the NO3-N changes were smaller than the NO3 -Nexp (and DOC as well) ones: the increase of NO3-Nexp, over
∆t-1 (d)
wet conditions dry conditions
0 20 40 60 80 100 0 1 2 3 4 5 6 7 8 15 20 28/11/95 ∆ NO 3 -N / ∆ Q (mg s l -2)
a
1994 1995 1996 1997-98 -1 ( ) 0 200 400 600 800 1000 1200 1400 0 1 2 3 4 5 6 7 8 15 20 28/11/95 (outlier) ∆Q (l s-1) ∆ NO 3 -N / ∆ Q (mg s l -2)b
Fig. 3. Panel a: Relationship between ∆NO3-NS/∆Q values and the antecedent inter-storm duration (∆t-1). Dotted line shows the relationship for
data collected during the intensive sampling period April 1997-March 1998 (r2=0.31, d.f.=14, P<0.05). Panel b: Relationship between ∆NO 3
-NS/∆Q values and the storm magnitude (∆Q). Solid line shows the fit of the log-normal model ( r2=0.48, d.f.=22, P<0.01).
the basal concentration, ranged from 85% to 952%, whereas the observed NO3-N increase ranged from 29% to 280%. In detail, the NO3-N concentration did not change during the discharge rising limb; after the storm peak it increased and remained high throughout the discharge recession limb and then tailed off very slowly. 91–99% of the NO3-N flux occurred during the recession discharge limb when groundwater flux predominates over rapid runoff (Fig. 4).
ANNUAL N-NO3 EXPORT (APRIL 1997-MARCH 1998)
The estimated annual NO3-N export for the period April 1997 to March 1998 was 1016 kg (65.5 kg N km–2 y–1). Correspondingly, the annual volume-weighted NO3-N concentration (NO3-NSw) was 0.52 mg NO3-N l–1, which decreased to 0.39 mg NO3-N l–1 at times of baseflow (Table 2). Monthly volume-weighted NO3-N concentrations under baseflow showed a clear seasonal pattern, averaging 0.29± Table 2. Summary of monthly stream water flux, NO3-N flux and volume-weighted NO3-N concentration (mgNO3-N l-1) during the study period April 1997-March 1998.
Month Wat. fluxa NO
3-NSa NO3-NSwa Wat. fluxb NO3-NSb NO3-NSwb Wat. Fluxc NO3NSc NO3-NSwc
(105 m3) flux (kg) (mg N l-1) (105 m3) flux (kg) (mg N l-1) (105 m3) flux (kg) (mg N l-1)
Apr ‘97* 1.83 57.6 0.31 1.4 34.6 0.25 0.43 23 0.53 May* 1.1 26.4 0.24 0.87 21.1 0.24 0.23 5.3 0.23 Jun* 2.73 118 0.43 n.m. n.m n.m 2.73 118 0.43 Jul* 1.7 60 0.35 0.98 31.4 0.32 0.72 28.6 0.40 Aug* 1.24 30 0.24 0.75 22.42 0.30 0.49 7.58 0.15 Sep* 0.97 30.2 0.31 0.59 16.5 0.28 0.38 13.7 0.36 Oct$ 1.01 32 0.32 0.8 23.3 0.29 0.21 8.7 0.41 Nov$ 1.59 55.4 0.35 0.8 24.2 0.30 0.79 31.2 0.39 Dec$ 2.43 227 0.93 1.97 69 0.35 0.46 158 3.43 Jan ‘98$ 2.14 196 0.92 1.34 90 0.67 0.8 106 1.32 Feb$ 1.74 137 0.79 1.43 97 0.68 0.31 40 1.29 Mar$ 1.14 46 0.40 1.14 46 0.40 0 0 n.m
a= Total monthly fluxes and weighted concentrations .
b=Monthly fluxes weighted concentrations at baseflow conditions c=Monthly fluxes weighted concentrations at storm flow conditions
n.m. = not measured since baseflow (or stromflow) conditions were not achieved. *= Growing period; $dormant period
40 80 120 160 Q (l s -1) 12:00 07:00 12:00 07:00 12:00 07:00 24/10 25/10 26/10 DOC (mg l -1) 0 2 4 6 8 40 70 100 130 160 NO 3 -N (mg l -1) 0 0,2 0,4 0,6 0,8 1 1,2 40 70 100 130 160 313 % 150 % Q (l s -1) 40 60 80 100 120 12:00 07:00 12:00 07:00 12:00 07:00 12:00 04/11 05/11 06/11 07/11 1 1,5 2 2,5 3 50 80 110 DOC (mg l -1) 0,2 0,3 0,4 0,5 50 80 110 NO 3 -N (mg l -1) 29 % 85 % 1 2 3 4 5 40 70 100 130 160 190 220 DOC (mg l -1) NO 3 -N (mg l -1) 0 0,3 0,6 0,9 1,2 40 70 100 130 160 190 220 50 90 130 170 210 25/11 26/11 27/11 28/11 29/11 30/11 01/12 02/12 Q (l s -1) 181 % 107 % 0 2 4 6 8 10 50 100 150 200 250 300 DOC (mg l -1) NO 3 -N (mg l -1) 0 1 2 3 4 5 50 100 150 200 250 300 40 90 140 190 240 290 16/12 18/12 20/12 22/12 24/12 26/12 28/12 30/12 Q (l s -1) 952 % 129 % 0 2 4 6 8 50 100 150 200 250 300 NO 3 -N (mg l -1) DOC (mg l -1) 40 80 120 160 200 240 280 320 26/01 27/01 28/01 29/01 30/01 31/01 01/02 02/02 03/02 04/02 Q (l s -1) 0 1 2 3 50 100 150 200 250 300 544 % 282 %
Fig. 4. Hydrographs and hysteresis of DOC, NO3-N (bold solid lines) and NO3-Nexp (thin solid line) during the period October 1997–January 1998. Arrows indicate the timing sequences.
0 0.2 0.4 0.6 0.8 1 1.2 1.4 1.6 1.8 2 0 0.5 1 1.5 2.7 2.8 2.9 3 NO3-N subsurface waters (mg l-1) NO 3 -N stream water (mg l -1)
Fig. 5. Relationships between NO3-N in hyporheic and stream water (closed circles) and between NO3-N in groundwater and stream water at baseflow conditions (closed triangles) and during storms (open triangles). The solid line shows the y=x line.
36 mg NO3-N l–1 in the growing season and 0.68±5 NO3-N l–1 during the dormant season. During the dormant season, strong differences between volume-weighted NO3-N concentration for storm (1.4±1.2 NO3-N l_1) and baseflow periods (0.45±0.18 NO3-N l_1) were observed. The difference was much smaller during the growing season (0.39±0.15 NO3-N l_1 for storm events and 0.28±0.04 NO3-N l_1 for baseflow periods). The NO
3-N export during the dormant season was 87 % higher than during the growing season (661.4 kg v. 354 kg). Storms contributed to 51% (335 kg) and 58% (205 kg) of the total stream NO3-N export during the dormant and growing seasons, respectively.
RELATIONSHIP BETWEEN NO3-N
CONCENTRATION IN SURFACE, HYPORHEIC AND GROUNDWATER
During the period when the streams and hyporheic waters were sampled, average stream and hyporheic water NO3-N concentrations were identical at 0.39 mg NO3-N l–1 (±0.12 SD for stream waters, and ±0.11 SD for hyporheic waters) and their concentrations were strongly correlated (r=0.9, d.f.=20, P<0.001, Fig. 5).
Groundwater NO3-N concentrationaveraged 0.58±0.26 SD NO3-N l–1. At baseflow conditions, stream and groundwater NO3-Nstrongly co-varied in time (r=0.91, d.f.=28, P<0.001, Fig. 5) and in 87% of sample cases groundwater NO3-N concentrations were higher than in stream water (t test for paired data, t=4.75, d.f.=29, P<0.001). On the other hand, during storms, the correlation between NO3-N in groundwater and stream disappeared (r=0.09, d.f.=15, P>0.05), with stream NO3-N higher than in groundwater in some cases (Fig. 5).
(2) : Ammonium
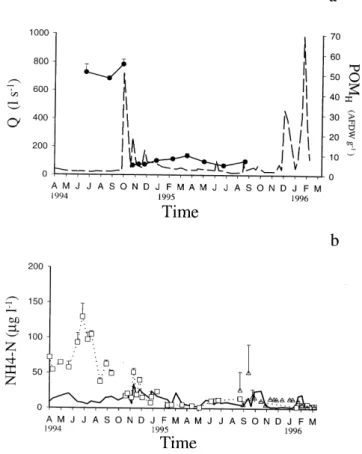
Between the 11 and the 12 October 1994, an intense rainstorm of 168 mm affected the catchment hydrograph in a few hours (data from a rain gauge located 4 km from the study site, I.N.M.). Unfortunately, it was impossible to estimate the storm flow peak, and the discharge was measured during the storm flow recession limb. Two days after the discharge peak the flow was Q=722 l s–1. The storm flow caused scouring and homogenisation of the hyporheic sediments, reduced the particulate organic matter (POMH) from 52 to 4.8 mg AFDW g–1 (Fig. 6a) and decreased the hyporheic and benthic microbial activity (Romaní et al., 1998).
Ammonium concentration in stream water averaged 11±8 mg NH4-N l–1 during the entire study period (Fig. 6b) and was only 2–3% of the nitrate transported in Riera Major (Butturini and Sabater, 2002). Its concentration did not show a seasonal pattern and there was no significant relationship with discharge throughout the study period (r2=0.01, d.f.=55, n.s). In the hyporheic zone, ammonium concentrations before the storm flow, averaged 75±28 mg NH4-N l–1 (with
Fig. 6. Temporal dynamics of stream discharge, particulate organic
matter in hyporheic (POMH) (panel a) and ammonium concentration in stream water (solid line), hyporheic water (open square) and groundwater (open triangle) (panel b). Vertical bars indicate 1 error standard.
peaks in summer) and was statistically higher than in stream water (paired t-test, t=6.4, d.f.=10, P<0.001). After the flood, the hyporheic ammonium concentration dropped to 13.6±8mg NH4-N l–1and the difference, with respect to the ammonium stream concentration, disappeared (paired t-test, t=0.4, d.f.=22, n.s.) (Fig. 6b, Table 3). In the stream water, after storm flow, no clear change in ammonium concentration was observed when all the data were used in a statistical comparison (t=0.5, d.f.=31, n.s.). Nevertheless, when the comparison is based on data collected during spring-summer periods at low flow, post-storm data averaged 6 ±3 mg NH4-N l-1, and in 70% of cases data were lower than the pre-storm data (paired t-test t=2.98, d.f.=8, P<0.05) (Table 1). This decline in ammonium concentration in spring-summer 1995, resulted in a decrease of 24% of N-NH4 flux compared with the same period of 1994 (4.6 and 3.5 kg N-NH4 in 1994 and 1995 respectively). Ammonium in groundwater averaged 13.3±11 mg NH4-N l–1, and the concentration did not differ from that of stream water (paired t-test, t=1.4, d.f.=16, n.s.).
Discussion
NITRATE DYNAMICS UNDER BASEFLOW CONDITIONS
During the period April 1997-March 1998, baseflow discharge, which covered 73% of the time, ranged between 30 l s–1 (in summer) and 100 l s–1 (in winter). Although these discharge values accounted for 60% of the total water flux, only 47% of the annual nitrate flux was exported at baseflow conditions. The higher nitrate concentrations found in groundwater compared to the stream and hyporheic waters under baseflow conditions suggests that groundwater is the main source of nitrate in stream water. This result is based on data obtained from a small perennial spring and therefore a more detailed study of groundwater is required.
Nevertheless, this spring was considered quite representative of the groundwater systems. Under basal flow conditions, the electrical conductivities values of the spring and stream waters approached similar values (Buturini and Sabater, 2000), and a significant correlation existed between stream and groundwater nitrate concentrations. This correlation indicates that the variability of nitrate in stream water at baseflow conditions depends on groundwater inputs. The short residence time of water in the hyporheic zone (ranging between 54 and 119 minutes at 25 cm depth in the sediments) (Butturini and Sabater, 1999) explains the lack of a significant difference in nitrate concentration between surface and hyporheic waters, and their strong co-variability in time. Nitrification in the hyporheic and streambed is probably insignificant due to the low concentration of ammonium compared to that of nitrate (less than 10 mg NH4-N l–1). This hypothesis is corroborated by the lack of correlation between nitrate and ammonium dynamics in stream and hyporheic waters during the study period (Butturini and Sabater, 2002), and the lack of nitrate increase after in-stream ammonium controlled additions (Butturini and Sabater, 1999). These results suggested that the stream sediments act as a nitrate sink when groundwater discharges to the stream through the hyporheic zone.
Using the ratio between the stream and groundwater electric conductivity at baseflow (206/237=0.87) as a dilution factor, an average baseflow of 52 l s–1, and average nitrate concentration in stream water and groundwater of 0.39 mg NO3-N l–1 and 0.54 mg NO
3-N l–1 respectively, an in-stream nitrate retention of 24 mg NO3-N m-2 d–1 was estimated. This is a rough nitrate uptake estimation however, it is in the same range as nitrogen uptake found in a small temperate stream (approximately 17 mg NO3-N m–2 d–1, Mulholland, 1992) and in a tundra river (between 7 and 50 mg NO3-N m–2d–1, Peterson et al., 1993).
Volume-weighted nitrate concentration at baseflow conditions changed from maximum values in winter to Table 3. Ammonium average concentration (±1 Standard Deviation and range of variation) in stream water, hyporheic zone and groundwater before and after the storm flow.
Period Stream water Hyporheic Groundwater
(mg NH4-N l-1) (mg NH
4-N l-1) (mg NH4-N l-1)
Pre-Storm (April-September 1994)* 11.2±8 (5-21); n=12 75±28 (38-129); n=11 n.m.
Post-Storm (November 1994-March 1996) 11±8 (2-34); n=44 13.6±8 (1-51); n=23 13.3±11 (2-50); n=17 Post-Storm (April l995-September 1995)* 6±3 (2-12); n=11 9±5 (1-14); n=6 n.m.
* data collected under low flow conditions n.m.= not measured.
minimum values in spring-summer. This pattern is similar to other seasonal variations observed in forested catchment streams (Vitousek, 1977; Foster et al., 1989; Reynolds et al., 1992; Sloan et al., 1994) due to seasonal variation in nitrate uptake caused by terrestrial vegetation and soil microbial activity. Under baseflow conditions, NO3-NSw concentration remains approximately constant at 0.3 mg NO3-N l–1 during the growing season and it is only during the winter, when stream water temperature decreased to 5oC, that the volume-weighted nitrate concentration at baseflow conditions increases by over 100%. (Table 2).
NITRATE VARIABILITY DURING STORMS
Storm magnitude (∆Q) is a key factor in regulating the nitrate variability, with optimal ∆NO3-N/∆Q responses corres-ponding to storm peaks ranging from 100 to 400 l s–1. The rapid decrease of ∆NO3-N/∆Q values during storms of magnitude higher than 400 l s–1 reflects the dilution of nitrate in groundwater and catchment soil. The variability of the ∆NO3-N/∆Q ratio can increase rapidly during a sequence of heavy storms because nitrate can be washed out easily during severe storms, and its restoration in the catchment takes time (Creed et al., 1996).
On the other hand, the role of inter-storm duration (∆t) on nitrate variability remains uncertain. A direct relation-ship should be expected between ∆t and ∆NO3-N/∆Q since long ∆t and therefore, antecedent dry conditions, favour solute accumulation in catchments and the successive solute flushing in stream water (Walling and Foster, 1975;Walling and Webb, 1986). Indeed, nitrate flushing can occur during the transition from dry to wet conditions in small catchments (Ávila, 2002; Ávila et al., 1992; Biron et al., 1999). Nevertheless, establishing a more general empirical model relating the solute’s responses with the antecedent hydrological condition is difficult because data from a wide spectrum of antecedent hydro-climatic conditions are required. The direct relationship between the ∆NO3-N/∆Q and ∆t during the intensive sampling period 1997–98 indicates that the role of ∆t can be detected only if storms of small magnitude occur. Autumnal and winter nitrate hysteresis shapes confirm the importance of groundwater as the main nitrate source for stream water. The lack of nitrate concentration increase, observed during the discharge rising limb, in most of the cases, contrasts with that found for DOC, indicating that the runoff component during the storm rising limb is an important source for DOC but not for nitrate. On the other hand, nitrate inputs by rapid overland flow can be depicted from the high ∆NO3-N/∆Q rates and clockwise hysteresis observed during the heavy storm flows of November 1995–January 1996. Nevertheless, this
hypothesis require to be corroborated since these hystereses are based on few data.
AMMONIUM DYNAMICS
The role of the hyporheic zone as an ammonium source or sink has not received as much attention as has DOC and nitrate (Jones and Holmes, 1996), because ammonium is usually the less abundant form of inorganic nitrogen in pristine streams. In Riera Major, the sediments are not compacted, and can easily be homogenised during storms. Therefore, the occurrence of an unusual storm flow event in October 1994 allowed the assessment of the role of the hyporheic zone as source of or sink for ammonium. The significant decrease of ammonium concentration in hyporheic waters after the severe storm indicated strongly that the undisturbed stream sediment acted as an ammonium source. The ammonium release was associated with the mineralisation of the organic matter stored in the hyporheic zone. Comparison with the data collected at low flow discharge conditions suggests that the undisturbed hyporheic zone might contribute around 40% of ammonium content in stream water. These findings contrast with those found on nitrate: the nitrate dynamics in hyporheic and stream waters was not altered by the storm flow of October 1994. (Fig. 1b).
Conclusions
(1) : Nitrate
The detailed monitoring of nitrate concentration in stream water during storm flows and in groundwater and hyporheic water led to conclude that in Riera Major:
(1) Groundwater is the main source of nitrate in stream water, while the hyporheic zone and streambed act as a sink for nitrate.
(2) The anticlockwise hysteresis nitrate loops indicate that the rapid runoff component is not an important source for nitrate.
(3) The rate of change in nitrate concentration with respect to storm flow ranged widely and fitted a non-linear empirical model with respect to storm flow magnitude. Higher rates were observed at intermediate storm magnitude, whereas low rates occurred during severe storms. On the other hand, the role of the inter-storm duration on nitrate variability remains unclear.
(2) : Ammonium
1. Undisturbed hyporheic sediments with high particulate organic matter content act as a source for ammonium. 2. Major storm events can alter the hyporheic structure of Riera Major. The removal of the hyporheic organic matter resulted in an abrupt drop of 80% of ammonium content in the hyporheic zone and a decrease of 40% in ammonium content in stream water in spring and summer during low discharge conditions.
3. After the major storm, no differences in ammonium content were observed between stream, hyporheic and groundwater, suggesting that under disturbed hyporheic sediment conditions, stream ammonium level is sustained mainly by input from groundwater.
We consider that the non-linearity of the nitrate change and storm magnitude relationship is extremely useful for catchment nitrogen-runoff modelling research across Europe (Wade et al., 2002). In this paper it is suggested that, in Mediterranean streams, where storm flows accounted for most dissolved inorganic nitrogen transport, and discharges are subjected to irregular precipitation regimes and prolonged dry periods, it is opportune to study the nitrate behaviour under a wide range of magnitudes of storm flows to obtain a more accurate description of its dynamics.
Acknowledgements
The comments from Colin Neal, the INCA project partners and from two anonymous referees are greatly appreciated. A. Butturini’s research was supported by EU projects (Nicolas, contract No ENV4-CT97-0395 and INCA EVK1-1999-00011).
References
Ågren, G.I. and Bosatta, E., 1996. Theoretical Ecosystem Ecology.
Understanding element cycles. Cambridge University Press,
Cambridge, UK.
Ávila, A,. 2002. Nitrogen circulation in a Mediterranean holm oak forest, La Castanya, Montseny, north eastern Spain. . Hydrol.
Earth Syst. Sci., 6, 551–557.
Ávila, A,. Piñol, J., Rodá, F. and Neal, C., 1992. Storm solute behaviour in a montane Mediterranean forested catchment. J.
Hydrol., 140, 143–161.
Biron, P.M., Roy, A.G., Courschesna, F., Hendershot, W.H., Coté, B. and Fyles, J., 1999. The effects of antecedent moisture conditions on the relationships of hydrology to hydrochemistry in a small forested watershed. Hydrol. Process., 13, 1541–1555. Butturini, A., 1999. Contribution of the boundary zones on nutrient
dynamics in a stream with Mediterranean regime. PhD.
Dissertation, University of Barcelona.
Butturini, A. and Sabater, F., 1999. Importance of transient storage zones for ammonium and phosphate retention in a sandy-bottom Mediterranean stream. Freshwater Biol., 41, 593–603. Butturini, A. and Sabater, F., 2000. Seasonal variability of
Dissolved Organic Carbon in a Mediterranean stream.
Biogeochemistry, 51, 303–321.
Creed, I.F. and Band, L.E., 1998. Export of nitrogen from catchment within a temperate forest: evidence for a unifying mechanism regulated by variable source area dynamics. Water
Resour. Res., 34, 3105–3120.
Creed, I.F., Band, L.E., Foster, N.W., Morrison, I.K., Nicolson, J.A., Semkin, R.S. and Jeffries, D.S., 1996. Regulation of nitrate-N release from temperate forest: a test of the nitrate-N flushing hypothesis. Water Resour. Res., 32, 3337–3354.
Evans, C.D., and Davies, T.D., 1998. Causes of concentration/ discharge hysteresis and its potential as tool for analysis of episode hydrochemistry. Water Resour. Res., 34, 129–137. Evans, C.D., Davies, T.D., Wigington Jr., P.J., Tranter, M. and
Kretser, W.A., 1996. Use of factor analysis to investigate processes controlling the chemical composition of four streams in the Adirondack Mountains, New York.. J. Hydrol., 185, 297– 316.
Foster, N.W., Nicolson, J.A. and Hazlett, P.W., 1989. Temporal variation in nitrate and nutrient cations in drainage waters from a deciduous forest. J. Env. Qual., 18, 238–244.
Grimm, N.B. and Fisher, S.G., 1986. Nitrogen limitation potential of Arizona streams and rivers. J. Ar. Nev. Ac. Sci., 21, 31–43. Hill, A.R., 1993. Nitrogen dynamics of storms runoff in the riparian
zone of a forested watershed. Biogeochemistry, 20, 19–44. Hinton, M.J., Schiff, S.L. and English, M.C., 1997. The
significance of storms for the concentration and export of dissolved organic carbon from two Precambrian Shield catchments. Biogeochemistry, 36, 67–88.
Jones, J.B. and Holmes, R.M., 1996. Surface-subsurface interactions in stream ecosystems. TREE, 11, 239–242. Lewis, W. M. and Grant, M.C., 1979. Relationships between stream
discharge and yield of dissolved substances from a Colorado mountain watershed. Soil Sci., 128, 353–363.
Likens, G.E., Bormann, F.H., Pierce, R.S., Eaton, J.S. and Johnson, D.W., 1977. Biogeochemistry of a forested ecosystem. Springer, New York.
Mayewski, P.A., Lyons, W.B., Spencer, M.J., Twickler, M., Buck, C.F., and Whitlow, S., 1990. An ice-core record of atmospheric response to anthropogenic sulphate and nitrate. Nature, 378, 355–359.
McDowell, W.H. and Wood, T., 1984. Podzolization: soil processes control dissolved organic carbon concentrations in stream water.
Soil Sci., 137, 177–195.
Meyer, J.L., McDowell, W.H., Bott, T.L., Elwood, J.W., Ishizaki, C., Melack, J.M., Peckarsky, B.L., Peterson, B.J. and Rublee, P.A., 1988. Elemental dynamics in streams. J. N. Amer. Benthol.
Soc., 7, 410–432.
Mulholland, P.J., 1992. Regulation of nutrient concentration in a temperate forest stream: roles of upland, riparian, and in stream processes. Limnol. Oceanogr., 37, 1512–1526.
Mulholland, P.J. and Hill, W.R.,. 1997. Seasonal patterns in stream water nutrient and dissolved organic carbon concentrations: separating catchment flow path and in-stream effects. Water
Resour. Res., 33, 1297–1306.
Mulholland, P.J., Wilson, G.V. and Jardine, P.M., 1990. Hydrogeochemical response of a forested watershed to storms: effects of preferential flow along shallow and deep pathways.
Water Resour. Res., 26, 3021–3036.
Piñol, J., Avila, A. and Rodá F., 1992. The seasonal variation of streamwater chemistry in three forested Mediterranean catchemtns. J. Hydrol., 140, 119–141.
Reynolds, B., Emmett, B.A. and Woolds, C., 1992. Variations in streamwater nitrate concentrations and nitrogen budgets over 10 years in a headwater catchment in mid-Wales. J. Hydrol., 136, 155–175.
Romaní, A.M., Butturini, A., Sabater, F. and Sabater, S., 1998. Heterotrophic metabolism in a forest stream sediment: surface versus subsurface zones. Aquat. Microb. Ecol., 16, 143–151. Romano, J. and Krol. J., 1993, Capillary ion electrophoresis, an
environmental method for the determination of anions in waters.
J. Chromat., 640, 403–412.
Ruiz, L., Abiven, S., Martin, C. , Durand, P., Beaujouan, V. and Molenat, J., 2002, Effect on nitrate concentration in stream water of agricultural practices in small catchments in Brittany. II – Temporal variations and mixing processes. Hydrol. Earth Syst.
Sci., 6, 507–513.
Schlesinger, W.H., 1997. Biogeochemistry: an analysis of global
change. Academic Press.
Sloan, W.T., Jenkins, A. and Etherall, A., 1994. A simple model of stream nitrate concentrations in forested and deforested catchment in Mid-Wales. J. Hydrol., 158, 61–78.
Solorzano, L., 1969. Determination of ammonia in natural waters by phenolypochloride method. Limno. Oceanogr., 14, 799–801. Vitousek, P.M., 1977. The regulation of element concentrations in mountain streams in the north-eastern United States. Ecol.
Monogr., 47, 65–87.
Wade, A.J., Durand, P., Beaujouan, V., Wessels, W., Raat, K., Whiehead, P.G., Butterfield, D., Rankinen, K. and Lepisto, A., 2002. A nitrogen model of European catchments: INCA, new model structure and equations. Hydrol. Earth Syst. Sci.,6, 559– 582.
Walling, D.E., and Webb, B.W., 1986. Solutes in river systems. In: Solutes processes, S.T. Trudgill (Ed.). Wiley, New York, 251–327
Walling, D.E. and Foster, I.D.L., 1975. Variations in the natural chemical concentration of river water during flood flows, and the lag effect: some further comments. J. Hydrol., 26, 237–244. Whelan, M.J., Kirkby, M.J. and Burt, T.P., 1995. Predicting nitrate concentration in small catchment streams. In: Solute modelling
in Catchment systems, S.T. Trudgill (Ed.). Wiley, New York,