HAL Id: hal-00455614
https://hal.archives-ouvertes.fr/hal-00455614
Submitted on 10 Feb 2010
HAL is a multi-disciplinary open access
archive for the deposit and dissemination of
sci-entific research documents, whether they are
pub-lished or not. The documents may come from
teaching and research institutions in France or
abroad, or from public or private research centers.
L’archive ouverte pluridisciplinaire HAL, est
destinée au dépôt et à la diffusion de documents
scientifiques de niveau recherche, publiés ou non,
émanant des établissements d’enseignement et de
recherche français ou étrangers, des laboratoires
publics ou privés.
Copyright
temperate and boreal forests: a review
S. Barbier, Philippe Balandier, Frédéric Gosselin
To cite this version:
S. Barbier, Philippe Balandier, Frédéric Gosselin. Influence of several tree traits on rainfall partitioning
in temperate and boreal forests: a review. Annals of Forest Science, Springer Nature (since 2011)/EDP
Science (until 2010), 2009, 66 (6), p. 602p1 - p. 602p11. �10.1051/forest/2009041�. �hal-00455614�
DOI:10.1051/forest/2009041
Review article
Influence of several tree traits on rainfall partitioning
in temperate and boreal forests: a review
Stéphane B
1,3, Philippe B
1,2, Frédéric G
1*
1Cemagref, UR EFNO, Domaine des Barres, 45290 Nogent-sur-Vernisson, France 2INRA, UMR 547 PIAF, 63100 Clermont-Ferrand, France
3INRA, US InfoSol, 2613 avenue de la Pomme de Pin, Ardon 45166 Olivet, France
(Received 5 November 2008; accepted 23 February 2009)
Keywords: water / tree traits / stemflow / throughfall / interception Abstract
•In forests, rainfall is partitioned into intercepted water (IW), throughfall (TF) and stemflow (SF). We reviewed the majority of published works comparing water flows among tree species in temperate and boreal forests to test the effect of several tree traits on water flows.
•We hypothesized that water flows differed between evergreen and deciduous species, and according to successional status and bark roughness. We also investigated that water flows would be explained by stand variables such as basal area.
•Linear mixed models fitted on reviewed data showed that evergreens had a lower TF than deciduous trees (decrease of 13.9% of total precipitation year-round and 8.4% over the growing period). Similar results were found for conifers compared to broadleaves. TF also declined with the successional status from pioneer to late-successional tree species. SF decreased with bark roughness from smoother to rougher bark. Evergreens had water flows that were dependent on age of the stand, especially for TF which increased by 15.6% of total precipitation from young to adult forests.
•The large scale of TF differences between tree genera together with specific transpiration amounts and rooting features highlighted in other studies should result in significant differences in soil water content among tree species. This may have consequences on stand fitness and growth, and understory vegetation.
Mots-clés : eau /
traits des arbres / écoulement / égouttement / interception
Résumé – Effet de quelques traits des arbres sur la répartition des eaux de pluie en forêts tem-pérées et boréales – synthèse bibliographique.
•En forêt, l’eau de pluie se fractionne en eau interceptée (IW), égouttements (TF) et écoulements le long des troncs (SF). Nous analysons les publications comparant les flux d’eau selon les essences d’arbres, pour les forêts tempérées et boréales, et nous testons l’effet de quelques traits des arbres sur ces flux d’eau.
•Nous faisons l’hypothèse que les flux d’eau diffèrent entre les essences à feuilles persistantes et les essences à feuilles caduques, et diffèrent selon le statut successionnel de l’essence et la rugosité de son écorce. Nous testons aussi l’effet de variables du peuplement telles que sa surface terrière. •L’analyse des données (par modèle linéaire à effets mixtes) montre que les essences à feuilles per-sistantes ont des égouttements (TF) plus faibles que les essences à feuilles caduques (diminution de 13,9 % des précipitations totales en moyenne sur toute l’année et de 8,4 % pour la période estivale). Les résultats sont similaires en comparant les conifères au feuillus. Les égouttements diminuent aussi avec le stade successionnel de l’essence, des pionnières vers les dryades. Les écoulements (SF) di-minuent nettement avec la rugosité de l’écorce, des plus lisses vers les plus rugueuses. Les essences à feuilles persistantes ont des flux d’eau qui dépendent de l’âge du peuplement : les égouttements augmentent de 15,6 % des précipitations totales en passant des jeunes forêts aux forêts adultes. •L’amplitude des différences d’égouttements entre essences que nous avons observée, conjointement avec les différences spécifiques de transpiration et de caractéristiques du système racinaire mention-nées dans la littérature, induisent probablement des différences de contenu en eau du sol entre les essences forestières. Cela peut avoir des conséquences sur la santé et la croissance des peuplements, et sur la végétation des strates inférieures.
1. INTRODUCTION
Rainwater falling onto the forest canopy is partitioned into three fractions: (i) throughfall – TF – defined as water that reaches the soil either directly through canopy gaps or indi-rectly after running off the canopy; (ii) stemflow – SF – de-fined as water running down the trunk and into the soil; and (iii) intercepted water – IW – defined as water that collects in the crown but is re-evaporated or absorbed by leaves (e.g. Breshears et al.,2008) before it can reach the soil.
The distinction between these different kinds of water flows is ecologically important at tree scale (Levia and Frost,2003): TF accounts for the majority of net rainfall at the forest floor while SF is a spatially-localized input of water (and solutes) at the tree stem base. These differences in water flows can affect overall soil water content as well as in-soil water dis-tribution, with tree-specific transpiration and rooting archi-tecture contributing to the effects. Besides the importance of soil water availability for tree survival and growth , soil water content also affects numerous biological or physical compo-nents of the ecosystem, including soil biology and fauna, un-derstory vegetation, and microclimate. It is therefore impor-tant to know how water flows differ among trees with different traits. Our initial aim was to compare TF, SF and IW between tree species, as tree species is a major forest characteristic and is known to affect resource levels, especially light availabil-ity but also the less-studied water availabilavailabil-ity (Barbier et al.,
2008). However, the fact that there was insufficient data to perform between-species water flow comparisons prompted us to study more synthetic tree traits: (1) evergreenness, which could be a determinant factor for waterflows (Aussenac and Boulangeat,1980); (2) successional status, which has already been discussed as a factor of IW (Aussenac and Boulangeat,
1980) but not yet tested; (3) bark roughness, which has also been discussed as a factor of SF (e.g. Aboal et al.,1999; Levia and Herwitz,2005) but not yet been analyzed. We also tested and compared stand characteristics such as age or basal area, which are important factors of forest structure and canopy cover liable to affect water flows (Barbier et al.,2008). The widespread lack of literature data kept us limited to these tree traits, and other variables such as leaf area index could not be tested.
Previous studies have focused on the relative importance of IW, SF and TF volumes, but most reports only compared a few tree species or genera. Species/genera-based reviews have been published to facilitate tree species comparisons, but they are either incomplete (Aussenac,1970; Forgeard et al.,1980; Wei et al.,2005) or were not performed in temperate or bo-real forests (Llorens and Domingo,2007). Parker (1983) did conduct a large review of tree species effects, but focussed on TF chemistry. Here, we reviewed 28 papers with the ob-jective of quantitatively determining the effects of certain tree traits (evergreenness, successional status and bark features) or of tree genera on rainfall partitioning in temperate and boreal forests.
2. MATERIALS AND METHODS 2.1. Literature reviewed
We reviewed 28 papers comparing TF, SF and/or IW in at least two tree species to better estimate site or study effects. Data were restricted to the forests of the boreal and temperate biogeographi-cal zones, i.e. to latitudes higher than approximately 30◦
. Boreal cli-mate is characterized by mean temperatures ranging between –10 and –50 ◦C for the coldest months and 10 ◦C or more over the
1–3 months of summer. The generally low mean annual rainfall peaks at 1 300 mm but decreases with decreasing annual mean tempera-ture down to 300 mm. Temperate climate is characterized by mean temperatures ranging between –5 and +5◦C for the coldest months
and +15 to +20◦C for the warmest months. Annual rainfalls range
from approximately 600 mm in Europe to 2 500 mm on the Pacific West coast of North America (Lacoste and Salanon,1991). To avoid the effects of excessively strong variation in canopy cover, we ex-cluded very young forests (defined arbitrarily as forest aged less than 20 years old). As water flows are highly dependent on rainfall char-acteristics (e.g. Toba and Ohta,2005), tree trait effects on water parti-tioning may be distorted when distant stands subjected to different precipitation regimes are compared. We therefore excluded exper-iments comparing tree species in stands located more than 50 km apart, which is the lowest limit at which rainfall amounts can be considered independent in Europe (Onof and Wheater,1996; Van-nitsem and Naveau, 2007). Since two papers (Cape et al., 1991; Houdijk and Roelofs,1991) compared different groups of more than two species in sites located more than 50 km apart, we considered each site as an independent study. The final data analysis therefore included a total of 31 studies. All except Robins (1974) included TF values while only 20 papers included SF and IW values. The data are compiled in Table A (supplemental data available online only at
www.afs-journal.org).
2.2. Waterflow metrics
In the selected papers, TF was measured by rain gauges either systematically or randomly distributed under tree cover at between 0 and 2 m above ground level; a gauge in an adjacent open area (or, exceptionally, above the canopy) allowed to deduce TF percent of total rainfall. Total receptive surface varied strongly among studies depending on gauge number and surface area covered, ranging from 150 cm2(Houdijk and Roelofs,1991) to 10 m2(Leyton et al.,1967).
SF was measured using a rubber collar around the trunk in at least one turn at breast height. Two different methods were used to transform the volume measured per tree into SF percent of rainfall in the stand: either (i) measuring SF on representative trees (often 5 or 6, some-times 14 or 26) and using stem density in the stand (e.g. Aussenac,
1968) or (ii) measuring SF under several trees (often only 2 or 3) and using crown projection area to deduce a mean surface area per tree and then a stem density based on this reduced area (e.g. Courchesne and Hendershot, 1988). Authors generally calculated IW using the formula IW = P − (T F + S F) where P is the total rainfall. Since two authors calculated IW without considering SF (using the simple formula IW = P − T F), we excluded their IW values. When values were available for TF and SF but not IW, we calculated IW ourselves using the first formula: IW = P − (T F + S F).
Other co-variables such as stand density, basal area, tree height or age were also recorded when available. However, we were unable to fully control leaf area index (LAI) as this variable was rarely given
Table I. Successional status and bark roughness of a selection of tree species from boreal and temperate forests.
Tree species Successional status Bark roughness (adult trees) Betula papyriferaMarsh. Pioneer Furrowed/fissured
Betula pendulaRoth. Pioneer Furrowed/fissured
Betulasp. Pioneer
Populus grandidentataMichaux Pioneer Furrowed/fissured
Populussp. Pioneer
Acer platanoidesL. Post-Pioneer
Alnus glutinosa(L.) Gaertn. Post-Pioneer Scaly
Carpinus betulusL. Post-Pioneer
Larix cajanderiMayr. Post-Pioneer Furrowed/fissured
Larix deciduaL. Post-Pioneer Scaly
Larix laricina(Du Roi) K. Koch Post-Pioneer Furrowed/fissured
Larixx eurolepis Henry Post-Pioneer Scaly
Pinus contortaDougl. Ex Loud. var. murrayana (Balf.) Engelm. Post-Pioneer
Pinus nigraArn. Post-Pioneer Scaly
Pinus nigraArn. var. laricio Post-Pioneer
Pinus resinosaAit. Post-Pioneer Scaly
Pinus strobusL. Post-Pioneer Furrowed/fissured
Pinus sylvestrisL. Post-Pioneer Scaly
Pinus taedaL. Post-Pioneer
Quercus petraea(Matt.) Lieb. Post-Pioneer Scaly
Quercus roburL. Post-Pioneer
Quercus rubraL. Post-Pioneer Furrowed/fissured
Tilia cordataMill. Post-Pioneer
Abies balsamea(L.) Mill. Late-successional Furrowed/fissured Abies grandis(Dougl.) Lindl. Late-successional Furrowed/fissured Acer saccharumMarsh. Late-successional Furrowed/fissured Chamaecyparis lawsoniana(Murr.) Parl. Late-successional Furrowed/fissured Fagus grandifoliaEhrh. Late-successional smooth
Fagus sylvaticaL. Late-successional smooth
Nothofagus obliqua(Mirb.) Blume Late-successional
Picea abies(L.) Karst Late-successional Scaly Picea glauca(Moench) Voss Late-successional Scaly Picea mariana(Mill.) B. S. P. Late-successional
Picea omorika(Pancic) Purkyné Late-successional Scaly
Picea rubensSarg. Late-successional Scaly
Picea sitchensis(Bong.) Carr Late-successional Furrowed/fissured Pseudotsuga menziesii(Mirb) Franco Late-successional Scaly
Thuja occidentalisL. Late-successional Scaly Thuja plicataDonn ex D. Don Late-successional Scaly
Tsuga canadensis(L.) Carr. Late-successional Furrowed/fissured Tsuga heterophylla(Raf.) Sarg. Late-successional Furrowed/fissured
in the papers reviewed. We discarded the basal area values of the Crathes site reported in Cape et al. (1991) due to their very high (50, 95 and 125 m2ha−1) apparently outlier values (Tab. A).
2.3. Hypotheses tested
Using these data, we tested three a priori hypotheses. Our first hypothesis concerned the two tree traits most often considered as associated with rainfall partitioning: evergreen versus deciduous trees (“evergreenness”) and coniferous versus broadleaved trees (“conif-erousness”). Among the coniferous species, Larix sp. was the only deciduous genus, and among broadleaves there was no evergreen species, making it difficult to compare these two traits (evergreenness versus coniferousness) and impossible to study their interaction. We therefore chose to retain only the following evergreenness hypothesis:
(H1) evergreens intercept more water and have lower TF than decid-uous trees (as observed by Aussenac and Boulangeat (1980) and Helliwell (1982), and by Keim et al. (2006) for the conifers ver-sus broadleaves opposition); SF differs among these groups (no a priori hypothesis concerning which side the difference lies). The other two a priori hypotheses concerned the effect of successional status on TF and IW and the effect of bark roughness on SF: (H2) TF decreases and IW increases from pioneer through
post-pioneer to late-successional species. Successional status (pioneer = –1, post-pioneer = 0 and late-successional = 1) was assigned according to Rameau et al. (1989) and using unpub-lished data (Tab.I).
(H3) SF varies with bark roughness (smooth, furrowed/fissured, or scaly). A bark roughness level (smooth, furrowed/fissured, and scaly bark) was assigned to adult trees based on data from the
50 60 70 80 20 30 40 50
old
young
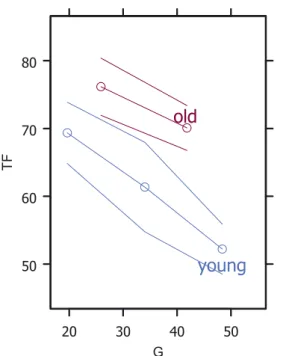
G TFFigure 1. Relationship between throughfall (TF, % of total
precipi-tation) and basal area (G, in m2ha−1) according to stand age (young:
20 to 50 years old; old: more than 50 years old). Points are grouped by intervals of 15 successive G values, and the y-axis presents per-centiles of the TF values of these groups based on a normal ap-proximation (median and 95% confidence interval, cf. Harrell,2001), placed at the median group values for G on the x-axis. Point grouping was performed to render the plot more readable (Harrell,2001).
eFloras database (2008), Hélardot (2008) and Rameau et al. (1989) (Tab.I).
2.4. Genera comparisons
We also compared tree genera. Since few genera had enough data to be analyzed, we only kept the genera with more than 10 values for the precipitation fraction studied. Thus, we compared TF, SF and IW in four genera (Fagus, Pseudotsuga, Picea and Pinus).
Pseudot-sugagenus was represented by only one species, i.e. P. menziesii. We compared each genus to the mean of the others without any specific a priori hypothesis.
Analyses were provided on measurements conducted either throughout the year or only during the growing period, i.e. 2 to 6 months between April, May or June and June, July, August, Septem-ber or OctoSeptem-ber, the most common period being June to SeptemSeptem-ber.
2.5. Generation of new hypotheses and confrontation of hypotheses through model comparisons
Having formulated the above a priori hypotheses, we also ana-lyzed the data to generate new hypotheses and confront models or hypotheses through model comparison techniques (cf. Sect. 2.6).
We first tested whether there was an effect of stand basal area, density or height – when documented – on TF, SF and IW (we could not test a potential effect of LAI due to the lack of papers reporting
40 50 60 70 80 50 100 150 Decid Everg age TF
Figure 2. Relationship between throughfall (TF, % of total
precipita-tion) and age (in years) for deciduous (“Decid”) and evergreen (“Ev-erg”) tree species. Points are grouped by intervals of 15 successive age values, and the y-axis presents percentiles of the TF values of these groups based on a normal approximation (median and 95% con-fidence interval, cf. Harrell,2001), placed at the median group values for age on the x-axis.
LAI values) by fitting models incorporating one of these covariates at a time.
Second, based on data inspection (cf. Sect. 3.3), we fitted the fol-lowing alternative models on TF, SF and IW data for both the full dataset and the stands over 50 years old only:
(1) A model that included a semi-continuous age covariate (mini-mum between stand age and age 50 years old, based on data inspection and model tests) as well as one of our stand-level covariates (basal area, height or density). This model is termed “Age2+Basal area” when referring to a Basal area covariate. (2) A model that incorporated the interaction between evergreenness
and stand age (cf. Fig.2). This model is termed “Evergreen× Age”.
(3) A model that incorporated the interaction between evergreenness and one of the stand-level covariates (cf. Fig.3). This model is termed “Evergreen×Basal area” when referring to a Basal area covariate.
Each above set of TF, SF and IW models was compared to models involving the Evergreeness×Season interaction – called “Evergreen×Season” models – and null models (no covariate) with the AICc information criterion (Burnham and Anderson,2002). The effects in the best models were not tested for significance as they were based on a posteriori hypotheses.
Third, for each water volume, we cross-compared the models as-sociated with our above a priori hypotheses to get an indication of which was the better model of water flow variations.
2.6. Statistical analyses
Standard deviations and/or number of measurements were stated in less than half of the studies reviewed. We therefore decided not to analyze these data using classical meta-analysis techniques (Gurevitch and Hedges,2001), but instead to use simple linear mixed-effect models (the “lme” function in S-Plus 6.2). Random mixed-effects
50 60 70 80 20 30 40 50
Decid
Everg
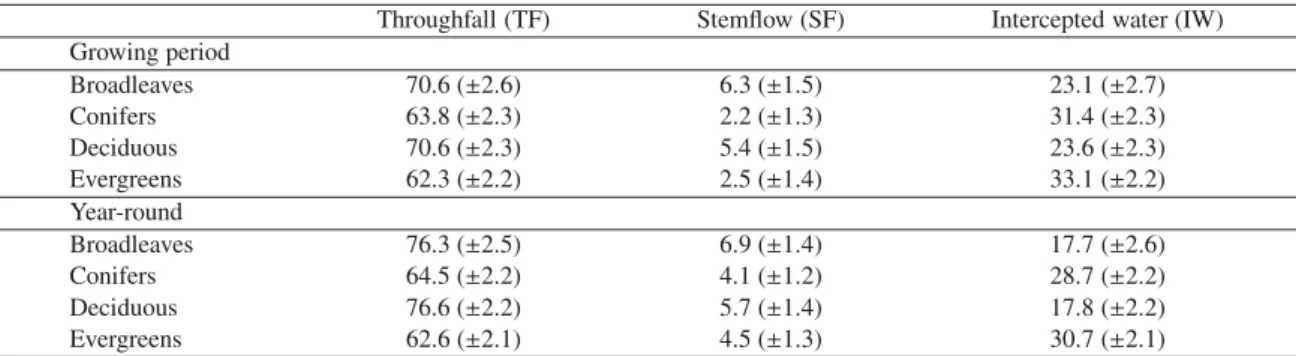
G TFFigure 3. Relationship between throughfall (TF, % of total
precip-itation) and basal area (G, in m2ha−1) for deciduous (“Decid”) and
evergreen (“Everg”) tree species. Points are grouped by intervals of 15 successive G values, and the y-axis presents percentiles of the TF values of these groups based on a normal approximation (median and 95% confidence interval, cf. Harrell,2001), placed at the median group values for G on the x-axis.
were either the study identity (following Schmid and Brown,2000) when comparing tree genera, or crossed random effects mixing study identity and tree species when comparing tree groups (all the other models). The in-model fixed effects were the effects specified in Sec-tions 2.3 and 2.4. For the analysis of TF and IW (respectively SF) data, we used the inverse of the number of gauges (respectively the inverse of the number of tree trunk datasets) in the stand as a covari-ate of the residual variance, as this kind of heteroscedastic shape is expected from the central limit theorem.
We used a multiple comparisons procedure based on the estimates extracted from the linear mixed-effect model. The “multiple” com-parisons run to test hypotheses H1 through H3 in fact involved only one comparison. The number of tree species in the model minus the number of fixed effects estimated gave the number of degrees of free-dom. This number was lower than the number generated by the “lme” function, and thus gave a more conservative test. Tukey’s studentized range distribution was used to calculate significance intervals. Re-sults are given in the body of the text as follows: mean of the es-timate (level of significance). The eses-timate was often the difference between the estimates of two categories (e.g. evergreens and decidu-ous). Percentages (%) indicate percentage of total precipitation – not percent reduction of one estimate with respect to the other. Statisti-cal significance was summarized as the interval spanning the p-value:
p <0.001, p < 0.01 when 0.001 ≤ p < 0.01, and p < 0.05 when 0.01 ≤ p < 0.05. For greater simplicity, the number of degrees of freedom associated with each test are not given.
The relative quality of several models was compared using the modified Akaike Information Criterion – AICc – which is similar to the Akaike Information Criterion (AIC) but corrected to remove small sample biases (Burnham and Anderson,2002). The smaller the AICc,
the better the model. Contrary to likelihood-ratio tests, Information Criteria allow to compare models that are not nested one into the other.
3. RESULTS
3.1. Test of the a priori hypotheses
As expected in H1 (evergreenness hypothesis), evergreens let pass a lower quantity of water by TF and intercepted a higher quantity of rainfall than deciduous trees in both grow-ing period and whole-year datasets (Tab.II). For whole-year data, TF was 13.9% lower (as a proportion of total rainfall,
p < 0.001) and IW was 12.9% higher (p < 0.001) for
ev-ergreens than for deciduous species. The differences were less marked but remained significant for growing period data: 8.4% lower for TF (p < 0.001) and 9.4% higher for IW (p < 0.001). SF differences were not significant between evergreens and de-ciduous trees for growing period data but were significantly lower for conifers than for broadleaves (–4.1%; p < 0.05). Mean waterflow values for these groups are pooled in TableII. As speculated in hypothesis H2 (successional hypothesis), TF decreased by 8.8% with each successional group (p < 0.001), from pioneer to late-successional species. IW followed virtually the exact opposite trend (+8.0%; p < 0.001), while SF did not significantly differ along this successional gradient. In agreement with hypothesis H3 (bark roughness hypothe-sis), there were significant differences in SF values according to species-specific bark roughness. SF decreased for species with smooth bark to species with rougher bark (–3.7% for each group; p < 0.01).
We compared the models with the single effects related to successional status, evergreenness or coniferousness. The re-sults for both TF and IW highlighted a clear preference for the evergreenness model, which gave at least 7 AICc units less than the other models.
3.2. Tree genera comparisons
Comparisons of the tree genera that were adequately doc-umented (i.e. Fagus, Pseudotsuga, Picea and Pinus, Tab.III) across all the seasons highlighted the following differences:
– Fagus sp. let pass a higher volume of water by TF (+12.2%
of total precipitations; p < 0.001) than the mean of the other three genera; the reverse was true for Pseudotsuga sp. (–18.4%; p < 0.001);
– for SF, there was an opposition between Fagus sp. and
Pseudotsugasp. on one side, which promoted a strong SF
(resp. +6.2%; p < 0.001; and +8.6%; p < 0.01), and on the other side Picea sp. and Pinus sp., which had low SF (resp. –8.5%; p < 0.001; and –6.3%; p < 0.05);
– for IW, Fagus sp. intercepted less (–15.1%; p < 0.001)
and Pseudotsuga sp. intercepted more (+13.4%; p < 0.01) water than the mean of the other genera.
Some of these results varied seasonally. With growing period data only, TF differences between Fagus sp. and other genera were weaker (+6.6%; p < 0.05).
Table II. Estimates (± standard errors) of water flows (% of total precipitation) for the growing period only or year-round, according to certain
traits of trees from boreal and temperate forests.
Throughfall (TF) Stemflow (SF) Intercepted water (IW) Growing period Broadleaves 70.6 (±2.6) 6.3 (±1.5) 23.1 (±2.7) Conifers 63.8 (±2.3) 2.2 (±1.3) 31.4 (±2.3) Deciduous 70.6 (±2.3) 5.4 (±1.5) 23.6 (±2.3) Evergreens 62.3 (±2.2) 2.5 (±1.4) 33.1 (±2.2) Year-round Broadleaves 76.3 (±2.5) 6.9 (±1.4) 17.7 (±2.6) Conifers 64.5 (±2.2) 4.1 (±1.2) 28.7 (±2.2) Deciduous 76.6 (±2.2) 5.7 (±1.4) 17.8 (±2.2) Evergreens 62.6 (±2.1) 4.5 (±1.3) 30.7 (±2.1)
Table III. Estimates (± standard errors) of water flows (% of total precipitation) across all seasons for selected tree genera from boreal and
temperate forests.
Throughfall (TF) Stemflow (SF) Intercepted water (IW) Fagussp. 71.0 (±2.0) 12.1 (±1.5) 18.4 (±2.1) Pseudotsugasp. 48.1 (±3.4) 13.9 (±2.1) 39.8 (±3.4) Piceasp. 65.7 (±1.9) 1.2 (±1.3) 30.1 (±2.0) Pinussp. 62.6 (±2.7) 2.8 (±1.7) 30.8 (±3.4)
Table IV. Relative values of the modified Akaike Information Criteria (AICc) for the various models compared in terms of throughfall, stemflow
and intercepted water data, for models corresponding to basal area data. Data are to be read by column only. In each column, the models were fitted on the same data, i.e. datasets citing water quantity (TF, SF or IW), age and basal area. The best model is the model with the 0.0 value; a higher index indicates a worse model compared to the best model. A difference of 1 or 2 AICc units indicates models that are not clearly discriminatable based on this method. Qualitatively similar results were obtained when considering stand height or density instead of basal area.
Throughfall (TF) Stemflow (SF) Intercepted water (IW)
Evergreen× Season 27.5 6.5 0.0
Evergreen×Age 0.0 0.0 7.3
Evergreen×Basal area 30.4 5.8 11.3
Age2+Basal area 6.0 3.6 21.7
Null model 39.7 1.8 20.6
3.3. Effects of stand-level covariates on waterflows
Our results showed that, when calculated without any other covariate, there was no effect of stand density or height on TF, SF or IW, whereas there was a negative effect of basal area on TF and a positive effect on IW: –0.34% m−2ha (p < 0.001) and +0.28% m−2ha (p < 0.01), respectively. However, compared to models including other effects, the models including stand-level covariates were clearly worse for TF and IW (Tab.IV).
Data plots (Fig.1) appeared to suggest a linear relation-ship between TF and basal area, with an age-dependent in-tercept. Furthermore, relationships between TF and age or basal area appeared to be different according to the evergreen-ness (evergreen or deciduous) of the tree species (Figs. 2
and3). Finally, the relationships between SF and stand age also varied according to evergreenness (Fig.4), but in the op-posite direction to TF. The comparison of the different models based on these data inspections and defined in Section 2.4 as
“Evergreen×Season”, “Evergreen×Age”, “Evergreen×Basal area”, “Age2+Basal area”, and “null” models gave interesting results (Tab.IV). For SF data, the null model with no covariate proved the best or very close to the best. For TF and IW data, the null model was clearly worse than the best model. The best models differed for TF and IW data. For TF, the best model was consistently the model involving an interaction between evergreenness and stand age (“Evergreen×Age” as in Fig.2), whereas for IW the best model was the “Evergreen×Season” model, in line with the results in Section 3.1 and TableIII. The TF estimates in the best model (“Evergreen×Age”) were a TF decrease of 10.8% for evergreens compared to decidu-ous species at age 50, an insignificant trend in TF with age for deciduous species (−0.04 ± 0.03% y−1) and a significantly increasing trend for evergreen species (0.27 ± 0.05% y−1).
When restricting the analysis to stands over 50 years old, the best model remained “Evergreen×Season” for IW but shifted to a basal area model for TF (Tab.V).
0 2 4 6 8 10 12 20 40 60 80 100
Decid
Everg
age SFFigure 4. Relationship between stemflow (SF, % of total
precipita-tion) and age (in years) for deciduous (“Decid”) and evergreen (“Ev-erg”) tree species. Points are grouped by intervals of 15 successive age values, and the y-axis presents percentiles of the SF values of these groups based on a normal approximation (median and 95% con-fidence interval, cf. Harrell,2001), placed at the median group values for age on the x-axis.
4. DISCUSSION
4.1. Waterflows for conifers versus broadleaves, and evergreens versus deciduous species
Our analysis on published data showed that conifers inter-cepted more water than broadleaves, as highlighted in two reviews (Aussenac, 1970; Forgeard et al., 1980) reporting higher interception under coniferous species (without precise measurement), and in Larcher (1975) who reported 30% in-tercepted water (IW) for evergreen conifers and about 20% for deciduous broadleaves, values in agreement with our findings. Throughfall (TF) differences between conifers and broadleaves could appear exclusively due to LAI differences. However, Keim et al. (2006) highlighted TF differences be-tween conifers and broadleaves with similar LAI; this could be due to the fascicled needle arrangement enabling water re-tention between needle bases.
TF and IW differences were even stronger for the ever-greenness trait (evergreen versus deciduous) instead of the coniferousness trait (coniferous versus broadleaved). Even though Larix was the only deciduous conifer in our re-viewed dataset, and although the absence of evergreen and broadleaved species makes it difficult to differentiate between the effects of coniferousness and evergreenness, we found that the evergreenness models were better than the coniferousness models (cf. Sect. 3.1). Moreover, TF and IW differences be-tween evergreens and deciduous species continued to hold even in the growing period, when deciduous trees are in full leaf. This lower but consistently significant difference, which was reported by several authors (Aussenac and Boulangeat,
1980; Helliwell, 1982), indicates that (1) there is an ever-greenness effect, where the absence of leaves and presence of
Table V. Relative values of the modified Akaike Information
Crite-ria (AICc) for the various models compared in terms of throughfall and intercepted water data, for models corresponding to basal area data and stand age older than 50 y. Data are to be read by column only. In each column, the models were fitted on the same data, i.e. datasets citing water quantity (TF or IW), age and basal area. The best model is the model with the 0.0 value; a higher index indicates a worse model compared to the best model. A difference of 1 or 2 AICc units indicates models that are not clearly discriminatable based on this method. Qualitatively similar results were obtained when con-sidering stand height or density instead of basal area.
Throughfall (TF) Intercepted water (IW) Evergreen×Season 8.5 0.0 Evergreen×Age 5.8 12.0 Evergreen×Basal area 3.6 15.3
Basal area 0.0 5.7
Null model 3.3 3.2
needles in winter may lead to a higher effect over the whole year than in the growing period, and (2) there is a coniferous-ness effect, since there are differences between evergreen and deciduous species in their leafy period.
Stemflow (SF) was higher under broadleaves than under conifers. This difference may mainly be due to canopy mor-phology, since coniferous species are known to have an SF-reducing “funnel crown” (Otto,1998).
4.2. Waterflows as affected by successional status
As expected in our successional hypothesis (H2), TF de-creased and IW inde-creased with successional status. This re-sult might be partially related to responses of TF and IW to canopy cover and LAI. Globally, canopy cover increases dur-ing the natural forest cycle from pioneer to late-successional stages (Howard and Lee, 2003). This should lead to a de-crease in TF with tree successional status, as confirmed by our results. Thus, the higher TF volumes under pioneer species could be explained by their relatively clear canopy, whereas the reverse might be true for late-successional species in gen-eral, although canopy structure can be strongly affected by human interventions such as thinning or by natural distur-bances. However, this potential mechanism is in agreement with Balandier et al. (2006b) studying light interception by different species, who reported that for a same given stand basal area, pioneer species like Pinus sylvestris intercepted less light than the mid-successional Quercus petraea, which in turn intercepted less light than the late-successional Picea
abiesor Pseudotsuga meziensii. TF differences according to
successional status may be linked to a lower LAI of pioneer species, but this could not be investigated due to the lack of relevant data in most of the papers reviewed here. Yet, for some forest types, variations of TF and IW between succes-sional status categories might also be linked with more collec-tive stand-level characteristics, which may not be linked sim-ply with canopy cover or LAI.
Our results on the effect of successional status on TF re-main to be confirmed with other pioneer and late-successional species, since (i) most of our data for pioneer trees was on Be-tulasp. for which only 10 TF values were reported , and much of the data for late-successional trees was on Picea sp., and (ii) there was a rather strong correlation between successional status and evergreenness or coniferousness – almost all pio-neer species were deciduous and almost all late-successional species were evergreen. Despite this last correlation, model comparisons on our dataset indicated that evergreenness was a stronger factor than coniferousness or successional status for both TF and IW. We can therefore provisionally select the model associated with the evergreenness hypothesis (H1) as the best of the models related to our a priori hypotheses for TF and IW.
4.3. Stemflow as affected by bark roughness
Levia and Herwitz (2005) and Packham et al. (1992) as-sume that SF abundance depends on bark roughness. We iden-tified a decrease in SF with bark roughness, on a large set of tree species. Fagus sp. – the only genus in our “smooth bark” category – is well known for its smooth surface, which is con-sidered to promote SF (Otto,1998). Unfortunately, there was insufficient data to compare SF between Fagus sp. and other deciduous genera.
Bark roughness is not the only factor affecting SF abun-dance. Levia and Herwitz (2005) and Packham et al. (1992) also stated the importance of branching pattern, i.e. the diver-gence angle of the main branches with respect to trunk. This effect was not tested because we only found relevant data for a few tree species. This lack of information could be due to the slight specificity of this tree trait: branching pattern may vary largely within-species with tree age and stand density.
4.4. Waterflows and stand-level characteristics
Independently of the coniferous or broadleaved character of trees, the LAI value of a stand might be a key variable to explain waterflow variations. Bréda (1999) and Llorens and Domingo (2007) showed a correlation between LAI and TF. We could not test a potential effect of LAI on TF, SF or IW due to the lack of papers reporting LAI values. Nevertheless, we were able to test for potential effects of basal area or den-sity – which more or less influence LAI – and height on TF and IW. These stand variables had significant effects on water vol-umes, as previously reported. For instance, Pseudotsuga stud-ies showed that IW varied from 35% to 43% for stands with 500 to 3 000 stems per hectare, respectively (Aussenac,1981). Our results showed that the best statistical models de-fined involved either the interaction of evergreenness with age (“Evergreen×Age”, for TF), no effect (for SF), or the interac-tion between season and evergreenness (“Evergreen×Season” for IW). These model comparisons served to further specify the way H1 (evergreenness hypothesis) applies in different
contexts. In the case of TF, age seems to be a good factor ex-plaining TF amount. Indeed, for TF, the best model yielded differences between evergreen and deciduous species that are strongest in young stands but virtually disappear in stands of around 100 years old (Fig. 2). The reverse qualitative trend was observed on SF data – no difference for young stands and higher SF in old deciduous than old evergreen stands (Fig.4) – but with statistically much less significant results. In old stands, stand-level variables like basal area or height may even become the dominant variables (Tab. V). The ecologi-cal interpretation of these results is not completely clear: there may be an association with the effect of different basal area sampling areas between young and old forests (yielding basal area estimates that have different standard errors between the two classes), or with a true ecological effect (such as a link between basal area and crown shape or proportion of open canopy, which varies between young and old forests). The age-dependent results underline the importance of clearly distin-guishing forests according to age classes in future waterflow studies, especially for evergreen species. The results also con-cur with previous results on biodiversity that emphasize varia-tion in the identity of the dominant ecological factors between young and old stands (e.g. Bersier and Meyer,1994; Gilliam et al.,1995). However, our dataset is too small to provide firm results for old stands, and since these analyses were performed without any a priori hypothesis and after having seen the data, our results based on model comparisons must be considered as new hypotheses to be tested on independent data rather than as new results (Anderson et al.,2000).
4.5. The difficulties in estimating waterflows: rainfall characteristics and measurement methodologies
IW, TF and SF amounts are obviously dependent on the characteristics of the rain event, such as duration and quantity of precipitation per time unit (Puckett,1991; Link et al.,2004; Toba and Ohta,2005). It is generally accepted that trees in-tercept more water under scattered showers than under storm events. Bultot et al. (1972) reported a 30% decrease in IW in the Belgian Ardennes region when rainfall intensity increased from 0.1 mm in 10 min to 1 mm in 10 min. Data on Pinus
ra-diataalso showed a significant decrease in IW with amount of
rainfall during a shower, from more than 80% for a few mil-limetres of rain to less than 20% for 60 mm or more (Humbert and Najjar,1992). From a duration point of view, Olszewsky (1976) showed that the percentage of water that never reaches the soil in a broadleaved forest in Poland decreased from about 65% to less than 20% when duration of the rain event in-creased from a few minutes to 16 h.
The form of the water, e.g. snow or fog, can also modify tree IW. Mechanical properties and climate factors (wind) mean that the snow does not generally stay on the vegetation but rapidly falls away onto the soil, although this question remains debatable (Cosandey and Robinson, 2000). Furthermore, in foggy conditions, trees can exploit a process of condensation (horizontal interception) that acts as a significant water input (Burgess and Dawson,2004; Cosandey and Robinson,2000;
Waisel,1960), whereas open field records no water input dur-ing this same period.
Consequently, waterflow estimates for a same type of tree can be twice as high according to the quality of the rain events and the climate, possibly explaining the high variability in our dataset. Unfortunately, this information is generally not given in the studies we reviewed.
The heterogeneity in the values is exacerbated by the dif-ferent methods of waterflow measurement. Measuring water-flows in forests is a complex task, even using many sensors. Often, the first problem is to get a correct estimate of inci-dent rainfall. For practical reasons, this is most often done in a nearby open field area rather than above the canopy, but the two values can differ. Canopy heterogeneity makes it neces-sary to use numerous rain gauges in order to correctly assess TF, as estimation error decreases with the number of gauges. Aussenac (1981) claims that 12 to 16 rain gauges should be used per hectare, whereas other authors, in link with the ef-fects of the rain event characteristics, consider that the number of gauges required is dependent on measurement timescale, i.e. many more gauges required for daily TF estimations than for annual estimates (Humbert and Najjar,1992; Schnock and Galoux,1967).
This adds to the confusion on the values found in the liter-ature, preventing analysis at a finer scale or making it difficult to fully interpret the results.
4.6. Ecological implications of rainfall partitioning
What are the likely ecosystem consequences of these among-tree species differences in rainfall partitioning? There are two different effects to consider: (i) the modification in the total amount of water reaching the soil (amount of uninter-cepted water), and (ii) the modification in the spatial distribu-tion of water over the soil (amount of stemflow in reladistribu-tion to total unintercepted water).
Looking at point (i), to our knowledge, the effects of rain-fall partitioning on soil water availability – particularly within the perspective of tree species comparisons – has only been discussed and never studied in detail. Nihlgard (1970b) sug-gested the 19% drier soil found in a Picea abies forest than in a Fagus sylvatica forest was partly due to the greater rain-fall interception of Picea abies. Our data support this assump-tion, with +11.7% (as percent of total precipitation) more wa-ter inwa-tercepted by Picea sp. than by Fagus sp. All tree species pooled, there was 11.8% less TF under conifers than under broadleaves at year-round scale. For a region where annual rainfall is 800 mm y−1 (matching potential annual precipita-tion in temperate and boreal climates), this would equate to a difference of 94 mm in the volume of water arriving at the ground between broadleaves and conifers over a one-year period. Against a background of climate change with more droughts during the growth period, particularly in Western Europe (IPCC,2007), 94 mm is not an insignificant amount, and there may still be marked soil water differences under dif-ferent tree species with difdif-ferent impacts on tree fitness and
growth (Bréda et al.,2006). Our data may suggest that favour-ing broadleaves in forest stands could help increase soil water content. However, these conclusions must be counterbalanced by other variables. Indeed, actual soil water availability also depends on soil type and evapotranspiration (e.g. Helvey et al.,
1972). Tree transpiration can vary greatly among tree species (e.g. Bladon et al.,2006; Ewers et al.,2002; Pataki and Oren,
2003), and in non-limiting conditions of water supply, tree transpiration is linked to LAI (e.g. Bréda,1999). Therefore, high-LAI species, including a majority of the late-successional species, could have a high transpiration rate. However, stom-atal regulation of transpiration and resistance to water stress differ among species (Bréda et al.,2006), and there is also a feedback between tree water supply and LAI so that when wa-ter is limited one year, LAI is reduced the next year, which means that TF could consequently increase accordingly. Tree rooting traits, particularly rooting depth and fine root foraging strategy, can vary greatly among species (e.g. Lebourgeois and Jabiol,2002), thereby also modifying tree water uptake and soil water availability. Furthermore, rooting strategy according to successional status, for example, is still under debate (Curt and Prévosto,2003).
Looking at point (ii), the different TF and SF of different tree species can induce different spatial distributions of wa-ter and may also have different consequences, both directly in terms of tree water supply but also indirectly in terms of under-story vegetation composition and density. In particular, greater SF (e.g. broadleaves versus conifers) could increase soil water availability locally around the trunk (Levia and Frost,2003) and promote a different flora than further under the tree crown or between tree crowns. Furthermore, several tree-scale stud-ies have highlighted the effect of SF on soil chemistry. For example, the large SF of Fagus sp. is known to increase soil nutrient content near the stem (Chang and Matzner, 2000), thus influencing understory composition (Wittig and Neite,
1985). Niche theory would suggest that heterogeneity in un-derstory water distribution could lead to a more diversified flora (Crozier and Boerner,1984).
Regarding TF effects on understory vegetation, the abun-dance of vegetation in stages dominated by early successional species is often attributed to their greater light transmittance (Ross et al.,1986; Canham et al.,1994). Conversely, light is considered as the limiting factor of understory vegetation un-der Picea sp. stands (Howard and Lee,2003). These results may also be accounted for by TF variations, as soil water may also play a significant role as a limiting factor in late successional stages. Of course TF also varies with tree and understory plant phenology. In particular, the deciduous ver-sus evergreen trait necessarily plays a fundamental role, with deciduousness promoting a vernal flora in early spring when trees have no leafage. In addition, the understory vegetation can contribute greatly to soil water depletion (Balandier et al.,
2008; Bréda,1999). The relationship between understory and TF in pioneer stages will therefore be more difficult to char-acterize, since in some situations the understory vegetation is composed of high water-competing species that can take up a large proportion of available soil water (Balandier et al.,
trees on soil water content. These possibilities should be tested in further research.
Acknowledgements: This work was partly funded by the French
Centre Region. We are grateful to Martin Hermy and four anonymous reviewers for their helpful comments.
REFERENCES
Aboal J.R., Morales D., Hernández M., and Jiménez M.S., 1999. The measurement and modelling of the variation of stemflow in a laurel forest in Tenerife, Canary Islands. J. Hydrol. 221: 161–175. Abrahamsen G., Bjor K., Horntvedt R., and Tveite B., 1976. Effects
of acid precipitation on coniferous forest. In: Braekke F.H. (Ed.), Impact of acid precipitation on forest and freshwater ecosystems in Norway: summary report on the research results from the phase 1 (1972–1975) of the SNSF project. SNSF project, Oslo, pp. 36–63. Anderson D.R., Burnham K.P., and Thompson W.L., 2000. Null
hy-pothesis testing: Problems, prevalence, and an alternative. J. Wildl. Manage. 64: 912–923.
Aussenac G., 1968. Interception des précipitations par le couvert forestier. Ann. Sci. For. 25: 135–156.
Aussenac G., 1970. Aperçu du rôle de la forêt dans l’économie d’eau. Rev. For. Fr. 22: 603–618.
Aussenac G., 1981. L’interception des précipitations par les peuplements forestiers. La Houille Blanche 7/8: 531–536.
Aussenac G. and Boulangeat C., 1980. Interception des précipitations et évapotranspiration réelle dans des peuplements de feuillus (Fagus sylvaticaL.) et de résineux. Ann. Sci. For. 37: 91–107.
Balandier P., Collet C., Miller J.H., Reynolds P.E., and Zedacker S.M., 2006a. Designing forest vegetation management strategies based on the mechanisms and dynamics of crop tree competition by neigh-bouring vegetation. Forestry 79: 3–27.
Balandier P., De Montard F.X., and Curt T., 2008. Root competition for water between trees and grass in a silvopastoral plot of ten-year-old Prunus avium. In: Batish D.R., Kohli R.K.., Jose S., and Singh H.P. (Eds), Ecological basis of agroforestry, CRC Press, Boca Raton, pp. 253–270.
Balandier P., Sonohat G., Sinoquet H., Varlet-Grancher C., and Dumas Y., 2006b. Characterisation, prediction and relationships between dif-ferent wavebands of solar radiation transmitted in the understorey of even-aged oak (Quercus petraea, Q. robur) stands. Trees 20: 363–370.
Barbier S., Gosselin F., and Balandier P., 2008. Influence of tree species on understory vegetation diversity and mechanisms involved – a crit-ical review for temperate and boreal forests. For. Ecol. Manage. 254: 1–15.
Bergkvist B. and Folkeson L., 1995. The influence of tree species on acid deposition proton budgets and element fluxes in south Swedish forest ecosystems. Ecol. Bull. 44: 90–99.
Bersier L.F. and Meyer D.R., 1994. Bird assemblages in mosaic forests: the relative importance of vegetation structure and floristic composi-tion along the successional gradient. Acta Oecol. 15: 561–576. Bladon K.D., Silins U., Landhäusser S.M., and Lieffers V.J., 2006.
Differential transpiration by three boreal tree species in response to increased evaporative demand after variable retention harvesting. Agric. For. Meteorol. 138: 104–119.
Bréda N., 1999. L’indice foliaire des couverts forestiers: mesure, variabil-ité et rôle fonctionnel. Rev. For. Fr. 51: 135–150.
Bréda N., Huc R., Granier A., and Dreyer E., 2006. Temperate forest trees and stands under severe drought: a review of ecophysiological responses, adaptation processes and long-term consequences. Ann. For. Sci. 63: 625–644.
Breshears D.D., McDowell N.G., Goddard K.L., Dayem K.E., Martens S.N., Meyer C.W., and Brown K.M., 2008. Foliar absorption of in-tercepted rainfall improves woody plant water status most during drought. Ecology 89: 41–47.
Bultot F., Dupriez G., and Bodeux A., 1972. Interception de la pluie par la végétation forestière ; estimation de l’évaporation journalière à l’aide d’un modèle mathématique. J. Hydrol. 17: 193–223.
Burgess S.S.O. and Dawson T.E., 2004. The contribution of fog to the water relations of Sequoia sempervirens (D. Don): foliar uptake and prevention of dehydration. Plant Cell Environ. 27: 1023–1034. Burnham K.P. and Anderson D.R., 2002. Model selection and multimodel
inference: a practical information theoretic approach, Springer-Verlag, New York, 488 p.
Canham D.C., Finzi A.C., Pacala S.W., and Burbank D.H., 1994. Causes and consequences of resource heterogeneity in forests: interspecific variation in light transmission by canopy trees. Can. J. For. Res. 24: 337–349.
Cape J.N., Brown A.H.F., Robertson S.M.C., Howson G., and Paterson I.S., 1991. Interspecies comparisons of throughfall and stemflow at three sites in northern Britain. For. Ecol. Manage. 46: 165–178. Chang S.C. and Matzner E., 2000. Soil nitrogen turnover in proximal and
distal stem areas of European beech trees. Plant Soil 218: 117–125. Comerford N.B. and White E.H., 1977. Nutrient content of throughfall in
Paper Birch and Red Pine stands in northern Minnesota. Can. J. For. Res. 7: 556–561.
Cosandey C. and Robison M., 2000. Hydrologie continentale, Armand Colin, Paris, 360 p.
Courchesne F. and Hendershot W.H., 1988. Apport en sulfate et en eau à la surface du sol sous quatre espèces arborescentes. Naturaliste Canadien 115: 57–63.
Crozier C.R. and Boerner R.E.J., 1984. Correlations of understory herb distribution patterns with microhabitats under different tree species in a mixed mesophytic forest. Oecologia 62: 337–343.
Curt T. and Prévosto B., 2003. Rooting strategy of naturally regener-ated beech in Silver birch and Scots pine woodlands. Plant Soil 255: 265–279.
eFloras, 2008.http://efloras.org
Eidmann F.E., 1959. Die Interception in Buchen- und Fichtenbeständen; Ergebnis mehrjähriger Untersuchungen im Rothaargebirge (Sauerland). In: Symposium of Hannoversch-Münden. T. 1, Vol. 1 Water and woodlands. International Union of Geodesy and Geophysic, Gentbrugge, pp. 5–25.
Ewers B.E., Mackay D.S., Gower S.T., A.D.E., Burrows S.N., and Samanta S.S., 2002. Tree species effects on stand transpiration in northern Wisconsin. Water Resour. Res. 38: 1–11.
Forgeard F., Gloaguen J.C., and Touffet J., 1980. Interception des précipi-tations et apports au sol d’éléments minéraux par les eaux de pluie et les pluviolessivats dans une hêtraie atlantique et dans quelques peu-plements résineux de Bretagne. Ann. Sci. For. 37: 53–71.
Freedman B. and Prager U., 1986. Ambient bulk deposition, throughfall, and stemflow in a variety of forest stands in Nova Scotia. Can. J. For. Res. 16: 854–860.
Gilliam, F.S., Turrill, N.L., and Adams, M.B., 1995. Herbaceous-layer and overstory species in clear-cut and mature central Appalachian hardwood forests. Ecol. Appl. 5: 947–955.
Gurevitch J. and Hedges L.V., 2001. Meta-analysis. Combining the re-sults of independent experiments. In: Scheiner S.M. and Gurevitch J. (Eds.), Design and analysis of ecological experiments, Oxford University Press, New-York, pp. 347–369.
Harrell F.E., 2001. Regression modeling strategies, with applications to linear models, logistic regression, and survival analysis, Springer, New York, USA, xxiii + 568 p.
Heinrichs H. and Mayer R., 1977. Distribution and cycling of major and trace elements in two Central European forest ecosystems. J. Environ. Qual. 6: 402–407.
Helliwell D.R., 1982. Options in forestry. A review of literature on the effects of different tree species and sylvicultural systems on the soil, flora, fauna, visual amenity, and timber production. Packard Publishing, Chichester, 60 p.
Helvey J.D., Hewlett J.D., and Douglass J.E., 1972. Predicting Soil Moisture in the Southern Appalachians. Soil Sci. Soc. Am. Proceed. 36: 954–959.
Houdijk A.L.F.M. and Roelofs J.G.M., 1991. Deposition of acidifying and eutrophicating substances in Dutch forests. Acta Bot. Neerl. 40: 245–255.
Howard L.F. and Lee T.D., 2003. Temporal patterns of vascular plant di-versity in southeastern New Hampshire forests. For. Ecol. Manage. 185: 5–20.
Humbert J. and Najjar G., 1992. Influence de la forêt sur le cycle de l’eau en domaine tempéré – une analyse de la littérature francophone, Université Louis Pasteur, Strasbourg, 85 p.
IPCC, 2007. Summary for Policymakers. In: Solomon S. et al., (Eds.), Climate Change 2007: the physical science basis. Contribution of working group I to the fourth assessment report of the Intergovernmental Panel on Climate Change, Cambridge university press, Cambridge, pp. 1–18.
Keim R.F., Skaugset A.E., and Weiler M., 2006. Storage of water on vegetation under simulated rainfall of varying intensity. Adv. Water Resour. 29: 974–986.
Lacoste A. and Salanon R., 1991. Eléments de biogéographie et d’écologie, Nathan, Paris, 189 p.
Larcher W., 1975. Physiological plant ecology, Springer, Berlin, 513 p. Lebourgeois F. and Jabiol B., 2002. Enracinements comparés des chênes
(sessile et pédonculé) et du hêtre sur différents matériaux. Réflexions sur l’autécologie des essences. Rev. For. Fr. 54: 17–42.
Levia D.F. and Frost E.E., 2003. A review and evaluation of stemflow literature in the hydrologic and biogeochemical cycles of forested and agricultural ecosystems. J. Hydrol. 274: 1–29.
Levia D.F. and Herwitz S.R., 2005. Interspecific variation of bark water storage capacity of three deciduous tree species in relation to stem-flow yield and solute flux to forest soils. Catena 64: 117–137. Leyton L., Reynolds E.R., and Thompson F.B., 1967. Rainfall
intercep-tion in forest and moorland. In: Sopper W.E. and Lull H.W. (Eds.), Forest hydrology, Pergamon Press, Oxford, pp. 163–178.
Link T.E., Unsworth M., and Marks D., 2004. The dynamics of rainfall interception by a seasonal temperate rainforest. Agric. For. Meteorol. 124: 171–191.
Llorens P. and Domingo F., 2007. Rainfall partitioning by vegetation under Mediterranean conditions. A review of studies in Europe. J. Hydrol. 335: 37–54.
Mahendrappa M.K., 1990. Partitioning of rainwater and chemicals into throughfall and stemflow in different forest stands. For. Ecol. Manage. 30: 65–72.
Martin-Aranda J. and Coutts J.R.H., 1963. Micrometeorological observa-tions in an afforested area in Aberdeenshire: rainfall characteristics. J. Soil Sci. 14: 124–133.
Mina V.N., 1965. Leaching of certain substances by precipitation from woody plants and its importance in the biological cycle. Soviet Soil Sci. 6: 609–617.
Nihlgard B., 1970a. Precipitation, its chemical composition and effect on soil water in a beech and a spruce forest in south Sweden. Oikos 21: 208–217.
Nihlgard B., 1970b. Vegetation types of planted Spruce forest in Scania, southern Sweden. Botaniska Notiser 123: 310–347.
Noirfalise A., 1959. Sur l’interception de la pluie par le couvert dans quelques forêts belges. Bull. Soc. Roy. For. Belgique 10: 433–439. Norden U., 1991. Acid deposition and throughfall fluxes of elements as
related to tree species in deciduous forests of South Sweden. Water Air Soil Pollut. 60: 209–230.
Olszewsky J.L., 1976. Relation between the amount of rainfall reaching the forest floor and the amount of rainfall over a mixed deciduous forest. Phytocoenosis 5: 127–156.
Onof C. and Wheater H.S., 1996. Analysis of the spatial coverage of British rainfall fields. J. Hydrol. 176: 97–113.
Otto H.J., 1998. Écologie forestière, Institut pour le Développement Forestier, Paris, 397 p.
Ovington J.D., 1954. A comparison of rainfall in different woodlands. Forestry 27: 41–53.
Packham J.R., Harding D., Hilton G., and Stuttard R., 1992. Functional ecology of woodlands and forests, Kluwer academic publishers, Dordrecht, 407 p.
Parker G.G., 1983. Throughfall and stemflow in the forest nutrient cycle. Adv. Ecol. Res. 13: 58–120.
Pataki D.E. and Oren R., 2003. Species differences in stomatal control of water loss at the canopy scale in a mature bottomland deciduous forest. Adv. Water Resour. 26: 1267–1278.
Petit F. and Kamutanda K., 1984. L’interception des pluies par différents types de couverts forestiers. Bull. Soc. Géogr. Liège 20: 99–127. Puckett L.J., 1991. Spatial variability and collector requirements for
sam-pling throughfall volume and chemistry under a mixed-hardwood canopy. Can. J. For. Res. 21: 1581–1588.
Rameau J.C., Mansion D., Dumé G., Timbal J., Lecointe A., Dupont P., and Keller R., 1989. Flore forestière française. Guide écologique il-lustré. Tome 1: Plaines et collines, Institut pour le Développement Forestier, Paris, 1785 p.
Robertson S.M., Hornung M., and Kennedy V.H., 2000. Water chem-istry of throughfall and soil water under four tree species at Gisburn, northwest England, before and after felling. For. Ecol. Manage. 129: 101–117.
Robins P.C., 1974. A method of measuring the aerodynamic resistance to the transport of water vapour from forest canopies. J. Appl. Ecol. 11: 315–325.
Ross M., Flanagan L., and La Roi G., 1986. Seasonal and successional changes in light quality and quantity in the understory of boreal forest ecosystems. Can. J. Bot. 64: 2792–2799.
Schmid C.H. and Brown E.N., 2000. Bayesian hierarchical models. Methods Enzymol. 321: 305–330.
Schnock G. and Galoux A., 1967. Recherches sur l’écosystème forêt. Contribution No. 8: Réception des précipitations et écoulement le long des troncs en 1966. Bull. Inst. Roy. Sci. Nat. Belg. 43: 1–30. Toba T. and Ohta T., 2005. An observational study of the factors that
influence interception loss in boreal and temperate forests. J. Hydrol. 313: 208–220.
Vannitsem S. and Naveau P., 2007. Spatial dependences among pre-cipitation maxima over Belgium. Nonlinear Process. Geophys. 14: 621–630.
Verry F.S. and Timmons D.R., 1977. Precipitation nutrients in the open and under two forests in Minnesota. Can. J. For. Res. 7: 112–119. Voigt G.K., 1960. Distribution of rainfall under forest stands. For. Sci. 6:
2–10.
Waisel Y., 1960. Fog precipitation by trees. La-Yaaran 9: 3.
Wei X., Liu S., Zhou G., and Wang C., 2005. Hydrological processes in major types of Chinese forest. Hydrol. Process. 19: 63–75. Wells C.A., Whigham D., and Lieth H., 1972. Investigations of mineral
cycling in an upland Piedmont forest. J. Elisha Mitchell Sci. Soc. 88: 66–78.
Wittig R. and Neite H., 1985. Acid indicators around the trunk base of Fagus sylvaticain limestone and loess beechwoods: distribution pat-tern and phytosociological problems. Vegetatio 64: 113–119.