HAL Id: hal-02608072
https://hal.inrae.fr/hal-02608072
Submitted on 16 May 2020
HAL is a multi-disciplinary open access
archive for the deposit and dissemination of sci-entific research documents, whether they are pub-lished or not. The documents may come from teaching and research institutions in France or abroad, or from public or private research centers.
L’archive ouverte pluridisciplinaire HAL, est destinée au dépôt et à la diffusion de documents scientifiques de niveau recherche, publiés ou non, émanant des établissements d’enseignement et de recherche français ou étrangers, des laboratoires publics ou privés.
T. Depret, H. Piegay, V. Dugué, L. Vaudor, J.B. Faure, Jérôme Le Coz, B.
Camenen
To cite this version:
T. Depret, H. Piegay, V. Dugué, L. Vaudor, J.B. Faure, et al.. Estimating and restoring bedload transport through a run-of-river reservoir. Science of the Total Environment, Elsevier, 2019, 654, pp.1146-1157. �10.1016/j.scitotenv.2018.11.177�. �hal-02608072�
Estimating and restoring bedload transport through a run-of-river reservoir
1 2
Thomas Dépreta,b*, Hervé Piégaya, Violaine Duguéc,d, Lise Vaudora,
3
Jean-Baptiste Faurec, Jérôme Le Cozc, Benoît Camenenc
4 5
a Université de Lyon, CNRS, UMR 5600 - Environnement-Ville-Société, Site ENS de Lyon, 15 Parvis
6
René Descartes, Lyon 69342, France 7
b now Laboratoire de Géographie Physique, CNRS UMR8591, 1 Place Aristide Briand, 92195
8
Meudon, France 9
c Irstea, UR RiverLy, centre de Lyon-Villeurbanne, 5 Rue de la Doua, CS 20244, F-69625
10
Villeurbanne Cedex, France 11
d now Compagnie Nationale du Rhône, 2 rue André Bonin, 69004 Lyon, France
12 13 14
* Corresponding author, e-mail address: thomas.depret@lgp.cnrs.fr 15
16
Abstract
17
Weirs or run-of-river dams can disrupt bedload transfer with negative ecological effects 18
downstream due to sediment starvation. The way and the degree to which bedload is trapped is 19
nevertheless not straightforward and few studies have examined this topic. This study focuses on a 13-20
km-long reservoir of the Rhône River, France, created by a diversion dam equipped with bottom gates. 21
Our main objective was to determine the degree of alteration of the bedload transfer downstream and 22
to identify to which extent the implementation of Ecomorphogenic Flow (EmF), defined as 23
environmental flow whose objective is specifically to increase bedload transfer through the reservoir 24
to promote downstream habitat diversity, could increase bed mobility. The results show that the 25
potential for morphological adjustments in the reservoir was already low before dam completion 26
(1968) in response to a substantial decrease in coarse sediment supply, but that this potential was 27
progressively reduced due to the impoundment. However, the bedload transfer continuity has been at 28
least partially maintained since dam completion. According to numerical simulations, only particles 29
smaller than medium gravels ( 14 mm) could be exported downstream of the dam for relatively 30
rare discharge (50-years return-interval flood). Implementation of EmF could neatly improve the 31
bedload transfer since it would allow to strongly increase the competence: for a 2-years and a 50-years 32
return-interval floods, the maximum particle size exportable downstream is respectively 9 and 4 times 33
larger than for normal functioning of the reservoir operating. 34
35 36 37
Keywords
38
Environmental flow; Bedload continuity; Flow competence; Process-based restoration; Run-of-river 39 dam; Impoundment 40 41 Highlights 42
- Partial maintenance of bedload transfer through a run-of-river reservoir of a large gravel-bed 43
river 44
- Integrated approach combining sediment budgets and hydraulic modelling 45
- Increase of bed mobility through implementation of Environmental Flows 46
47 48
1. Introduction
49
The effects of large dams on river morphology and sediment transport have been widely studied 50
and are therefore relatively well known. Since they modify the upstream hydraulic condition in the 51
impounded sections by lowering the energy slope, dams interrupt bedload transport and sometimes 52
suspended load, inducing a progressive filling of the reservoirs (Kondolf et al., 2014; Morris et al., 53
2008). Whereas at their entrance, coarse sediment deposits form a prograding delta with grain size 54
decreasing with downstream distance, reservoirs are mainly filled by fine and more homogenous silty 55
deposits that can be settled by turbidity currents (Kostic and Parker, 2003; Lajczak, 1996; Morris and 56
Fan, 1998; Snyder et al., 2004). Downstream of dams, the effects of flow and sediment regime 57
alteration is highly variable, depending on the pre-dam context (sediment size and supply, competence 58
and capacity of the river, flow regime) and on the intensity and nature of the perturbations (Williams 59
and Wolman, 1984; Brandt, 2000; Petts and Gurnell, 2005, 2013; Schmidt and Wilcock, 2008; Curtis 60
et al., 2010; Dade et al., 2011; Grant, 2012). Most of the time, dams cause a geomorphic simplification 61
(Graf, 2006), generally induced by bed incision, a decrease in lateral mobility and bed armouring 62
(Rollet et al., 2013). Together with the modification of the flow regime, geomorphic simplification 63
results in a loss in aquatic and riparian ecological diversity (Lobrera et al., 2016; Nilsson and 64
Berggren, 2000; Rolls and Bond, 2017; Rosenberg et al., 2000). 65
Until very recently, less attention has been paid to the impacts of run-of-river dams (Csiki and 66
Rhoads, 2010, 2014; Ibisate et al. 2013), despite their widespread presence. Yet, particularly because 67
of their potential cumulative effects, series of run-of-river dams can also modify hydrological and 68
sediment dynamics, as well as ecological functions (Dessaix et al., 1995; Kibler and Tullos, 2013; 69
Anderson et al., 2015; Fencl et al., 2015). The term “run-of-river dam” still suffers from a lack of a 70
clear definition, and other words such as “weir”, “low-head dam”, “overflow dam” or “small dam” are 71
usually employed to define similar kinds of structures (Csiki and Rhoads, 2010, 2014; Fencl et al., 72
2015). Here, we will retain the definition given by Csiki and Rhoads (2010), namely a “structure that 73
extends across the width of a stream or river channel, has no mechanism inhibiting discharge of water 74
over the dam, and is of a height that generally does not exceed the elevation of the channel banks 75
upstream – i.e., water stored upstream at base flow is contained within the river channel width of a 76
stream or river channel”. Costigan et al. (2016) note that 97% of dams in the United States are run-of-77
river dams. In France, the ROE (Référentiel des Obstacles à l’Ecoulement), a large national database 78
listing most of the transverse engineering structures impeding flow, identifies more than 57,400 weirs 79
(May 2014 inventory), namely 81% of the total number of dams. Concerning their influence on 80
bedload, two main questions systematically arise. First, how much is the sediment transport altered? 81
Second, in case of partial or total interruption, what solutions could be applied to enhance or restore 82
the sediment transfer through the reservoir? In some countries of the European Union, this concern has 83
been integrated into the national legislative frame following the Water Framework Directive. In 84
France for example, authorities must now guarantee “sufficient transport” maintaining or restoring the 85
morphological and ecological structures and functions of rivers (Malavoi et al., 2011). 86
All other conditions being equal, the intensity of a run-of-river dam’s influence on the 87
morphodynamics and coarse sediment transport in impounded reaches is mainly controlled by the 88
presence or absence of bottom gates. In absence of such gates or when they are maintained closed, and 89
at least in an initial stage, all or most of the bedload can be trapped in the reservoir (Kibler et al., 2011; 90
Pearson and Pizzuto, 2015) and the grain size of coarse deposits tends to show a decreasing 91
downstream pattern (Sindelar et al., 2017). Depending on dam height, bed hydraulic characteristics 92
before impoundment, grain size and sediment yield, bedload transfer can nevertheless be preserved or 93
restored, at least for medium-term periods. For example, Csiki and Rhoads (2014) documented the 94
case of four run-of-river dams showing an absence of a statistically significant difference in the 95
percentage of sand or gravel in the bed material between upstream and downstream portions of dams, 96
indicating no coarse sediment accumulation in the reservoir and a probable preservation of the bedload 97
transfer continuity. Pearson and Pizzuto (2015) demonstrated that partial reservoir filling can be 98
sufficient to reestablish sediment transfer if a gently sloping ramp is formed just upstream of the dam. 99
If the bedload transfer is disrupted too much, and if there are no possibilities to control water level or 100
discharge, dam removal is the only option for restoring continuity (Bednarek, 2001; Magilligan et al., 101
2016). 102
The presence of bottom gates should theoretically reduce the dam’s influence on bedload, and so 103
should maintain, at least partially, sediment transfer. This is, for example, the case of the Jons dam on 104
the Rhône River (France), where opening the gates for a discharge slightly lower than the annual flood 105
allows the entire bedload to pass (Petit et al., 1996). If needed, the sediment transfer can be enhanced 106
through flushing and/or sluicing operations whose effects can be reinforced using different strategies, 107
implying a modification of the functioning of the plant associated with the dam, or construction of 108
engineering works along the reservoir, such as training walls (Bieri et al., 2012; Bizzi et al., 2015; 109
Isaac and Eldho, 2016; Sindelar et al., 2017). 110
When bedload transfer aims at being restored for ecological considerations, water releases can be 111
implemented as part of environmental flows (Poff, 2017; Poff et al., 2017; Poff and Zimmerman, 112
2010), defined in the Brisbane declaration (2007) as “the quantity, timing, and quality of the water 113
flows required to sustain freshwater and estuarine ecosystems and the human livelihoods and well-114
being that depend on them” (http://www.watercentre.org/news/declaration). If the objective of such 115
operation is specifically to increase bedload transfer to promote downstream habitat diversity, we 116
suggest using the term “Ecomorphogenic Flows” (EmF). An increase in bedload transport is supposed 117
to promote local sediment storage such as bars which should create topographic and grain size 118
variability that will provide a variety of habitats for organisms (Gaeuman, 2012; Yarnell et al., 2006), 119
a higher range of hydraulic patterns and an improved connectivity between benthic and hyporheic 120
compartments. While such process-based restoration is highly attractive, especially because of its 121
expected long-lasting and sustainable effects (Beechie et al., 2010), it can nevertheless be difficult to 122
implement depending on the context because of the frequent need for trade-off with other water uses 123
such as navigation, electricity production and irrigation. An alternative to this solution can be coarse 124
sediment augmentation downstream of dams (Arnaud et al., 2017; Gaeuman, 2012; Rheinheimer and 125
Yarnell, 2017). 126
The main objectives of this paper are to provide answers to the following questions. How much can 127
a river bed readjust in a run-of river reservoir following dam completion? What are the current 128
conditions of bed-material load entrainment in the reservoir? What is the degree of bedload transfer 129
downstream of the reservoir? Could bedload mobilization be improved for mitigating downstream 130
ecological impacts? What are the consequences of these issues for bedload management and 131
restoration? We focus on a case study, the Bourg-lès-Valence reach (Figure 1), which can serve as a 132
reference frame for the coarse sediment management of most of the other reservoirs of the Rhône 133
River (France) and more broadly of rivers influenced by run-of-river dams and presenting a strong and 134
long-standing bedload deficit. 135
136 137
2. Study site
138
2.1. Rhône River context
139
Coming from the Swiss Alps, the Rhône River flows over 812 km draining a catchment area of 140
98,500 km² (512 km long, with 90,500 km² in France, cf. Figure 1; Olivier et al., 2009; Bravard, 141
2010). The runoff at its outlet accounts for one-sixth of the total runoff into the Mediterranean Sea 142
(Fruget and Dessaix, 2003). 143
During the second half of the 20th century, the Rhône River underwent an important phase of
144
taming with the construction of 16 artificial canals parallel to the river course (Stroffek et al., 1996; 145
Olivier et al., 2009; Bravard and Gaydou, 2015). These canals were built to convey most of the annual 146
runoff to hydropower plants, improve commercial navigation and increase irrigation (Stroffek et al., 147
1996; Olivier et al., 2009; Bravard and Gaydou, 2015). Since then, the discharge in bypassed reaches 148
is residual (until 2014, between 1/3 and 1/322 of the average discharge), except during floods when 149
discharge is higher than the power plants capacity. The Rhône River is thus composed of a quasi-150
continuous series of reservoirs and bypassed reaches. Located at the upstream end of the bypassed 151
reaches, diversion dams (run-of-river dams with diversion according to the classification of 152
McManamay et al., 2016) are equipped with bottom gates that are opened during high flows, 153
theoretically allowing the transport of coarse sediments. While bedload continuity remains possible, 154
dams have modified the condition of bedload transport through the reservoirs to an unknown extent. 155
Further, bedload could actually be null due to the low frequency for which critical shear stresses are 156
exceeded. The coarse sediment yield has indeed decreased since the second half of the 19th century due
157
to the channelization of the riverbed associated with bank protections downstream of Lyon (lateral 158
dykes, weirs, groynes, cross-beams) (Bravard, 1987; Bravard and Gaydou, 2015; Poinsart, 1992; 159
Poinsart and Salvador, 1993), preventing any sediment supply by lateral erosion. It is also affected by 160
a reduction in sediment supply from the tributaries (Astrade et al., 2011; Bravard, 2002; Bravard et al., 161
1999; Bravard and Peiry, 1993; Lefort and Chapuis, 2012; Liébault et al., 1999, 2002; Liébault and 162
Piégay, 2002; Rollet et al., 2013; Warner, 2000). Due to channel incision, sediment winnowing and 163
sediment supply control, bedload is very low on most of the river course and the bed is armoured 164
(Cortier and Couvert, 2001). Nevertheless, respective impacts of each main taming phase on bedload 165
transport still need to be quantified and we do not know precisely if the bed is still able to adjust 166
vertically, since this dimension is the only one in which morphological changes can occur. To counter 167
the adverse effects of these two main taming phases, a large restoration project was initiated in the 168
1990s (Lamouroux et al., 2015) to improve main channel and former channel ecological diversity in 169
bypassed reaches. In a first step the minimal flow was increased and abandoned channels were 170
rejuvenated by dredging. More recently, a new strategy has emerged, more focused on process-based 171
restoration with riprap removal to reactivate bedload transport and shifting riverscape mosaics, raising 172
especially the question of the potential for bedload transfer through impounded reaches. 173
174
2.2 Bourg-lès-Valence reach
175
The study reach is located in the middle section of the Rhône River, just upstream of its confluence 176
with the Isère River, one of its most important tributaries (e.g., catchment size : 11,900 km2; mean
177
annual flow at the Beaumont-Monteux gauging station: 329 m3 s-1) (Figure 1). In the same way as the
178
whole Rhône river course downstream of Lyon, the Rhône in this section was constricted from the 179
mid-19th century to the first part of the 20th century with engineering works, built in three steps. 180
Dikes in the floodplain were first erected, from 1810 to 1865. Submersible dykes appeared then from 181
1862 to 1897. Finally, transverse structures as groynes and cros-beams were constructed between 1880 182
and 1908 (source: 1922 bathymetric map). 183
The study reach encompasses most of the reservoir of the Bourg-lès-Valence power plant facility 184
and extends over 9.8 km from kp 90.00 (acronym for kilometric point, which indicates the kilometric 185
distance from Lyon, with negative values upstream and positive downstream), 400 m upstream of the 186
confluence with the Doux River to kp 99.35, where the dam is located. The mean river width is 306 m 187
(range, 161–431 m) and the mean annual discharge is 1067 m3 s-1. It was computed for the 1956–2013
188
period from the daily Rhône discharge at the Valence gauging station just downstream of the Isère 189
confluence from which we subtracted the daily Isère discharge at the Beaumont-Monteux gauging 190
station located just upstream of the confluence). 191
Figure 1 - Location of the study reach in France (A), the Rhône basin (B) (1: Ternay gauging station,
193
2: Beaumont-Monteux gauging station, 3: Valence gauging station), details of the local context (C), 194
and description of the methodological combination used to characterize bed mobility in the study 195
reservoir (D). Pb affichage echelle à résoudre 196
197
The Bourg-lès-Valence power plant facility was put into service in 1968. The impounded reach, 198
which is located along the study reach, stretches from kp 86.70 to kp 99.35 (diversion dam of la 199
Roche-de-Glun; waterfall height = 11 m for the minimum bypassed discharge, see Figure 1C-D) 200
(Institution interdépartementale des bassins Rhône-Saône, 2003). The artificial canal conveys most of 201
the annual runoff to feed the Bourg-lès-Valence hydropower plant. The bypassed reach is divided into 202
a short upstream section 1 km long (kp 98.30–99.35), corresponding to the downstream end of the 203
reservoir, and an 8.5-km-long downstream section starting from the end of the reservoir (la Roche-de-204
Glun dam) (minimum discharge, 10–20 m3 s-1 until 31/12/2014, 72 m3 s-1 thereafter). One should note
205
the presence of the Isère dam (Figure 1C), which is equipped with a dam and allows diversion of 206
waters highly concentrated in suspended sediments from the headrace canal to the bypassed Rhône 207
when a large flood of the Isère River occurs (Camenen et al., 2018). The power plant’s capacity is 208
2,200 m3 s-1. When the power plant capacity is reached (e.g., 2,200 m3 s-1), the bottom gates of the
209
Roche-de-Glun dam are opened and excess discharge is diverted in the bypassed Rhône. 210
211
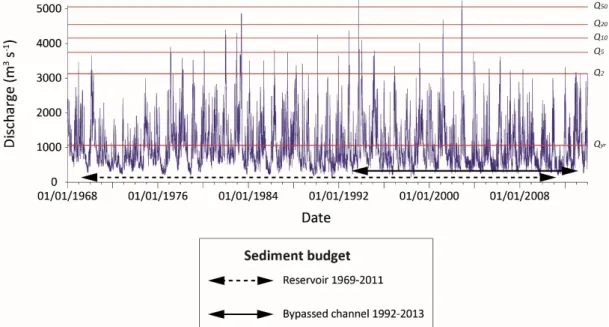
Figure 2 - Daily discharge in the study reach between 1968 and 2013 (corresponding to the daily
212
discharge at the Valence gauging station just downstream of the Isère confluence from which we 213
substrated the daily Isère discharge at the Beaumont-Monteux gauging station just upstream of the 214
confluence, see Figure 1 for location) and sediment budget computation periods . 215
216 217 218
3. Material and Methods
219
We adopted a methodological strategy combining geomorphic and hydraulic approaches. First, we 220
characterized the morphological evolution of the study reach since the end of the 19th century by
221
comparing longitudinal profiles of the thalweg. Second, we assessed if the bedload transfer continuity 222
is still at least partially preserved by establishing sediment budgets in the reservoir and in the upstream 223
section of the bypassed reach. Finally, using a 1D hydraulic model, we estimated the current condition 224
of bed mobility by determining the competence of the river along the reservoir as well as the 225
maximum grain size exportable downstream. 226
227
3.1 Bed vertical adjustment following channelization and impoundment
228
The adjustment intensity following channelization (which occurred between 1862 and 1908) and 229
impoundment (1968) was determined by comparing longitudinal profiles of the thalweg from different 230
dates every 500 m (Parrot, 2015) between kp 90.00 and kp 99.00. The vertical evolution during the 231
first decades following channelization is not documented. Bathymetry was surveyed in 1897 and 232
between 1969 and 2009. For the earliest date, data were extracted from old bathymetric maps on 233
which thalweg elevation is indicated at least every 100 m and isolines with a resolution ranging from 234
0.20 m to 0.50 m are drawn. If information relative to the accuracy of these survey are unfortunately 235
not available, it seems reasonable to assume that is was lower than their resolution. For the 1969–2009 236
period, data come from surveys conducted by the CNR. 237
238
3.2 Continuity of sediment transfer downstream the reservoir
239
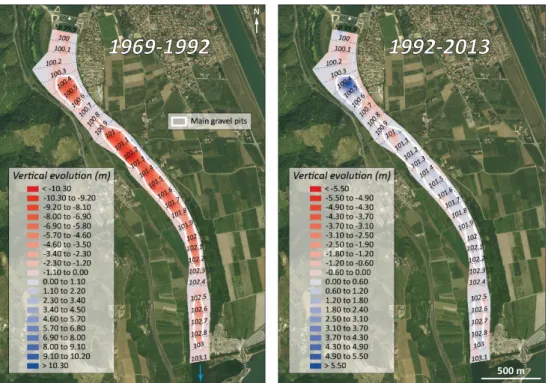
First, we computed a sediment budget in the reservoir between 1969, one year after the 240
commissioning of the hydropower plant, and 2011 (Figure 1 and Figure 2). The study reach 241
encompasses most of the reservoir until the dam (kp 90.90–99.20). Then, we computed a sediment 242
budget for the 1992-2013 period along the upstream section of the bypassed reach, from the dam to the 243
Isere confluence (kp 99.90-103.10). A recent inventory of authorized extractions indicates that gravel 244
was here intensively mined until 1992, with a removal of 1,409,000 m3 (+56,000 m3 possibly mined)
245
(Coeur, 2017). Extractions lowered sharply the bed and created three successive deep in-channel pits 246
(with a maximum deepening of 8 m, 11 m and 4.5 m from upstream to downstream) in which we 247
assume that most, or even all, of the bedload possibly passing the dam is trapped. It should thus allow 248
to estimate the bedload volume transported from the reservoir since 1992, if any. 249
250
3.2.1 Data
251
Bathymetric data were supplied by the CNR. They consist of points along cross sections 100 m 252
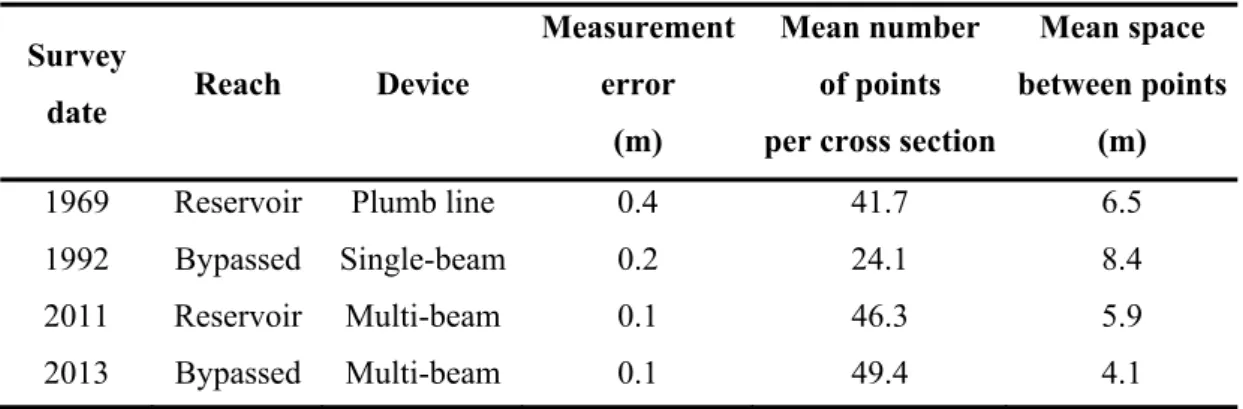
apart (Table 1). The mean point spacing along cross sections varies between 4.1 and 6.5 m. Data were 253
collected using a plumb line, a single-beam or a multi-beam sounder. The maximum measurement 254
error, given by the CNR, is respectively estimated between 0.1 and 0.4 m depending on date. 255
Table 1 - Dates of bathymetric surveys and data characteristics.
256
Survey
date Reach Device
Measurement error
(m)
Mean number of points per cross section
Mean space between points
(m)
1969 Reservoir Plumb line 0.4 41.7 6.5
1992 Bypassed Single-beam 0.2 24.1 8.4 2011 Reservoir Multi-beam 0.1 46.3 5.9 2013 Bypassed Multi-beam 0.1 49.4 4.1 257 258 3.2.2 Method 259
Sediment budget were obtained applying the method of Guertault et al. (2014) by computing area 260
evolution along each cross section for successive dates and by longitudinally interpolating evolution 261
area considering it as representative of changes that occurred between the mid-distance to the 262
upstream cross section and the mid-distance to the downstream cross section. The budget is associated 263
with a total error, composed of two terms: a measurement error and an interpolation error. It was 264
computed applying the method developed by Arnaud et al. (2017). The measurement error was 265
nevertheless determined as follows and not from repeated measurement of the same points at different 266
dates where no change was assumed, as done for example by Brasington et al. (2000) or Gaeuman 267
(2014): assuming a Gaussian distribution of the measurement error and approximating that the 268
maximum error is equal to three times the standard deviation (σ), we estimated the measurement error 269
( ) as the maximum error divided by 3. 270
271
3.3 Maximum grain size transported downstream of the reservoir: current functioning
272
and optimization scenarios
273
Using a 1D hydraulic model implemented along the Rhône River from the Lake Geneva outlet to 274
the delta (Dugué et al., 2015), we estimated for five different flood discharges the competence along 275
the reservoir as well as the maximal grain size exportable downstream the dam. It was done for the 276
current functioning of the reservoir but also for EmF scenarios aiming at maximizing the bedload 277
transfer downstream of the reservoir (Table 2). For these optimisation scenarios, we increased the 278
velocity in the reservoir by steepening the water slope along its whole course and/or we increased the 279
discharge as much as possible in the bypassed section of the reservoir (Table 1). To this end, several 280
combinations were tested by modifying at least one of the three following parameters that allow 281
controlling the water elevation and the discharge in the different reaches of the facility: the maximum 282
water elevation authorized in the bypassed section of the reservoir, the distribution of the discharge 283
between the bypassed section and the headrace canal and the opening degree of the hydropower plant 284
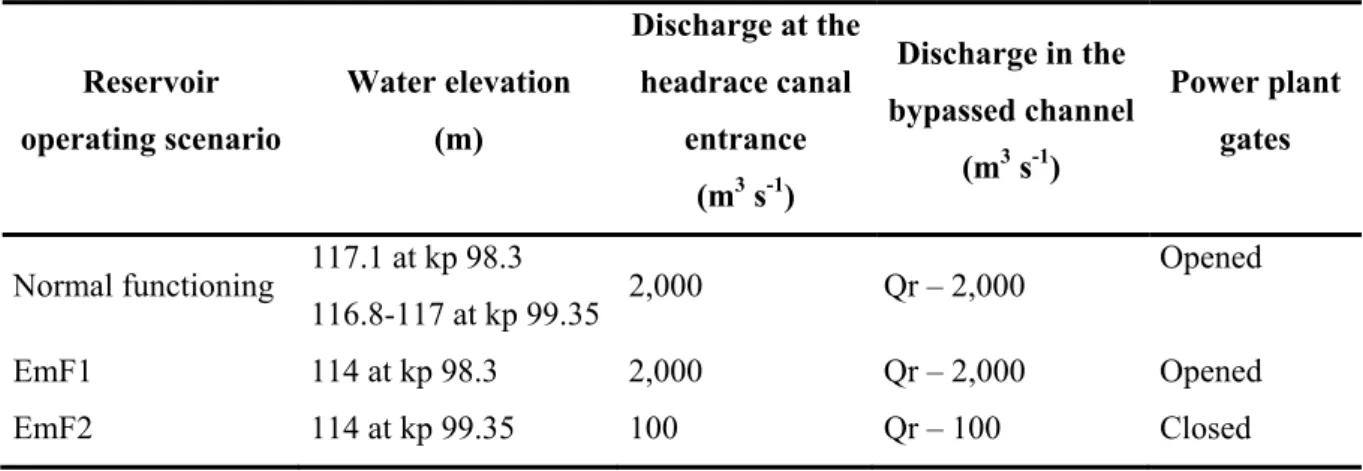
gates. We finally retained two scenarios. The first one is characterised by a lowering of the maximum 285
authorized water surface elevation at kp 98.30 (i.e. at the diversion), from 117.1 m for normal 286
functioning to 114 m. For a 50 years return-interval flood, it decreases the waterfall height at the la 287
Roche-de-Glun dam from 4.4 m for normal functioning to 0.7 m. The second scenario i) lowers the 288
water surface elevation at kp 99.35 (i.e. at the Roche-de-Glun dam), from 116.8–117 m for normal 289
functioning to 114 m, ii) derives most of the total discharge in the bypassed channel (keeping a 290
residual flow of 100 m3 s-1 in the headrace canal), iii) closes the gates of the power plant.. 291
292
Table 2 - Synthesis of the three scenarios tested with the 1D hydraulic model (Qr = Discharge in the
293 reservoir). 294 Reservoir operating scenario Water elevation (m) Discharge at the headrace canal entrance (m3 s-1) Discharge in the bypassed channel (m3 s-1) Power plant gates Normal functioning 117.1 at kp 98.3 116.8-117 at kp 99.35 2,000 Qr – 2,000 Opened EmF1 114 at kp 98.3 2,000 Qr – 2,000 Opened EmF2 114 at kp 99.35 100 Qr – 100 Closed 295 296
3.3.1 Modelling parameters and simulated discharges
297
Running in "steady state" mode, the model was built with topo-bathymetric cross sections 100 m 298
apart acquired by the CNR from 2004 to 2007. Inputs of tributaries were taken into account by 299
assigning them a constant discharge equal to their mean annual discharge (Doux = 8.6 m³ s-1; Isère =
300
329 m³ s-1). The five simulated discharge values were chosen within a range from frequent to rare
301
floods. They correspond to a return-interval (RI) at the Ternay gauging station equal to 2 (3,200 m3 s
-302
1), 5 (3,900 m3 s-1), 10 (4,300 m3 s-1), 20 (4,700 m3 s-1) and 50 (5,200 m3 s-1) years (Q
2, Q5, Q10, Q20
303
and Q50 respectively). The model predicts surface elevation and section-averaged velocity from which
304
were computed local shear stress and competence at each node of each of the cross sections of the 305
model. 306
307
3.3.2 Competence along the reservoir
308
For each simulated discharge and for each node of the model along each cross section, we 309
determined the maximum sediment size that can be mobilized. In absence of any information 310
regarding the bed state and structure, we provided two estimations of the competence, obtained with a 311
critical Shields number of 0.03 and 0.06. The first one corresponds to a loose structure of the bed 312
surface, theoretically characterizing a high mobilization frequency of the bed material. The second one 313
corresponds to a high degree of bed compaction, theoretically characterizing a low mobilization 314
frequency of the bed material. The computation steps were the following. 315
We first computed the section-averaged total shear stress from the 1D model: 316
Eq. 4 317
318
where is the water density (1000 kg m-3), is the gravitational acceleration in m s-2, is the 319
hydraulic radius in m, and is the energy slope in m m-1. 320
321
The section-averaged effective bed shear stress was then computed from the Meyer-Peter and 322
Müller equation (1948): 323
′′ / Eq. 5
324
where is the total Strickler coefficient in m1/3 s-1, and the skin Strickler coefficient (grain
325
resistance) in m1/3 s-1 was computed from the following equation: 326
/ Eq. 6 327
where is the size of bed material in millimetres for which 90% of the number of sediment clasts 328
have a smaller size. 329
330
Then, we estimated for each node i of the model the local effective bed shear stress assuming a 331
simple bed shear stress distribution based on the water depth, and assuming a homogeneous roughness 332
throughout the river section (Camenen et al., 2011): 333
′′ Eq. 7 334
where is the water height in metres at node I of the cross section, and the section-averaged water 335
depth. 336
337
The competence at each node i was finally determined as follows: 338
339
Eq. 8
340 341
where is the competence in i, in metres, is the critical Shields number and is the 342
sediment density (2650 kg m-3).
343 344
Surface 90th grain size percentile (D90) used in equation (6) was obtained from three volumetric
345
samples taken in 2012 along the reservoir by Parrot (2015). Because grain size remains unknown 346
between samples (see Figure 1 for location of the samples), we had to use an estimate on most of cross 347
sections. Two values were computed for each cross section. The first one (hereafter G1) was obtained 348
by the linear interpolation between two consecutive samplings. For the second one (hereafter G2), the 349
grain size at the location of each sample was used on a distance equal to half the distance to the next or 350
the following sample. 351
352 353
4. Results
354
4.1 Bed readjustment following channelization and impoundment
355
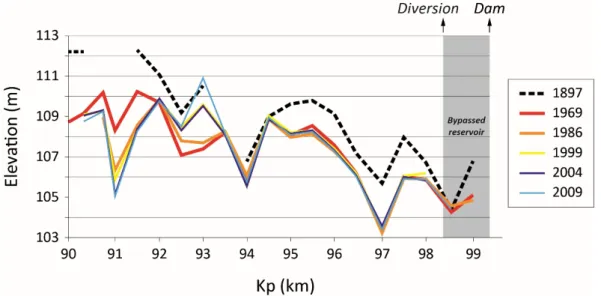
The comparison of the thalweg elevation from 1897 to 2009 clearly shows that most of the 356
geomorphic changes along the study reach occurred following the first taming phase of the Rhône 357
River (1862-1908), characterized by the channelization and the disconnection of its multi-thread bed 358
channels (Figure 3). The incision induced by the channelization is probably underestimated since the 359
first decades following it are not documented. Between 1897 and 1969, a large and widespread 360
incision occurred, with a mean value of −1.67 m (σ = 0.95 m), equivalent to −0.021 m y-1. From 1969
361
to 2009, the bed stabilized downstream of kp 94.00, with a mean vertical evolution of −0.066 m (σ = 362
0.14 m), equivalent to −0.0005 m y-1. Along this section, the incision rate is 33 times lower than that
363
of the 1897–1969 period. Upstream of kp 92.50, incision continued with a mean value of −1.64 m (σ = 364
1.1 m), equivalent to −0.042 m y-1. The incision occurred mainly before 1986. The section between kp
365
92.50 and kp 93.50 underwent aggradation, very likely resulting from sediment reinjections (silt 366
and/or sand) that occurred from 1984 to 2009 (five campaigns in 1984, 1997, 2000, 2001 and 2009). 367
368
Figure 3 - Thalweg elevation every 500 m along the reservoir from 1897 to 2009. Pb affichage ligne à
369 résoudre 370 371 372 373
374
4.3 Bedload transfer downstream of the reservoir
375
4.3.1 Sediment budget in the whole reservoir since dam completion
376
The sediment budget for the whole reservoir since dam completion is positive (6,500 m3 y-1 (±
377
800)), indicating that the bedload continuity could have been strongly, even totally, interrupted by the 378
dam (Figure 4). Nevertheless, a large part of this deposited material is composed of fine sediments 379
stored in the bypassed section of the reservoir (silt and sand) (Institution interdépartementale des 380
bassins Rhône-Saône, 2003), which must not be taken into account in our budget. Deposition of a part 381
of the suspended load can be explained by the fact that in the bypassed section of the reservoir i) the 382
water slope strongly decreases (for a Q2, 0.190/00 upstream of the diversion, 0.0170/00 downstream, i.e.
383
a 11.2-fold decrease; for a Q50, 0.360/00 upstream of the diversion, 0.260/00 downstream, i.e. a 1.4-fold
384
decrease), ii) the bed in the downstream 500 m of the section undergoes a significant enlargement 385
(twice that of upstream) with the bed 2.9 m wider than the dam, iii) the dam is located on the left side 386
of the channel (Figure 5). This type of geometric configuration usually promotes lateral recirculation 387
of flow with the eddy in the right half of the channel, contrary to the dam, and fine particle siltation. 388
By excluding these fine sediment deposits, the budget for the entire reservoir would be negative with a 389
value of 800 m3 y-1 (± 300). Furthermore, because of dredging and sediment reinjection operations
390
carried out at the end of the study period, a last modification must be applied to the budget by 391
removing the corresponding volumes. In 2005, 29,000 m3 were dredged in the center of the channel
392
from kp 92.60 to kp 93.00. Since then, no deposit was observed in this area. In 2009, 37,500 m3 of 393
sandy material were reinjected along the outer bank between kp 92.50 and kp 93.50. At the time of the 394
2011 bathymetric survey, this stock was still in place. Once this taken in consideration, the budget 395
amounts to -1,000 m3 y-1 (± 300). It induces thus that bedload transfer continuity from the reservoir to
396
the bypassed channel is currently still at least partially preserved. 397
Figure 4 - Net changes in cumulative aggraded and degraded volumes in a downstream direction over
399
time. Pb affichage ligne à résoudre 400
401
Except for the bypassed section of the reservoir mentioned above, intensity of morphological 402
changes decreased downstream, reflecting the increasing influence of the dam (Figure 4). An 403
important part of the degradation took place upstream of kp 92.00. It was then quite low and regular 404
until kp 94.50, from where it became almost null. Most of aggradation occurred upstream of kp 94.70, 405
from which it became very low until the diversion. 406
407
408
Figure 5 - Insight of morphological evolution of the reservoir in its downstream bypassed section.
409 410
4.3.2 Sediment budget in the bypassed reach since 1992
411
More evidence of the preservation of the bedload transfer continuity is given by the morphological 412
evolution downstream of the dam, along the upstream section of the bypassed channel (from the dam 413
to the confluence with the Isère canal). Here the sediment budget between 1992 and 2013 is positive, 414
with a value of 5,800 m3 y-1 (± 600) (Figure 4 and Figure 6). It means that at least such volume were
415
transported each year from the reservoir for this period. An important part of these sediments were 416
deposited along the short upstream pit (kp 100.30-100.60) (Figure 4 and Figure 6). 417
419
Figure 6 - Morphological evolution of the bypassed section downstream of the dam and upstream of
420
the Isère confluence. 421
422
4.3.3 Maximum grain size exportable from the reservoir
423
Current functioning 424
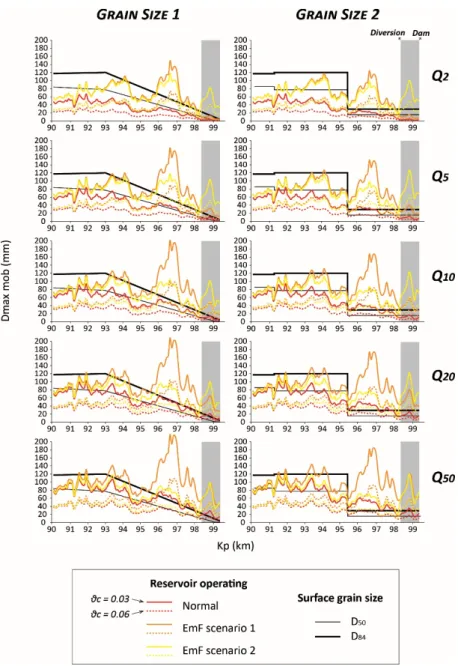
For the whole reservoir length, and whatever the simulated discharge or the grain size considered, 425
the maximum competence along each cross section decreases downstream, showing the clear 426
longitudinal influence of the dam on bedload transport (Figure 7). Furthermore, the lowest value of the 427
maximal competence is systematically located at kp 99.10. For a Q2, only very fine gravels (according
428
to classification of Blott and Pye, 2001), at best, could be exported from the reservoir (2 mm at kp 429
99.10 for a critical Shields number of 0.03 and for grain size G2) (Figure 7). For a Q50, the size
430
increases to 14 mm, which belongs to medium gravel class (kp 99.10 for a critical Shields number of 431
0.03 and for grain size G2). 432
434
Figure 7 - Longitudinal distribution of the maximum competence for the different GSD and
435 discharges. 436 437 EmF conditions 438
The effect of EmF is evident since the trend towards a downstream decrease of the competence 439
observed in conditions of normal functioning tends to ease, even to disappear, at least up to kp 97.00 440
(Figure 7). The attenuation of the trend is stronger for scenario 1 than for scenario 2 (Figure 7). For 441
scenario 1, the stronger the discharge is, the stronger the attenuation is. Conversely, for scenario 2, the 442
attenuation decreases when the discharge increases. 443
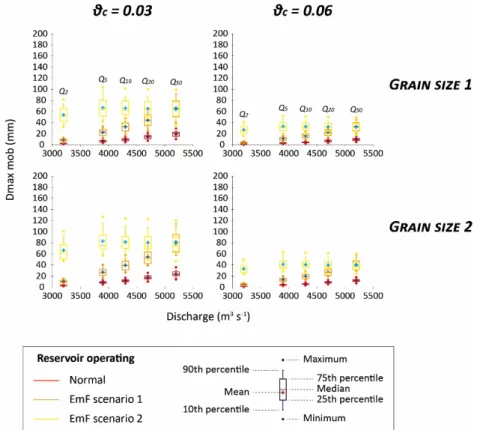
Upstream of the diversion, the best gain in maximum competence compared to normal functioning 444
is obtained for scenario 1. Downstream of the diversion, scenario 2 would be the most efficient for all 445
the simulated discharges except Q50, for which the maximum competence is slightly higher for
446
scenario 1 (Figure 7 and Figure 8). Moreover, the difference along this section between both scenarios 447
is little by little reduced when the discharge increases: while for scenario 1 the competence rises 448
systematically, for scenario 2 it reaches a maximum for a Q5 and then drops slightly (Figure 7 and
449
Figure 8). Furthermore, the maximum competence for scenario 1 at Q50 and scenario 2 at Q5 are
450
almost the same. 451
For scenario 1, the lowest value of the maximal competence in the whole reservoir is located at kp 452
99.30 whatever the grain size, except for a Q50 with grain size G2 where it is located at kp 98.20, just
453
upstream the diversion (Figure 7). Furthermore, it increases with discharge. For scenario 2, the lowest 454
value of the maximal competence is systematically located at kp 98.20 (Figure 7). It increases until Q5
455
and then drops very slightly or remains almost constant. 456
Until a Q5, the maximal sediment size that could be exported from the reservoir is obtained with
457
scenario 2 (Figure 7). For a Q2, it is equal to 18 mm (kp 98.20 for a critical Shields number of 0.03 and
458
for grain size G2), representing a nine fold increase compared to the normal functioning (2 mm). From 459
Q10, the maximal sediment size that could be exported from the reservoir is obtained with scenario 1
460
(Figure 7). For a Q50, it is equal to 56 mm at the best (kp 98.20 for a critical Shields number of 0.03
461
and for grain size G2), which is a fourfold increase compared to the normal functioning (14 mm). 462
463
Figure 8 - Box plots of the maximum competence for each of the 11 cross sections located along the
464
bypassed section of the reservoir depending on the choice of the Shields parameter and GSD. 465
466 467
5. Discussion
468
5.1 Bedload transfer in the reservoir
The slight modifications that have occurred since the dam construction in 1968 (Figure 3) indicate 470
that the bed was almost totally adjusted to the conditions imposed by its previous channelization and 471
by the bedload supply decrease from tributaries and/or that the impoundment has inhibited the 472
possibilities for further adjustment. If the second factor played a role, we should expect a decrease 473
through time in the intensity of geomorphic changes in case of similar flood intensity and duration. 474
The comparison of degraded volumes between the two periods dominated by channel degradation 475
since 1969 (1969–1986 and 1999–2004) shows such a decrease despite comparable hydrological 476
conditions: for 1969-1986 and 1999-2004, there were respectively 15 and 10 days with discharge 477
higher than the 10-year RI discharge, which is the limit below which no significant changes in the 478
reservoir, especially degradation, could occur; and for each of both periods, one flood with a RI at 479
least equal to 35 years and at least one flood with a 10-year RI were counted (Dépret et al., 2018). 480
Furthermore, while degraded volumes for 1969-1986 were distributed quite linearly along the 481
reservoir, those for 1999-2004 diminished more and more downstream (Dépret et al., 2018). This 482
indicates that the study reach had still some potential for morphological changes at the time of dam 483
completion, even if most of the readjustments following channelization were probably already 484
realized, and that such potential was progressively reduced due to the impoundment. 485
Sediment budget downstream of the dam since 1992 indicates a bedload volume coming from the 486
reservoir at least equal to 5,800 m3 y-1 (± 600). This value is 3.6 time higher than that given by Cortier
487
and Couvert (2001) (1,600 m3 y-1) and 19.7 times lower than their estimation of the annual bedload
488
before impoundment and channelization (114,000 m3). The situation could be greatly improved by 489
implementations of EmF since compared to a normal functioning of reservoir operating, the maximum 490
grain size that could be exported from the impoundment would increase from 2 cm to 18 cm for a Q2
491
and from 14 cm to 56 cm for a Q50.
492 493
5.2 Implications for coarse sediment management in rivers influenced by run-of-river
494
dams
495
On some of the bypassed reaches of the Rhône River, riprap removal, implying an increase of the 496
sediment supply to the river (Bravard and Gaydou, 2015), has been recently designed. The main goals 497
of these process-based restoration actions are to reactivate bedload transport and promote a shifting 498
riverscape mosaic to improve aquatic and riparian habitats. It raises the operational and scientific 499
questions of the degree of bedload transfer through a bypassed reach to its immediate downstream 500
reservoir, and then to the next bypassed reach. This will condition the spatial scale at which the 501
management of these sediment reinjections should be designed. 502
The present study shows that according to the most optimistic estimations, and in the absence of 503
EmF, the maximum grain size that could be exported from the reservoir would be smaller than coarse 504
gravels (according to the classification of Blott and Pye, 2001). It corresponds at the best to very fine 505
gravels (2 mm) for a Q2 and to medium gravels for a Q50 (14 mm). In case of similar competence in
other reservoirs, it means that for the coarse fraction of the bedload, each Rhône River reach 507
composed of the succession of a bypassed section and its downstream reservoir should be considered 508
as almost independent of the surrounding ones. Depending on the grain size, bedload management 509
should therefore be considered at different spatial scales: very schematically, the reach scale for sizes 510
from fine gravels to boulders and the scale of the river corridor for very fine gravels and coarse sands. 511
Anticipating what could become the reinjected sediments therefore requires determining their grain 512
size as well as the longitudinal gradient of the competence from the restored bypassed reach to the 513
dam of the downstream reservoir. 514
So that habitat improvement can be beneficial at the largest spatial and temporal scales, promotion 515
of re-erosion or sediment augmentation must be done ideally on long bypassed reaches, with injection 516
in their upstream section. Nevertheless, because a large part of the bedload, if not all of it, should not 517
pass reservoirs, it could have potential future counter-effects that need to be considered (mainly 518
limitation for navigation and flood hazard aggravation). To make the existing human constraints and 519
the maximization of ecological benefits compatible, process-based solutions can then be implemented 520
jointly with gardening. 521
A more complex and elaborate way to manage bedload and to increase sediment transfer from 522
restored bypassed reaches would be the implementation of EmF using different configurations 523
depending on the discharge and the longitudinal location of dams in bypassed sections. For dams 524
located at diversions, and whatever the discharge, EmF similar to scenario 1 presented here (no 525
modification of the discharge distribution between the bypassed channel and the headrace canal) 526
should be preferred. For dams located downstream of the diversion, as for our study case, scenario 2 527
(almost no diversion of discharge in the headrace canal) seems more appropriate for relatively frequent 528
discharges (up to a maximum Q5–Q10). This strategy should obviously be adjusted according to the
529
maximum grain size for which restoration of the continuity is planned. Broadly, these lessons 530
regarding the principles of bedload management learned from the present case study could be 531
generalized to similar rivers influenced by run-of-river dams presenting a strong and long-standing 532
bedload deficit and for which sediment replenishment is carried out. 533
534 535
6. Conclusion
536
This study aimed at estimating the potential for morphological adjustment of a run-of-river dam 537
impoundment, in which sediment augmentation was carried out, and for bedload transfer downstream. 538
Most of the geomorphic changes occurred before dam completion (1969) due to a decrease in coarse 539
sediment supply that occurred during the preceding 100 years because of channelization of the river 540
and less sediment delivery from tributaries. Since the reservoir’s creation, changes are minor but the 541
bedload transfer is still maintained. Nevertheless, only particles up to medium-coarse gravels, at best, 542
can be exported downstream of the dam (2-3 mm for a Q2 and 14-23 mm for a Q50), which is less than
the bed D50 on most of the reservoir. Implementation of Ecomorphogenic Flows, here defined as
544
environmental flows whose objective is specifically to increase bedload transfer through the reservoir 545
to promote downstream habitat diversity, could improve the situation since the maximum grain size 546
exportable from the reservoir would increase strongly (a ninefold increase for a Q2, and around a
547
fourfold increase for discharges from a Q5 to a Q50).
548
Beyond the imperative need for trade-offs with other water uses if such a measure were 549
implemented, bedload management must be considered at the scale of the entire river corridor in order 550
to precisely localize and quantify the possible sources of sediment supply as well the conditions of 551
bedload transfer (competence and capacity). This characterization of the longitudinal bedload patterns, 552
as developed in Vazquez-Tarrio et al. (2018), can identify where a coarse sediment reinjection (by 553
gravel augmentation or by promoting lateral erosion through riprap removal) could be the most 554
sustainable and thus the most efficient. Finally, the use of an integrated and interdisciplinary 555
methodological approach (sediment budget, 1D model, surface-subsurface grain-size determination) 556
appears especially relevant since it increases the robustness of the results and potentially reduces 557 uncertainty. 558 559 560 Acknowledgments 561
This study was conducted within the Rhône Sediment Observatory (OSR), a multi-partner research 562
program funded through the Plan Rhône by the European Regional Development Fund (ERDF), 563
Agence de l'eau RMC, CNR, EDF and three regional councils (Auvergne-Rhône-Alpes, PACA and 564 Occitanie). 565 566 567 References 568
Anderson, D., Moggridge, H., Warren, P., Shucksmith, J., 2015. The impacts of ‘run-of-river’ 569
hydropower on the physical and ecological condition of rivers. Water Environ. J. 29, 268-276. 570
Arnaud, F., Piégay, H., Béal, D., Collery, P., Vaudor, L., Rollet, A.J., 2017. Monitoring gravel 571
augmentation in a large regulated river and implications for process-based restoration. Earth 572
Surf. Process. Landforms 42 (13), 2147-2166. 573
Astrade, L., Jacob-Rousseau, N., Bravard, J.P., Allignol, F., Simac, L., 2011. Detailed chronology of 574
mid-altitude fluvial system response to changing climate and societies at the end of the Little Ice 575
Age (Southwestern Alps and Cévennes, France). Geomorphology 133, 100-116. 576
Beechie, T.J., Sear, D.A., Olden, J.D., Pess, G.R., Buffington, J.M., Moir, H., Roni, P., Pollock, M.M., 577
2010. Process-based principles for restoring river ecosystems. Bioscience 60 (3), 209-222. 578
Bednarek, A.T., 2001. Undamming Rivers: A review of the ecological impacts of dam removal. 579
Environ. Manag. 27 (6), 803-814. 580
Bieri, M., Muller, M., Boillat, J.L., Schleiss, A.J., 2012. Modeling of sediment management for the 581
Lavey run-of-river HPP in Switzerland. Journal of Hydraulic Engineering 138 (4), 340-347. 582
Bizzi, S., Dinh, Q., Bernardi, D., Denaro, S., Schippa, L., Soncini-Sessa, R., 2015. On the control of 583
riverbed incision induced by run-of-river power plant. Water Resour. Res. 51, 5023-5040. 584
Blott, S.J., Pye, K., 2001. GRADISTAT: A grain size distribution and statistics package for the 585
analysis of unconsolidated sediments. Earth Surf. Process. Landforms 26, 1237-1248. 586
Brandt, S.A., 2000. Classification of geomorphological effects downstream of dams. Catena 40, 375-587
401. 588
Brasington, J., Langham, J., Rumsby, B., 2003. Monitoring and modelling morphological change in a 589
braided gravel-bed river using high resolution GPS-based survey. Earth Surf. Process. 590
Landforms 25, 973-990. 591
Bravard, J.P., 1987. Le Rhône, du Léman à Lyon. La Manufacture, Lyon. 592
Bravard, J.P., 2002. Les réponses des systèmes fluviaux à une réduction des flux d'eau et de sédiments 593
sous l'effet du reboisement en montagne. La Houille Blanche 3, 68-71. 594
Bravard, J.P., 2010. Discontinuities in braided patterns: The River Rhône from Geneva to the 595
Camargue delta before river training. Geomorphology 117 (3-4), 219-233. 596
Bravard, J.P., Gaydou, P., 2015. Historical development and integrated management of the Rhône 597
River foodplain, from the Alps to the Camargue delta, France, in: Hudson, P.F., Middelkoop, H. 598
(Eds.), Geomorphic approaches to integrated floodplain management of lowland fluvial systems 599
in North America and Europe. Springer, New York, pp. 289-320. 600
Bravard, J.P., Landon, N., Peiry, J.L., Piégay, H., 1999b. Principles of engineering geomorphology for 601
managing channel erosion and bedload transport, examples from French rivers. Geomorphology 602
31, 291-311. 603
Bravard, J.P., Peiry, J.L., 1993. La disparition du tressage fluvial dans les Alpes françaises sous l’effet 604
de l’aménagement des cours d’eau (19-20ème siècle). Z. Geomorphol., Suppl.-Bd. 88, 67-79. 605
Camenen, B., Holubová, K., Lukac, M., Le Coz, J., Paquier, A., 2011. Assessment of methods used in 606
1D models for computing bed-load transport in a large river: the Danube River in Slovakia. J. 607
Hydraulic Eng., 137, 1190-1199. 608
Camenen, B., Naudet, G., Dramais, G., Paquier, A., & Le Coz, J., 2018. Evaluation of the sand 609
dynamics at the Isère-Rhône confluence, France. Sci. Total Environ., this issue. 610
Cœur, D., 2017. Etude historique des prélèvements de sédiments dans le Rhône, 1954-2010. Report + 611
annexes. 612
Cortier, B., Couvert, B., 2001. Causes et conséquences du blocage actuel de la dynamique fluviale et 613
du transit sédimentaire du Rhône. La Houille Blanche 8, 72-78. 614
Costigan, K.H., Ruffing, C.M., Perkin, J.S., Daniels, M.D., 2016. Rapid response of a sand-dominated 615
river to installation and removal of a temporary run-of-the-river dam. River Res. Applic. 32, 616
110-124. 617
Csiki, S., Rhoads, B.L., 2010. Hydraulic and geomorphological effects of run-of-river dams. Progr. 618
Phys. Geogr. 34 (6), 755-780. 619
Csiki, S., Rhoads, B.L., 2014. Influence of four run-of-river dams on channel morphology and 620
sediment characteristics in Illinois, USA. Geomorphology 206, 215-229. 621
Curtis, K.E., Renshaw, C.E., Magilligan, F.J., Dade, W.B., 2010. Temporal and spatial scales of 622
geomorphic adjustments to reduced competency following flow regulation in bedload-623
dominated systems. Geomorphology 118, 105-117. 624
Dade, W.B., Renshaw, C.E., Magilligan, F.J., 2011. Sediment transport constraints on river response 625
to regulation. Geomorphology 126, 245-251. 626
Dépret, T., Piégay, H., Dugué, V., Noirot, B., Faure, J.B., Le Coz, J., Camenen, B., Cassel, M., 627
Bultingaire, L., Yousefi, S., Michel K., 2018. Mesures et modélisations du fonctionnement 628
hydrosédimentaire du secteur de Bourg-lès-Valence – Final synthesis report, OSR4. 629
Dessaix, J., Fruget, J.F., Olivier, J.M., Beffy, J.L., 1995. Changes of the macroinvertebrate 630
communities in the dammed and by-passed sections of the French upper Rhône after regulation. 631
River Res. Applic. 10, 265-279. 632
Dugué, V., Walter, C., Andries, E., Launay, M., Le Coz, J., Camenen, B., Faure, J.-B. 2015. 633
Accounting for hydropower schemes' operation rules in the 1D hydrodynamic modeling of the 634
Rhône River from lake Genova to the Mediterranean sea. Proceedings (E-proceedings), 36th 635
IAHR Congress, 28 June - 3 July, The Hague, The Netherlands. 9 p. 636
Fencl, J.S., Mather, M.E., Costigan, K.H., Daniels, M.D., 2015. How big of an effect do small dams 637
have? Using geomorphological footprints to quantify spatial impact of low-head dams and 638
identify patterns of across-dam Variation. PLoS ONE, 10(11): e0141210. 639
doi:10.1371/journal.pone.0141210. 640
Gaeuman, D. 2012. Mitigating downstream effects of dams, in: Church, M., Biron, P., Roy, AG. 641
(Eds.), Gravel-bed rivers: Processes, tools, environments. John Wiley & Sons, Chichester, pp. 642
182-189. 643
Gaeuman, D., 2014. High-flow gravel injection for constructing designed in-channel features. River 644
Res. Applic. 30, 685-706. 645
Graf, W.L., 2006. Downstream hydrologic and geomorphic effects of large dams on American rivers. 646
Geomorphology 79, 336-360. 647
Grant, G.E., 2012. The Geomorphic response of gravel-bed rivers to dams: Perspectives and prospect, 648
in: Church, M., Biron, P., Roy, AG. (Eds.), Gravel-bed rivers: Processes, tools, environments. 649
John Wiley & Sons, Chichester, pp. 165-181. 650
Guertault, L., Camenen, B., Peteuil, C., Paquier, A., 2014. Long term evolution of a dam reservoir 651
subjected to regular flushing events. Adv. in Geosci. 39, 89-94. 652
Ibisate, A., Diaz, E., Ollero, A., Acin, V., 2013. Channel response to multiple damming in a 653
meandering river, middle and lower Aragon River (Spain). Hydrobiologia 712, 5-23. 654
Institution interdépartementale des bassins Rhône-Saône, 2003. Etude globale pour une stratégie de 655
réduction des risques dus aux crues du Rhône : 1998-2003. 656
Isaac, N., Eldho, T.I., 2016. Sediment management studies of a run-of-the river hydroelectric project 657
using numerical and physical model simulations. Intern. J. River Basin Manag. 14 (2), 165-175. 658
Jones, J.I., Murphy, J.F., Collins, A.L., Sear, D.A., Naden, P.S., Armitage, P.D., 2012. The impact of 659
fine sediment on macro-invertebrates. River Res. Applic. 1055-1071. 660
Kibler, K.M., Tullos, D.D., Kondolf, G.M., 2011. Learning from dam removal monitoring: Challenges 661
to selecting experimental design and establishing significance of outcomes. River Res. Applic. 662
27, 967-975. 663
Kibler, K.M., Tullos, D.D., 2013. Cumulative biophysical impact of small and large hydropower 664
development in Nu River, China. Water Resour. Res. 49, 3104-3118, doi:10.1002/wrcr.20243. 665
Kondolf, G.M., Gao, Y., Annandale, G.W., Morris, G.L., Jiang, E., Zhang, J., Cao, Y., Carling, P., FU, 666
K., Guo, Q., Hotchkiss, R., Peteuil, C., Sumi, T., Wang, H.W., Wang, Z., Wei, Z., Wu, B., Wu, 667
C., Yang, C.T., 2014. Sustainable sediment management in reservoirs and regulated rivers: 668
Experiences from five continents, Earth’s Future 2, 256-280, doi:10.1002/2013EF000184. 669
Kostic, S., Parker, G., 2003. Progradational sand-mud deltas in lakes and reservoirs. Part 1. Theory 670
and numerical modeling. J. Hydraul. Res. 41 (2), 127-140. 671
Lajczak, A., 1996. Modelling the long-term course of non-flushed reservoir sedimentation and 672
estimating the life of dams. Earth Surf. Process. Landforms 21, 1091-1107. 673
Lefort, P., Chapuis, M., 2012. Incidence des aménagements hydro-électriques sur la morphologie des 674
tronçons court-circuités de la Durance et du Verdon. La Houille Blanche 2, 42-48 675
Liébault, F., Clément, P., Piégay, H., Landon, N., 1999. Assessment of bedload delivery from 676
tributaries: The Drôme River case, France. Arct., Antarct., Alp. Res. 31 (1), 108-117. 677
Liébault, F., Clément, P., Piégay, H., Rogers, C.F., Kondolf, G.M., Landon, N., 2002. Contemporary 678
channel changes in the Eygues basin, southern French Prealps: the relationship of subbasin 679
variability to watershed characteristics. Geomorphology 45 (1-2), 53-66. 680
Liébault, F., Piégay, H., 2002. Causes of 20th century channel narrowing in moutain and piedmont 681
rivers of southeastern France. Earth Surf. Process. Landforms 27, 425-444. 682
Lobrera, G., Munoz, I., Lopez-Tarazon, J.A., Verciat, D., Batalla, R.J., 2016. Effects of flow 683
regulation on river bed dynamics and invertebrate communities in a Mediterranean river. 684
Hydrobiologia 784 (1), 283-304. 685
Magilligan, F.J., Graber, B.E., Nislow, K.H., Chipman, J.W., Sneddon, C.S., Fox, C.A., 2016. River 686
restoration by dam removal: Enhancing connectivity at watershed scales. Elementa: Science of 687
the Anthropocene 4, 000108, doi: 10.12952/journal.elementa.000108. 688
Malavoi, J.R., Garnier, C.C., Landon, N., Recking, A., Baran, P., 2011. Eléments de connaissance 689
pour la gestion du transport solide en rivière. ONEMA, 215 pp. 690
McManamay, R.A., Oigbokie, C.O., Kao, S.C., Bevelhimer, M.S., 2016. Classification of US 691
hydropower dams by their modes of operation. River Res. Applic. 32, 1450-1468. 692
Meyer-Peter, E., Müller, R., 1948. Formulas for bed load transport. Proceedings, 3rd Meeting of 693
International Association Hydraulic Resources, Stockholm, pp. 39-64. 694
Morris, GL., Annandale, G., Hotchkiss, R., 2008. Reservoir Sedimentation, in: Garcia, M. (Eds.), 695
Sedimentation engineering: Processes, measurements, modeling, and practice. American 696
Society of Civil Engineers Manual 110, pp. 579-612. 697
Morris, G.L., Fan, J., 1998. Reservoir sedimentation handbook: Design and management of dams, 698
reservoirs, and watersheds for sustainable use. McGraw-Hill Book Co., New York. 699
Nilsson, C., Berggren, K., 2000. Alterations of Riparian Ecosystems Caused by River Regulation. 700
BioScience 50 (9), 783-792. 701
Olivier, J. M., Carrel, G., Lamouroux, N., Dole-Olivier, M.J., Malard, F., Bravard, J.P. Amoros, C., 702
2009. The Rhône river basin. In: Robinson, C., Uehlinger, U., Tockner, K. (Eds.), Rivers of 703
Europe. Elsevier, San Diego, pp. 247-295. 704
Parrot, E., 2015. Analyse spatio-temporelle de la morphologie du chenal du Rhône du Léman à la 705
Méditerranée. Ph.D. Thesis, Lyon 3 University. 706
Pearson, A.J., Pizzuto, J., 2015. Bedload transport over run-of-river dams, Delaware, U.S.A. 707
Geomorphology 248, 382-395. 708
Petts, G.P., Gurnell, A.M., 2005. Dams and geomorphology: Research progress and future directions. 709
Geomorphology 71, 27-47. 710
Petts, G.P., Gurnell, A. 2013. Hydrogeomorphic effects of reservoirs, dams, and diversions, in: 711
Shroder J. (Editor in Chief), Wohl, E. (Eds.), Treatise on Geomorphology. Academic Press, San 712
Diego CA. Vol. 13, Fluvial Geomorphology, pp. 96-113. 713
Poff, N.L., 2017. Beyond the natural flow regime? Broadening the hydro-ecological foundation to 714
meet environmental flows challenges in a non-stationary world. Freshwater Biology, doi: 715
10.1111/fwb.13038. 716
Poff, N.L., Tharme, R.E., Arthington, A.H., 2017. Evolution of environmental flows assessment 717
science, principles, and methodologies, in: Horne, A.C., Webb, J.A., Stewardson, M.J., Richter, 718
B., Acreman, M. (Eds.), Water for the environment, from policy and science to implementation 719
and management. Academic Press, pp. 203-236. 720
Poff, N.L., Zimmerman, J.K.H., 2010. Ecological responses to altered flow regimes: a literature 721
review to inform the science and management of environmental flows. Freshwater Biology 55, 722
194-205. 723
Poinsart, D., 1992. Effets des aménagements fluviaux sur les débits liquides et solides. L'exemple du 724
Rhône dans les plaines de Miribel-Jonage et Donzère-Mondragon. Ph.D. Thesis, Lyon 3 725
University. 726