MIT Joint Program on the Science and Policy of Global Change
combines cutting-edge scientific research with independent policy analysis to provide a solid foundation for the public and private decisions needed to mitigate and adapt to unavoidable global environmental changes. Being data-driven, the Joint Program uses extensive Earth system and economic data and models to produce quantitative analysis and predictions of the risks of climate change and the challenges of limiting human influence on the environment— essential knowledge for the international dialogue toward a global response to climate change.
To this end, the Joint Program brings together an interdisciplinary group from two established MIT research centers: the Center for Global Change Science (CGCS) and the Center for Energy and Environmental Policy Research (CEEPR). These two centers—along with collaborators from the Marine Biology Laboratory (MBL) at
Woods Hole and short- and long-term visitors—provide the united vision needed to solve global challenges.
At the heart of much of the program’s work lies MIT’s Integrated Global System Model. Through this integrated model, the program seeks to discover new interactions among natural and human climate system components; objectively assess uncertainty in economic and climate projections; critically and quantitatively analyze environmental management and policy proposals; understand complex connections among the many forces that will shape our future; and improve methods to model, monitor and verify greenhouse gas emissions and climatic impacts.
This reprint is intended to communicate research results and improve public understanding of global environment and energy challenges, thereby contributing to informed debate about climate change and the economic and social implications of policy alternatives.
—Ronald G. Prinn and John M. Reilly, Joint Program Co-Directors
MIT Joint Program on the Science and Policy
of Global Change Massachusetts Institute of Technology 77 Massachusetts Ave., E19-411 T[email protected] (617) 253-7492 F (617) 253-9845 October 2016
21
st
Century Changes in U.S. Heavy
Precipitation Frequency Based on
Resolved Atmospheric Patterns
21
stCentury Changes in U.S. Heavy Precipitation
Frequency Based on Resolved Atmospheric Patterns
Xiang Gao1,2, c. Adam Schlosser1, Paul O’Gorman3, erwan Monier1 and Dara entekhabi4
Abstract: Gridded precipitation-gauge observations and global atmospheric reanalysis are combined to develop an analogue method for detecting the occurrence of heavy precipitation events based on the prevailing large-scale atmospheric conditions. Combinations of different atmospheric variables for circulation features (geopotential height and wind vector) and moisture plumes (surface specific humidity, column precipitable water, and precipitable water up to 500hPa) are examined to construct the analogue schemes for the winter (DJF) of the Pacific Coast California (PCCA) and the summer (JJA) of the Midwestern United States (MWST). The detection diagnostics of various analogue schemes are calibrated with 27-yr (1979–2005) and then validated with 9-yr (2006–2014) NASA Modern-Era Retrospective Analysis for Research and Applications (MERRA). All of the analogue schemes are found to significantly improve upon MERRA precipitation in characterizing the number and interannual variations of observed heavy precipitation events in the MWST which is one of weakest regions for MERRA summer precipitation. When evaluated with the late 20th century simulations from an ensemble of climate models participating in the Coupled Model Intercomparison Project Phase 5 (CMIP5), all analogue schemes produce model medians of heavy precipitation frequency that are more consistent with observations and have smaller inter-model discrepancies when compared with the model-based precipitation. Further, the performances of analogue schemes with vector winds are comparable to those of geopotential height, and no analogue scheme with one of three water vapor content variables is clearly superior to another. Under two radiative forcing scenarios (Representative Concentration Pathways 4.5 and 8.5), the CMIP5-based analogue schemes produce a trend in the occurrence of heavy events through the 21st century consistent with the model-based precipitation, but with smaller inter-model disparity. The strongest reduction in the disparity of the results is seen for the RCP8.5 scenario. The median trends in DJF heavy precipitation frequency for PCCA are positive, but for JJA heavy event frequency over the MWST region, the median trends are slightly negative. Overall, the presented analyses highlight the potential of the analogue as a powerful diagnostic tool for model deficiencies and its complementarity to an evaluation that considers modeled precipitation alone to assess heavy precipitation frequency. The consistency found here between projections from analogues and model precipitation increases confidence in projected heavy precipitation frequency changes in a warming climate.
1 Joint Program of the Science and Policy of Global Change, Massachusetts Institute of Technology, Cambridge, MA. 2 Corresponding author (Email: [email protected])
3 Department of Earth, Atmospheric, and Planetary Sciences, Massachusetts Institute of Technology, Cambridge, MA. 4 Department of Civil and Environmental Engineering, Massachusetts Institute of Technology, Cambridge, MA.
1. INTRODUCTION ... 2
2. DATASETS ... 3
2.1 ObSerVeD PrecIPItAtION ...3
2.2 NASA-MerrA reANALYSIS ...3
2.3 cLIMAte MODeL SIMULAtIONS ...3
2.4 DAtA PrOceSSING ...4
3. CALIBRATION AND VALIDATION OF ANALOGUE METHOD ...4
3.1 SYNOPtIc cONDItION cOMPOSIteS ...5
3.2 ANALOGUe DetectION DIAGNOStIcS ...6
3.3 cALIbrAtION AND VALIDAtION ...7
4. SIMULATED LATE 20TH CENTURY HEAVY PRECIPITATION FREQUENCY ...12
5. PROJECTED FUTURE CHANGES IN HEAVY PRECIPITATION FREQUENCY ...15
6. SUMMARY AND DISCUSSIONS ... 20
1. Introduction
Over the last two decades, the analysis of extreme pre-cipitation events has attracted much attention because of their significant impacts on natural and human systems. In particular, many studies have shown that extreme precipitation events are likely to respond substantially to anthropogenically enhanced greenhouse forcing with changes in their frequency and intensity (Wehner, 2005; Kharin et al., 2007; Sun et al., 2007; Kao and Ganguly, 2011; Min et al., 2011; Pall et al., 2011; Dominguez et al., 2012; Kharin et al., 2013; Sillmann et al., 2013; Monier and Gao, 2015). Such shifts could have dramatic ecolog-ical, economic, and sociological consequences (Field, 2012). Understanding how extreme precipitation events will change in the future—and enabling consistent and robust projections—is therefore important for the pub-lic and popub-licy makers as we prepare for consequences of climate change.
Simulations with global coupled ocean–atmosphere gen-eral circulation models (CGCMs) forced with projected greenhouse gas and aerosol emissions are the primary tools for assessing possible future changes in climate extremes. However, previous studies have shown that climate models generally do not correctly reproduce the frequency and intensity distribution of present-day pre-cipitation (Dai, 2006; Sun et al., 2006; Wilcox and Don-ner, 2007; DeAngelis et al., 2013). In future projections with comprehensive climate models, studies find that there can be a wide disagreement about the sign of change or the rate of increase in precipitation extremes among models, particularly in the tropics (Sillmann et al., 2013; O’Gorman, 2012; Kharin et al., 2007; Sun et al., 2007; Kharin et al., 2013). These results suggest that model differences appear to be the main source of uncertain-ty in the projected changes in precipitation extremes (Kharin et al., 2007). Lack of skill in climate models re-gional distributions of precipitation is largely attributed to the bulk description of poorly understood processes such as moist convection and topographical features at the sub-grid scale (1–10 km). How such processes and features are parameterized or represented with typical coarse spatial resolution of climate models (~100 km or more) varies considerably among models, and this can have a large effect on the precipitation intensity distribu-tion (e.g., Wilcox and Donner, 2007).
On the other hand, it has been shown that climate mod-els simulate fairly realistic large-scale atmospheric circu-lation features associated with heavy precipitation events compared to observations, mostly because these features represent solutions of the common well-understood and numerically resolved equations. DeAngelis et al. (2013) found that climate models from phase 3 of the Coupled Model Intercomparison Project (CMIP3) capture
realis-tically the large-scale physical mechanisms linked to ex-treme precipitation over North America although there exist biases in intensity of heavy and extreme precipita-tion among the models. Kawazoe and Gutowski Jr (2013) showed that the climate models from phase 5 of the Cou-pled Model Intercomparison Project (CMIP5) produce very heavy precipitation in the upper Mississippi region under the same synoptic conditions seen in the obser-vations. Based on regional climate model simulations of contemporary and future climates, Gutowski et al. (2008) assessed the synoptic circulations con
ducive to the extreme cold-season precipitation in the central United States. They showed that the model re-produces the observed synoptic conditions for extremes even though it exhibits difficulty in simulating the pre-cipitation intensity, and such circulation behavior is rather robust in the face of climate change. These results suggest that we can place more confidence in the quali-ty of the circulation simulation associated with extreme precipitation than in the resulting precipitation amount. In other words, analyses of such resolved atmospheric circulation features accompanying extreme events may give more robust indication or projections of their occur-rence and changes. This has been, in fact, illustrated in several studies. Hewitson and Crane (2006) demonstrat-ed that precipitation downscaldemonstrat-ed from synoptic-scale atmospheric circulation changes in multiple GCMs can provide a more consistent projection of precipitation change than the GCM’s precipitation. More recently, Gao et al. (2014) developed an “analogue method” to detect the occurrence of heavy precipitation events over the United States. The method employs composites to identify prevailing large-scale atmospheric conditions associated with widespread, heavy precipitation events at local scale. They found that the method, when applied to an ensemble of CMIP5 twentieth-century climate mod-el simulations, produces multi-modmod-el medians of heavy precipitation frequency that are more consistent with ob-servations and have smaller inter-model spreads as op-posed to using model-simulated precipitation.
This study is a continuation of the previous work on the development and evaluation of analogue methods for de-tecting heavy precipitation events under contemporary climate conditions (Gao et al., 2014). The motivations of this study are to answer such questions as follows: Is the superior performance of the analogue method exem-plified in Gao et al. (2014) specific to certain large-scale atmospheric variables or robust across choices of alter-native variables?
How does the method apply for projecting heavy precip-itation frequency in the future? Here we expand upon the analogue method presented in Gao et al. (2014) with additional atmospheric fields and examine the
perfor-mances of the augmented methods in quantifying the present-day heavy precipitation frequency and their projected changes in response to different anthropogen-ic forcing scenarios using CMIP5 model simulations. In Gao et al. (2014), the analogue detection diagnostics for heavy precipitation are constructed with the characteri-zations of 500hPa geopotential height and vertical mo-tion as well as total precipitable water in combinamo-tion. Preliminary examination of CMIP5 model simulations under future emission scenarios indicates that the overall increasing trend of geopotential height associated with climate warming dilutes the anomalous dipole struc-ture (see Figures 3–4 in Gao et al., 2014) based against the current climate, thus making the use of geopoten-tial-height anomalies problematic within the analogue framework for future climates (shown in Section 3b). Furthermore, the increases in precipitation extremes as the climate warms has been widely found to be associ-ated with atmospheric water vapor content increase (Al-len and Ingram, 2002; Pall et al., 2007). O’Gorman and Schneider (2009) examined the scaling of the total con-densation rate in extreme precipitation events and found that the amount of near-surface or low-level water vapor may be more relevant to precipitation extremes than the total column water vapor. Given these considerations, herein we evaluate how the performance of the analogue scheme constructed with 500hPa horizontal wind vec-tors compares as opposed to 500hPa geopotential height (anomalies). We are also interested in whether the ana-logue scheme is sensitive to the use of different variables to represent atmospheric water vapor content relevant to heavy precipitation as the climate warms, such as near-surface specific humidity, lower-tropospheric pre-cipitable water as represented by prepre-cipitable water up to certain level (500hPa is used here due to high orography in some regions), and total precipitable water.
The paper is organized as follows. Section 2 describes the datasets (observations, reanalysis, and climate model simulations). The development, calibration and valida-tion of the expanded analogue schemes are given in sec-tion 3. The evaluasec-tion of the expanded analogue schemes with the CMIP5 late 20th century historical climate
ex-periment is discussed in section 4. Section 5 presents comparisons of the projected changes in heavy precipi-tation frequency under two CMIP5 radiative forcing sce-narios based on the augmented analogue schemes and model-simulated precipitation, respectively. Summary and discussions are provided in section 6.
2. Datasets
2.1 Observed precipitation
Daily precipitation observations were obtained from the NOAA CPC (Climate Prediction Center) unified rain
gauge-based analysis (Higgins et al., 2000b). These ob-servations, spanning from 1948 to present, are confined to the continental United States land areas and gridded to a 0.25° × 0.25° resolution from roughly 10,000 daily station reports. The analysis was produced using an op-timal interpolation scheme and went through several types of quality control including duplicate station and buddy checks, among others. Previous assessments of gridded analyses and station observations over the Unit-ed States have shown that griddUnit-ed analyses are reliable for studies of fluctuations in daily precipitation as long as the station coverage is sufficiently dense and rigorous quality control procedures are applied to the daily data (Higgins et al., 2007).
2.2 NASA-MERRA reanalysis
We use Modern Era Retrospective-analysis for Research and Applications (MERRA) (Rienecker et al., 2011) to analyze the large-scale atmospheric circulations associ-ated with the heavy precipitation, and to calibrate and validate the analogue schemes. The MERRA use the GEOS5 atmospheric circulation model, the Catchment land surface model, and an enhanced three-dimension-al variationthree-dimension-al data assimilation (3DVAR) anthree-dimension-alysis three-dimension- algo-rithm. The data assimilation system of GEOS-5 imple-ments Incremental Analysis Updates (IAU) procedure in which the analysis correction is applied to the forecast model states gradually. This has ameliorated the spin-down problem with precipitation and greatly improved aspects of stratospheric circulation. MERRAs physical parameterizations have also been enhanced so that the shock of adjusting the model system to the assimilated data is reduced. In addition, MERRA incorporates ob-servations from NASA’s Earth Observing Systems (EOS) satellites, particularly those from EOS/Aqua, in its as-similation framework. The MERRA is updated in real time, spanning the period from 1979 to the present. The three-dimensional 3 hourly atmospheric diagnostics on 42 pressure levels are available at a 1.25° resolution. 2.3 Climate model simulations
We use the climate model simulations from the CMIP5 historical experiment (years 1850–2005) and experi-ments for the 21st century (years 2006–2100) employing
two different radiative forcing scenarios. The historical runs were forced with observed temporal variations of anthropogenic and natural forcings and, for the first time, time-evolving land cover (Taylor et al., 2012). The future scenarios, called Representative Concentration Pathways (RCPs, Moss et al., 2010), are designed to accommodate a wide range of possibilities in social and economical development consistent with specific radiative forcing paths. The estimated radiative forcing values by year 2100 are 4.5 Wm-2 and 8.5 Wm-2 in the two experiments
con-sidered here, namely RCP4.5 and RCP8.5. In comparison with Table 1 of Gao et al. (2014), model CMCC-CM and MIROC-ESM do not provide the near-surface specific humidity and vertical velocity in two RCP experiments, respectively. Removal of these two results in a total of 18 models that provide all the essential meteorological variables for the analogue schemes across the three ex-periments considered here. The models are ACCESS1-0, ACCESS1-3, BCC-CSM1-1, BCC-CSM1-1-m, BNU-ESM, CanESM2, CCSM4, CNRM-CM5, GFDL-CM3, GFDL-ESM2G, GFDL-ESM2M, CM5A-LR, IPSL-CM5A-MR, IPSL-CM5B-LR, MIROC5, MIROC-ESM-CHEM, MRICGCM3, and NorESM1-M. In this study, only one ensemble member from each model is analyzed. 2.4 Data processing
The same set of meteorological variables are assembled or derived from both the MERRA reanalysis and climate model simulations, including 500hPa geopotential height, 500hPa vector winds, 500hPa vertical velocity, near-sur-face specific humidity, total precipitable water, precipi-table water up to 500hPa and vertically integrated water vapor flux vector up to 500hPa. To account for the regions of high orography, vertical integration is performed up to 500hPa instead of 850 hPa. The vertically integrated water vapor flux is employed here to illustrate the moisture trans-port feeding the heavy precipitation events in local areas (but is not used in the development of analogue schemes). The more relevant diagnostic is vapor convergence. How-ever, its estimation based on reanalysis is problematic due to the required total mass balance correction.
The 3 hourly MERRA atmospheric diagnostics are first av-eraged into daily. All the daily fields, including the precip-itation observation as well as the precipprecip-itation and meteo-rological fields from MERRA reanalysis and each CMIP5 climate model, are then regridded to the common 2.5° × 2° resolution via area averaging. Such conservative re-gridding procedure has been shown to especially improve agreement between observed and simulated extreme pre-cipitation metrics (Chen and Knutson, 2008). The period with the greatest overlap among the CPC observations, MERRA reanalysis, and CMIP5 historical experiment is 1 January 1979 – 31 December 2005. So at each grid cell, we convert the meteorological fields of each data source to normalized anomalies based on their respective seasonal climatological mean and standard deviation of this 27-yr period. The same seasonal climatological means and stan-dard deviations are also employed to obtain the normal-ized anomalies for the meteorological fields of MERRA reanalysis from 2006 to 2014 and CMIP5 two RCP ex-periments from 2006 to 2100. We use the CPC observed precipitation to identify the heavy precipitation events, while the MERRA reanalysis is employed to construct the large-scale composites of atmospheric patterns
asso-ciated with identified heavy precipitation events, and to calibrate and validate the analogue schemes. The present-ed analogue approach allows for the characterization of the heavy precipitation frequency only. Due to the limits of deterministic predictability of weather, the reproduc-tion of the exact heavy precipitareproduc-tion date is not expect-ed when this method is appliexpect-ed to the CMIP5 historical simulations. Rather, our intent is to examine the collec-tive performances of the CMIP5 models in detecting the cumulative occurrence of the heavy precipitation events under contemporary climate, to document their potential changes as climate warms—over a given spatial and tem-poral domain of interest—based on prevailing large-scale physical mechanisms, and to evaluate how such analogue approach compares with observations and traditional model-simulated precipitation.
3. Calibration and Validation of
Analogue Method
In this study, a precipitation event is a daily amount above 1 mm/day at one observational or model grid at 2.5° × 2°. A heavy precipitation event at any gridcell is defined as the daily amount exceeding the 95th percentile of all
pre-cipitation events at that gridcell during a specific period (season). The 95th percentile of the distribution from the
precipitation observation based on contemporary climate (1979–2005) is used to extract the heavy precipitation events for MERRA reanalysis from 1979 to 2014 as well as for CMIP5 model simulations of historical experiment from 1979 to 2005 and RCP experiments from 2006 to 2100. We then pool all extracted events at all data gridcells within the regions of our interest from the observations, MERRA reanalysis and CMIP5 model simulations sepa-rately. It should be noted that at 2.5° × 2° grid resolution, we do not account for the “widespread” heavy precipita-tion events on any particular day as we did at 0.25° × 0.25° grid resolution in Gao et al. (2014).The MERRA reanal-ysis large-scale atmospheric fields from 1979 to 2005 will be used to develop and calibrate the analogue schemes, and from 2006 to 2014 to validate them.
We focus our analyses on two regions: Pacific Coast Cal-ifornia (PCCA), where heavy precipitation events occur most frequently in the winter season (DJF), and the Mid-western United States (MWST), where heavy precipitation events dominate mostly in the summer season (Figure 1 in Gao et al., 2014). The PCCA, a domain bounded by 123.75° –118.75°W and 33° –41N at the 2.5° × 2° resolu-tion (red rectangle in Figure 1a), is a typical region where large-scale flows and complex topography may contrib-ute to the occurrence of heavy precipitation events. The missing values along the land-sea boundary results in 8 gridcells from a total of 15 gridcells in red rectangle. For the Midwestern United States, we focus on the northern
US Great Plains, a region bounded by 98.75° –88.75°W and 39° –45°N at the 2.5° × 2° resolution (20 gridcells shown as red rectangle in Figure 1c), including the states of Kansas, Missouri, Nebraska, Iowa, Illinois, South Da-kota, Minnesota, and Wisconsin. This region is shown to be representative of an area of relatively high summer precipitation variance compared to elsewhere over the continent (Dirmeyer and Kinter III, 2010). Outstanding recent cases of large-scale flooding in this region include those of late spring and summer of 1993 and 2008. 3.1 Synoptic condition composites
We extract the 165 and 566 heavy precipitation events from the observations of 1979–2005 at 2.5° × 2° for the
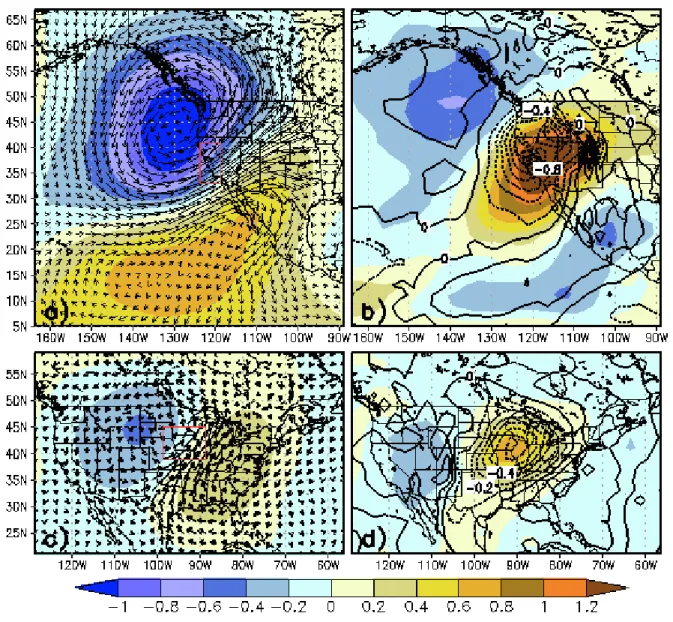
DJF of PCCA and JJA of MWST, respectively. We exam-ine various atmospheric fields, which provide insight into the preferred synoptic conditions conducive to heavy precipitation events. Figure 1 shows the composites as standardized anomalies for two regions, produced by av-eraging over the observed event days from the MERRA reanalysis.
For the PCCA region, the composite shows heavy events occurring when a deep trough develops around the east-ern North Pacific Ocean and an anomalous cyclonic cir-culation center is located to the south, promoting a more pronounced southwesterly flow of moist air from near Hawaii to the west coast of the United States (Figure 1a). Also evident are moister air and strong upward motion
Figure 1. composite fields as normalized anomalies for the Southern Pacific coast (california, PccA) in DJF: a) 500hPa geopotential
height (shaded, h500) and the vertical integrated water vapor flux vector up to 500hPa (arrow) based on 165 heavy precipitation
events at 2.5° × 2°; b) 500hPa vertical velocity (contour, w500) and total precipitable water (shaded, tpw); c) and d) are same as a)
and b) but for the Mid-western United States in JJA based on 566 heavy precipitation events at 2.5° × 2°. the red rectangles depict our study regions.
centered over the northern California and Nevada, but extending into the interior of the western United States (Figure 1b). Studies have demonstrated that major win-ter precipitation events along the Pacific Coast are mostly associated with the “Pineapple Express” (Higgins et al., 2000a; Warner et al., 2012). Compared with the Figures 1a and 1b, the standardized anomalies of all the meteoro-logical fields is weaker for the Midwestern United States. Nevertheless, the presence of lower heights to the west and higher heights to the east of the analysis region is still evident (Figure 1c). A key ingredient for heavy precipi-tation in the region is the transport of warm, moist air from the Gulf of Mexico north-northeastward across the North Central States, mainly by the general circulation as the period is not dominated by intense tropical cyclone activity (Dirmeyer and Kinter III, 2010). The origins of this moisture plume may extend farther south and east toward the Caribbean Sea. The composites exhibit char-acteristics of the “Maya Express” that fetches moisture from the subtropics or tropics, originating as evaporation from the Gulf of Mexico, eastern Mexico, or in partic-ular the Caribbean Sea, and links into the Great Plains low-level jet, creating a much longer “atmospheric river” of moisture (Dirmeyer and Kinter III, 2010). Moister air and strong upward motion are also clearly observed, cen-tered around our study region (Figure 1d).
3.2 Analogue detection diagnostics
In Gao et al. (2014), 500hPa geopotential height (herein-after referred to as h500), 500hPa vertical velocity (w500),
and total-column precipitable water (“tpw”) in combina-tion have been used to construct the analogue scheme for detecting the occurrence of heavy precipitation events. Examination of CMIP5 model simulations under future emission scenarios indicates that the overall increasing trend of geopotential height associated with climate warming disrupts the anomalous dipole structure with respect to current climate conditions, making its appli-cation in analogue methods for future climates prob-lematic (Figure 2). In contrast, the distinct patterns of composite horizontal wind vector components over the study region are fairly well preserved between the cur-rent and future climates. Here we examine the alternative analogue scheme constructed with 500hPa horizontal winds (uv500) in place of geopotential height. Besides the
total precipitable water, we also assess the performances of the analogue schemes with the use of two other atmo-spheric water vapor content variables relevant to heavy precipitation, namely near-surface specific humidity (q2m) and precipitable water up to 500hPa (tpw500). The
synoptic behaviors exhibited by the composites of three atmospheric water vapor content variables and 500hPa vertical velocity are also found to be fairly consistent between the contemporary and projected climates (not
shown). This suggests that there are no apparent shifts in circulation regimes of these atmospheric variables (ex-cept for h500) associated with heavy precipitation, and can
thus be applied for assessing the heavy precipitation fre-quency changes in a future climate. In total, we examine six combinations of atmospheric variables to construct the analogue schemes, hereafter referred to as:
hw500q2m = 500hPa height and vertical wind, as well as
near-surface specific humidity
hw500tpw500 = 500hPa height and vertical wind, as well as
total precipitable water to 500hPa
hw500tpw = 500hPa height and vertical wind, as well as
total-column precipitable water
uvw500q2m = 500hPa horizontal and vertical winds, as well
as near-surface specific humidity
uvw500tpw500 = 500hPa horizontal and vertical winds, and
total precipitable water to 500hPa
uvw500tpw = 500hPa horizontal and vertical winds, as
well as total-column precipitable water
We employ two metrics, “hotspot” and spatial anomaly correlation coefficient (SACC), to characterize the dis-tinct synoptic conditions conducive to heavy precipita-tion events shown in composites (Gao et al., 2014). The “hotspot” metric diagnoses the extent to which the com-posite of each atmospheric field is representative of any individual event. It involves the calculation of sign count at each grid cell by recording the number of individual members whose standardized anomalies have consistent signs with the composite. Hotspots are identified as the grid cells where the members used to construct the com-posites exhibit strong sign consistency with the compos-ite itself (i.e. the larger sign counts). SACC is calculated between the MERRA atmospheric fields and the corre-sponding composites for each day of DJF or JJA from 1979 to 2005. The exact region used for SACC calculation is arbitrary, but its boundaries are chosen such that the coherent structures of the composite fields are captured and centered. We then assess ten ranges of SACC thresh-olds from 0.0 to 1.0 with an interval of 0.1. We tested the SACC calculations for regions with small differences in their size and aspect ratio, but find that the resulting op-timal thresholds (described later) are insensitive to these differences for all the analogue combinations examined. We follow the same “criteria of detection” for the analogue scheme hw500tpw in Gao et al. (2014), but adapt them to
the use of horizontal vector winds and other water va-por content variables, simply by treating two horizontal wind components as two variables corresponding to the trough and ridge of geopotential height. The criteria are: 1) At least 3 out of 4 variables have consistent signs with the corresponding composites over the selected hotspot
grid cells; 2) at least 1 out of 3 variables has SACC larger than the determined thresholds; and 3) All the SACCs have to be positive. This last criterion is only applicable for DJF of PCCA as we find that it is too strict for JJA of MWST (resulting in too few heavy precipitation events in calibration).
3.3 Calibration and validation
For each of the six analogue schemes, we employ auto-matic calibration to determine the cutoff values for the number of hotspots and thresholds for SACC of all rel-evant atmospheric fields simultaneously (i.e. h, w, and tpw). The calibration is performed by running different combinations of the number of hotspots and ranges of SACC values across all relevant atmospheric fields, and
assessing the daily MERRA atmospheric fields in DJF or JJA from 1979 to 2005 to determine whether the “criteria of detection” described above is met for that day. If so, the day is considered as having a heavy precipitation event occurring. We use the “confusion matrix” commonly em-ployed in the binary classification as goodness-of-fit crite-ria to evaluate how well the analogue scheme reproduces the observed heavy precipitation events. The same mea-sures are also employed to assess how well the analogue schemes with optimized threshold values apply for the independent MERRA reanalysis from year 2006 to 2014, compared to the observed and MERRA precipitation. The confusion matrix features four values, namely, the number of true positives (TP), false positives (FP, type I
Figure 2. comparison of composite fields of 500hPa geopotential height (left column, h500), 500hPa zonal (middle column,
u500) and meridional (right column, v500) wind as normalized anomalies from MerrA reanalysis (top row) based on 566 heavy precipitation events and from an example of cMIP5 models (GFDL-eSM2M) based on extracted heavy precipitation events of 1979 to 2005 (historical) and 2067 to 2093 (rcP8.5 scenario) using models 95th percentiles of 1979–2005 for the Mid-Western United
error), true negatives (TN), and false negatives (FN, type II error). We employ five more metrics as performance measures derived from these four numbers:
i) True positive rate (TPR) TPR = TP/ (TP+FN) ii) False positive rate (FPR) FPR = FP/(FP+TN) iii) Precision (PPV) PPV = TP/(TP+FP) iv) Accuracy (ACC)
ACC = (TP +TN)/(TP+FP+TN+FN)
v) F1 score is the harmonic mean of precision and true positive rate and calculated as
F1 = 2*TP/(2*TP+FP+FN)
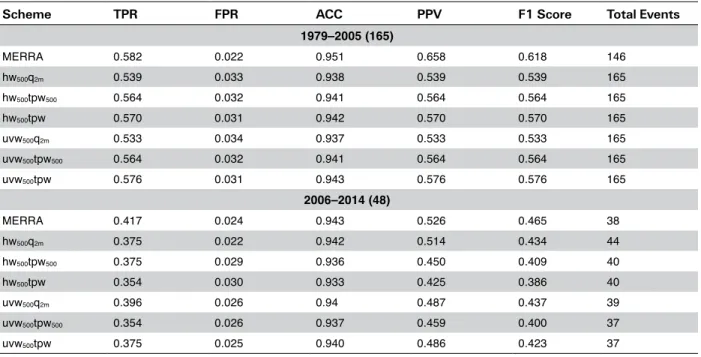
Accuracy, though widely used to evaluate the robustness of a model for making predictions, is not a reliable met-ric for the real performance of a classifier, because it will yield misleading results if the data set is unbalanced (that is, when the number of samples in different classes vary greatly) just like the case of extreme versus non-extreme events. The additional meaningful measures to evalu-ate such a classifier are precision and true positive revalu-ate, which can be thought of as measures of a classifier ex-actness and completeness, respectively. A low precision and low true positive rate indicate a large number of false positive and false negative, respectively. F1 score conveys the balance between the precision and the true positive rate. In our study, the optimal cut-off values for the num-ber of hotspots and thresholds for SACC are achieved by producing the observed number of heavy precipitation events (equal to TP+FP) with the best TPR. In this case, FP is equal to FN, and F1 score is equal to PPV and TPR. Table 1 shows performance measures of using various analogue schemes to detect heavy precipitation events in DJF of PCCA during calibration (1979–2005) and vali-dation (2006–2014) periods. MERRA precipitation has better performance metrics than the analogue schemes, with higher TPRs, PPVs, and F1 scores, slightly high-er ACCs and slightly lowhigh-er FPRs. The TPRs, PPVs, F1 scores, ACCs, and FPRs during the calibration period are 53–58%, 53–58%, 53–58%, 94% and 3% across analogue schemes in comparison with 58%, 66%, 62%, 95%, and 2% for MERRA precipitation. Performances during the validation period are worse than those during the calibra-tion period for both MERRA precipitacalibra-tion and analogue schemes, with lower TPRs, PPVs, and F1 scores. The FPRs and ACCs are fairly insensitive measures with only minor changes. The TPRs, PPVs, F1 scores, ACCs, and FPRs are 35–40%, 43–51%, 39–44%, 94% and 3% across analogue schemes in comparison with 42%, 53%, 47%, 94%, and
2% for MERRA precipitation. Little changes in ACC val-ues across two periods and two analyses (MERRA pre-cipitation versus analogue schemes) are mostly attributed to our unbalanced data set with non extreme events (and thus TN) occupying the large portion, while little changes in FPR values are associated with both the dominance of TN and the same order of detected total events (and thus FP) by two analyses. Among the three water vapor content analogues, there is no superior choice in terms of perfor-mance. During the calibration period, the schemes with tpw and tpw500 perform similarly and slightly better than
those with q2m. During the validation period, the schemes
with q2m display a marginal improvement over those with
tpw and tpw500. Furthermore, the analogue schemes with
uv500 have comparable performance to their geopotential
height counterpart during both periods.
Table 2 shows similar statistics to Table 1, but for JJA of MWST. Immediately evident is poorer performance of MERRA precipitation for MWST than for PCCA during both periods, with much lower TPRs (35% and 26% decrease for calibration and validation, respective-ly), ACCs (14% and 20% decrease), and F1 scores (27% and 20% decrease). However, PPVs are higher because they are mostly associated with the partition of predict-ed heavy precipitation events between TP and FP. Note that MERRA precipitation gives a much lower number of heavy precipitation events (30% and 20%) in comparison with the observation. Nevertheless, the relatively larger portion of TP results in higher PPVs. Bosilovich (2013) examined the interannual variations of MERRA sum-mertime precipitation over the United States and found out that the Midwest is one of the weakest regions where significant biases exist for the seasonal mean. In con-trast, the analogue schemes appear fairly robust across two regions in terms of TPRs, PPVs, and F1 scores, with comparable and better values for MWST during the cali-bration and validation period, respectively. The analogue schemes also tend to underestimate the number of heavy precipitation events during the validation period, but to a much lesser extent than MERRA precipitation. Both an-alogue schemes and MERRA precipitation exhibit per-formance degradation during the validation period, with lower TPRs, ACCs, PPVs, and F1 scores, but higher FPRs than those during the calibration period. All analogue schemes outperform MERRA precipitation during both periods in terms of TPRs and F1 scores. However, FPRs are higher due to the larger FP from the analogues than from MERRA precipitation, associated with the large dif-ference in their detected total events (566 versus 169 for calibration and 50 versus 177 – 210 for validation). As the number of “tagged” occurrences increases, both TPR and FPR are expected to increase accordingly. The ACCs remain fairly comparable between two analyses as they are largely dominated by TN. Similarly, there is no clearly
superior choice of analogues associated with three water vapor content representations in terms of various perfor-mance measures. The analogue group with uv500 shows
marginal improvements over the the group with h500
during both periods based on most of the performance measures, but the overall differences in the performance metrics among all analogue schemes are relatively small.
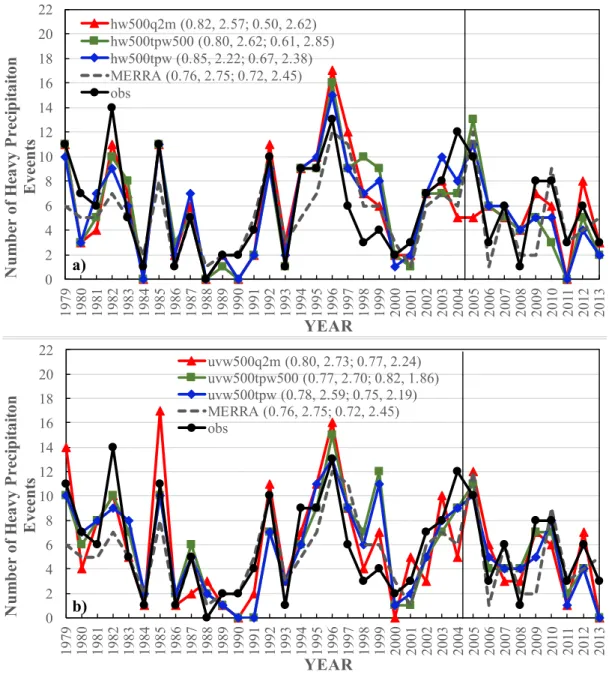
We also examine the performances of various analogue schemes in depicting the interannual variations of sea-sonal heavy precipitation frequency from 1979 to 2005 (calibration) and 2006 to 2014 (validation) as opposed to the observation and MERRA precipitation at 2.5° × 2° over two study regions (Figure 3 and Figure 4). For the DJF season, the number of heavy precipitation events
Table 1. calibration and validation statistics with different combinations of atmospheric variables to construct analogue diagnostics
for DJF of PccA. FNr and tNr are not included in the table as they can be simply derived from tPr and FPr, respectively. the numbers highlighted in light gray indicate the better performance in analogue than in MerrA precipitation. the numbers highlighted in dark gray indicate the total number of observed heavy precipitation events.
Scheme TPR FPR ACC PPV F1 Score Total Events
1979–2005 (165) MERRA 0.582 0.022 0.951 0.658 0.618 146 hw500q2m 0.539 0.033 0.938 0.539 0.539 165 hw500tpw500 0.564 0.032 0.941 0.564 0.564 165 hw500tpw 0.570 0.031 0.942 0.570 0.570 165 uvw500q2m 0.533 0.034 0.937 0.533 0.533 165 uvw500tpw500 0.564 0.032 0.941 0.564 0.564 165 uvw500tpw 0.576 0.031 0.943 0.576 0.576 165 2006–2014 (48) MERRA 0.417 0.024 0.943 0.526 0.465 38 hw500q2m 0.375 0.022 0.942 0.514 0.434 44 hw500tpw500 0.375 0.029 0.936 0.450 0.409 40 hw500tpw 0.354 0.030 0.933 0.425 0.386 40 uvw500q2m 0.396 0.026 0.94 0.487 0.437 39 uvw500tpw500 0.354 0.026 0.937 0.459 0.400 37 uvw500tpw 0.375 0.025 0.940 0.486 0.423 37
Table 2. Same as table 1, but for JJA of MWSt.
Scheme TPR FPR ACC PPV F1 Score Total Events
1979–2005 (566) MERRA 0.226 0.021 0.8071 0.757 0.348 169 hw500q2m 0.549 0.133 0.795 0.549 0.549 566 hw500tpw500 0.564 0.129 0.801 0.564 0.564 566 hw500tpw 0.560 0.130 0.800 0.560 0.560 566 uvw500q2m 0.572 0.126 0.805 0.572 0.572 566 uvw500tpw500 0.571 0.127 0.804 0.571 0.571 566 uvw500tpw 0.567 0.128 0.803 0.567 0.567 566 2006–2014 (244) MERRA 0.16 0.023 0.739 0.74 0.265 50 hw500q2m 0.410 0.132 0.733 0.565 0.475 177 hw500tpw500 451 0.137 0.742 0.579 0.507 190 hw500tpw 0.459 0.142 0.740 0.574 0.510 195 uvw500q2m 0.434 0.130 0.742 0.582 0.497 182 uvw500tpw500 0.484 0.158 0.737 0.562 0.520 210 uvw500tpw 0.475 0.154 0.737 0.563 0.515 206
for each “year” is computed based on the numbers in December of current year and the numbers in January and February of the subsequent year (thus, the results for January and February of 1979 and in December of 2014 are not included). So December 1979–February 1980 is labeled on graph as 1979, and so on. For PCCA, the analogue schemes and MERRA precipitation reproduce the observed interannual variations of winter heavy pre-cipitation frequencies reasonably well with the tempo-ral correlation above 0.75 and a root mean square error (RMSE) of less than 3 days during the calibration period (Figure 3a and 3b). All the analogue schemes
outper-form MERRA precipitation with higher correlations and smaller RMSEs. During the validation period, the ana-logue group with h500 exhibits some degradation in these
statistics, but the analogue group with uv500 consistently
shows better performances than MERRA precipitation. More specifically, we find that both MERRA precipita-tion and all or some analogue schemes capture more salient multi-year peaks, such as the heavy precipitation that occurred during February 1986, winter 1992–1993, 1996–1997, 2005–2006, and 2010–2011 as well as val-leys for winter 1984–1985, 1986–1987, 1988–1989, 1993–1994, 2000–2001 and 2008–2009. Both analyses
Figure 3. comparisons of interannual variations of seasonal heavy precipitation frequency obtained from various analogue schemes,
MerrA precipitation (MerrA), and the observation (obs) for DJF of PccA during the calibration (1979–2005) and validation (2006–2014) period. 0 2 4 6 8 10 12 14 16 18 20 22 1979 1980 1981 1982 1983 1984 1985 1986 1987 1988 1989 1990 1991 1992 1993 1994 1995 1996 1997 1998 1999 2000 2001 2002 2003 2004 2005 2006 2007 2008 2009 2010 2011 2012 2013 YEAR N um ber o f H eavy Prec ip ita ito n E vee nt s b) uvw500q2m (0.80, 2.73; 0.77, 2.24) uvw500tpw500 (0.77, 2.70; 0.82, 1.86) uvw500tpw (0.78, 2.59; 0.75, 2.19) MERRA (0.76, 2.75; 0.72, 2.45) obs 0 2 4 6 8 10 12 14 16 18 20 22 1979 1980 1981 1982 1983 1984 1985 1986 1987 1988 1989 1990 1991 1992 1993 1994 1995 1996 1997 1998 1999 2000 2001 2002 2003 2004 2005 2006 2007 2008 2009 2010 2011 2012 2013 YEAR N um ber o f H eavy Prec ip ita ito n E vee nt s a) hw500q2m (0.82, 2.57; 0.50, 2.62) hw500tpw500 (0.80, 2.62; 0.61, 2.85) hw500tpw (0.85, 2.22; 0.67, 2.38) MERRA (0.76, 2.75; 0.72, 2.45) obs
strongly underestimate the observed number of events for winter 1982–1983 (a very strong ENSO year) and win-ter 2004–2005. MERRA precipitation also significantly underestimates the observed number of events for win-ter 1979–1980, 1994–1995, and 2009–2010, but overesti-mates that for winter 1997–1998.
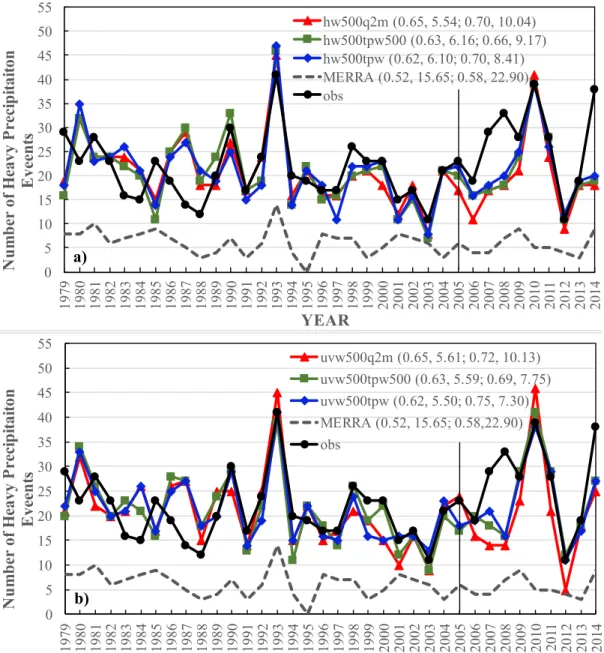
In comparison with the PCCA, MERRA precipitation in the MWST exhibits rather poor performance in tracking year-to-year variations of heavy events with lower tem-poral correlation (0.52 versus 0.76 for validation and 0.58 versus 0.72 for calibration) and much larger RMSE (15.65 versus 2.75 days and 22.90 versus 2.45 days). Immediately evident is its significant underestimation of heavy events throughout the entire 27-year period. The
performanc-es of various analogue schemperformanc-es are slightly worse than for the PCCA with lower correlations (0.62 – 0.75) and larger RMSEs (6 – 10 days). Both MERRA precipitation and analogue schemes exhibit clear degradations during the validation period in representing the magnitude of heavy precipitation frequency with much larger RMSEs than during the calibration period, but capture rather well the observed interannual variability with higher correla-tions. We see that various analogue schemes (especially with uv500) capture the heavy precipitation of 1990, 1993,
and 2010 as well as years with relatively low frequency of events such as 1988, 1991, 1997, 2003, and 2012. The an-alogue schemes significantly underestimate the observed number of events for 2007–2008 and 2014, but overesti-mate the 1980 and 1987 number of events. Nevertheless,
Figure 4. Same as Figure 3, but for JJA of MWSt the cMIP5 model precipitation (all at 2.5° × 2° resolution).
0 5 10 15 20 25 30 35 40 45 50 55 1979 1980 1981 1982 1983 1984 1985 1986 1987 1988 1989 1990 1991 1992 1993 1994 1995 1996 1997 1998 1999 2000 2001 2002 2003 2004 2005 2006 2007 2008 2009 2010 2011 2012 2013 2014 N um ber o f H eavy Prec ip ita ito n E vee nt s b) uvw500q2m (0.65, 5.61; 0.72, 10.13) uvw500tpw500 (0.63, 5.59; 0.69, 7.75) uvw500tpw (0.62, 5.50; 0.75, 7.30) MERRA (0.52, 15.65; 0.58,22.90) obs 0 5 10 15 20 25 30 35 40 45 50 55 1979 1980 1981 1982 1983 1984 1985 1986 1987 1988 1989 1990 1991 1992 1993 1994 1995 1996 1997 1998 1999 2000 2001 2002 2003 2004 2005 2006 2007 2008 2009 2010 2011 2012 2013 2014 YEAR N um ber o f H eavy Prec ip ita ito n E vee nt s a) hw500q2m (0.65, 5.54; 0.70, 10.04) hw500tpw500 (0.63, 6.16; 0.66, 9.17) hw500tpw (0.62, 6.10; 0.70, 8.41) MERRA (0.52, 15.65; 0.58, 22.90) obs
all the analogue schemes greatly improve upon the MER-RA precipitation with higher correlations and much lower RMSEs across a) the analogue scheme group with geopo-tential height (hw500*) and b) the analogue scheme group
with horizontal vector winds (uvw500*). Also shown in the
parentheses of figure legend are temporal correlations and RMSE between various schemes and observation during two periods. the calibration and validation.
4. Simulated Late 20th Century Heavy
Precipitation Frequency
Next we apply various analogue schemes to the CMIP5 late 20th century model simulations. We examine the
capabilities of current state-of-the-art climate models to realistically replicate the “resolved” large-scale atmo-spheric conditions associated with heavy precipitation events. Validating the circulation behaviors linked to these events in climate models can ensure the
assess-ment of their future changes with greater confidence. This is achieved by judging the CMIP5 model-simulated daily meteorological conditions of 1979 to 2005 against the constructed composites (e.g. Figure 1) for their sim-ilarity in terms of the established “criteria of detection” (described in Section 3b). In this way, any day when the “criteria of detection” are met would be considered as a heavy precipitation event. We then compare the results of the analogue schemes with the heavy precipitation events identified from the observations, MERRA precipitation, and Figure 5 displays the comparisons of the number of 1979–2005 winter heavy precipitation events obtained from the CMIP5 model precipitation and various ana-logue schemes across 18 climate models for the PCCA re-gion. Also included are the number of heavy precipitation events estimated from the observation and MERRA pre-cipitation. We can see that the precipitation-based anal-yses (the “pr” whisker plot) from all the models strongly
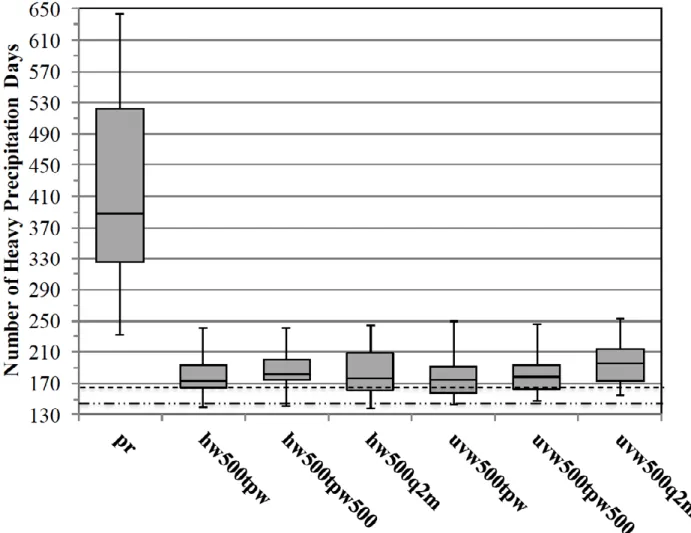
Figure 5. comparisons of the number of winter season (DJF) heavy precipitation events in PccA estimated from cMIP5
model-simulated precipitation and various analogue schemes applied to cMIP5 model-model-simulated atmospheric synoptic conditions during the period of 1979 to 2005. the whisker plot shows the minimum, the lower and upper quartile, median, and the maximum across 18 cMIP5 models. the dashed and dash-dot lines indicate the number of heavy precipitation events identified from the Higgins et al. (2000a) gridded observations and MerrA precipitation at 2.5° × 2°, respectively. the 95th percentile of 1979–2005 observed
overestimate the number of heavy precipitation events— with the observation far below the minimum. Wet bias-es over the wbias-est coast of the United Statbias-es were also ob-served for the CMIP3 20th century annual precipitation
of all the 22 participating models against the CMAP (Xie and Arkin, 1997) observation-based climatology (the Supplementary Material, Figures S8.9b in Solomon et al., 2007). However, different models exhibit a varying de-gree of overestimation and the resulting heavy precipita-tion frequencies demonstrate a wide interquartile range (IQR, ~200 days) and inter-model spread (~400 days). In contrast, the results from all the analogue schemes produce more consistent multi-model medians with the observation as well as largely reduced IQRs (25–50 days) and inter-model ranges (~100 days). Overall, the central tendencies of various analogue schemes are to overesti-mate the number of heavy precipitation events—with the observation generally falling in the first or second quar-tiles. Among three water vapor content representations, the analogue schemes with q2m have the largest IQRs.
There are no salient differences between the performanc-es of the analogue schemperformanc-es with h500 versus uv500 in terms
of the multi-model medians. MERRA precipitation is found to slightly underestimate the number of events.
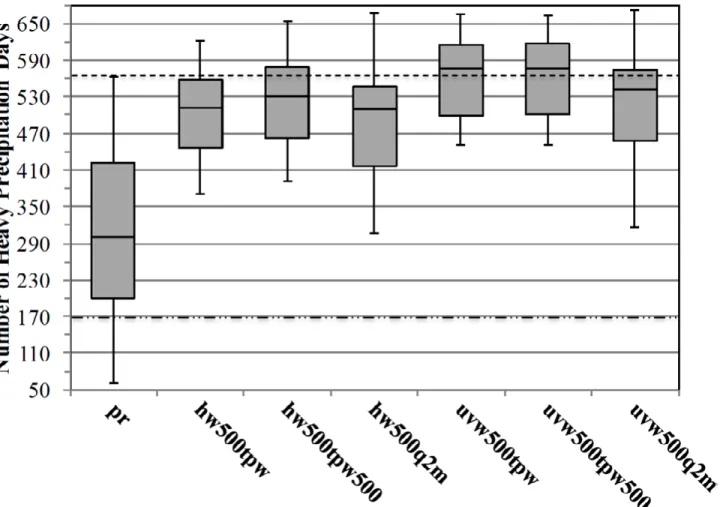
Both model precipitation and analogue schemes display larger model discrepancies for MWST than for PCCA (Figure 6). In the MWST region, recycling ratios in-crease during summer and thus inin-crease the dependence of precipitation on the boundary layer parameteriza-tion and the land model (through its representaparameteriza-tion of evaporation). The weaker performances of the analogue schemes are likely associated with the weaker influence of large-scale atmospheric dynamics in the summer and the greater role of convective processes. We can see that precipitation from all 18 models and MERRA reanaly-sis underestimates the number of heavy precipitation events with the deviations ranging from 4 to 506 days. Such dry biases over the Midwest of the United States are consistent with the CMIP3 20th century annual
pre-cipitation from a majority of models and the multi-mod-el mean (the Supplementary Material, Figures S8.9b in Solomon et al., 2007). The analogue schemes based on h500 underestimate the heavy precipitation frequencies
with the observation close to the upper quartile, while those based on uv500 show slightly better performances
with the observed frequency closer to median values. Nevertheless, the model medians of all analogue schemes are more consistent with the observed number of events
than model-simulated precipitation, and the results are also less uncertain with smaller IQRs and inter-model ranges. The analogue schemes with q2m contain the
larg-est inter-model spread, while those with tpw and tpw500
perform similarly.
Overall, all analogue schemes improve upon the model precipitation in terms of their assessment of late 20th
cen-tury heavy precipitation frequency from the perspectives of both accuracy (consistencies of multi-model medians with observation) and precision (inter-model spreads) over two study regions, regardless of water vapor content variables chosen to construct the analogue scheme. This clearly suggests that current state-of-the-art climate mod-els are capable of realistically simulating the atmospheric synoptic conditions associated with heavy precipitation events with reasonable frequencies. Accordingly, the an-alogue schemes based on resolved large-scale circulation features can provide more useful skill in detecting heavy precipitation events. The largest inter-model spread from the q2m-based analogue scheme indicates that
cli-mate models may not be well constrained in simulating q2m compared with tpw and tpw500, mostly because the
surface humidity in the climate models is usually con-trolled by a number of processes, including vertical mix-ing, surface evaporation which is affected by wind speed, soil moisture, solar heating, and other factors. Similar performances between tpw-based and tpw500-based
an-alogue schemes as well as h500-based and uv500-based are
somewhat expected as simulations of these counterparts in climate models are based on the essentially same or similar numerical ingredients. We further examine the consistency between the heavy precipitation frequen-cy from the model precipitation and from all the ana-logue schemes on a per model basis for both study re-gions. Here we only show uv500-based analogue schemes
as their h500-based counterparts give very similar results
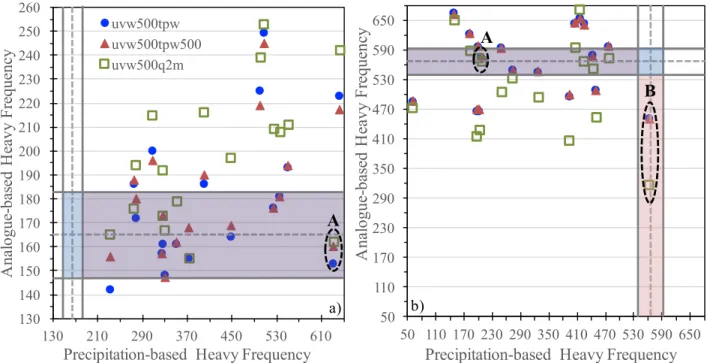
(Figure 7). Immediately evident is that climate models exhibit a wide range of levels of consistency between pre-cipitation-based and analogue-based results as well as among various analogue results over both regions. For example, “A” represents a climate model showing strong consistency and robustness in simulating three atmo-spheric water vapor content variables, reasonably fre-quent and realistically simulated atmospheric synoptic conditions linked to heavy precipitation events, and ap-parent disconnection between model precipitation and their large-scale circulation features. The resulting heavy precipitation frequencies from three analogue schemes match well with the observation, but there exists a large bias in precipitation-based frequency. On the other hand, “B” is an example of a climate model with correctly sim-ulated precipitation for the MWST region. In general the three atmospheric water vapor content variables are not always consistent with each other and the analogue vari-ables are rarely consistent with the model precipitation. One caveat in our analyses is that unforced variability is likely responsible for some of the differences between
Figure 7. Scatterplots of late 20th century cMIP5 model precipitation-based and three uv
500 analogue scheme-based heavy
precipitation frequencies for a) the DJF of PccA and b) the JJA of MWSt. the two dash gray lines represents observed heavy precipitation frequencies. the solid gray lines represent 2 standard errors of the observed heavy precipitation frequency calculated using 500 bootstrap samples.
130 140 150 160 170 180 190 200 210 220 230 240 250 260 130 210 290 370 450 530 610 A na logue -b as ed H ea vy Fr equ en cy
Precipitation-based Heavy Frequency
uvw500tpw uvw500tpw500 uvw500q2m a)
A
50 110 170 230 290 350 410 470 530 590 650 50 110 170 230 290 350 410 470 530 590 650 A na logue -b as ed H ea vy Fr equ en cyPrecipitation-based Heavy Frequency
b)
A
climate models (for both precipitation and analogues) as well as between models and observations. Nevertheless, Sriver et al. (2015) demonstrated that 34 CMIP5 mod-els yield a considerable larger spread in representing lo-cal-scale daily summer precipitation maxima than the 50 Community Earth System Model (CESM) ensemble sim-ulations with different initial conditions – and therefore implying that inter-model biases amongst CMIP models still posses a larger source of discrepancy than that from internal variability. We assess the uncertainty of observed heavy precipitation frequency by performing a block bootstrap with each year as a block (non-overlapping). Using 2 standard errors of observed heavy precipitation frequency calculated from 500 bootstrap samples (about 18 days for CASM and 27 days for MWST) as thresholds for evaluation of model performance, we further divide the climate models into four groups. The blue area rep-resents the climate models that are capable of realistically simulating precipitation and large-scale circulation con-ditions conducing the heavy precipitation events, while the white area is characteristic of those that are rather poor in both regards. The purple area represents climate models with realistically simulated synoptic conditions but not precipitation, while the pink is opposite to the purple. In our case, none of climate models fall into the blue area over both study regions and only one into the pink area in the MWST, mainly due to the poorly simu-lated precipitation from CMIP5 models. A majority of models fall into the purple region with some or all an-alogue-based frequencies consistent with observation, while several fall into the white region with none of an-alogue-based frequencies close to the observation. Fur-thermore, regardless of what region the climate models lie in, the consistency among different atmospheric wa-ter vapor content variables is not always guaranteed. As expected, tpw and tpw500 are more consistent with each
other in comparison with q2m, especially in the MWST.
In summary, various climate models demonstrate dif-ferent skills in reproducing precipitation and large-scale circulation features, and therefore choices of analogue schemes based on different atmospheric variables can lead to different skills in detecting heavy precipitation events. Through such analyses, the analogue method can be potentially employed as a powerful diagnostic tool to evaluate the representation of heavy precipitation events in climate models, and the diagnosed model deficiencies can further provide useful insights into model develop-ment and improvedevelop-ment. Given the comparable perfor-mances of the analogue schemes based on uv500 to those
based on h500, in the following analyses, we will employ
only the uv500-based analogue schemes to assess the
pro-jected changes in heavy precipitation frequencies due to the aforementioned complication of geopotential height changes under warming climate.
5. Projected Future Changes in Heavy
Precipitation Frequency
We use the 95th percentile values of the 1979–2005
sea-sonal precipitation observation to extract the heavy pre-cipitation events of RCP experiments from 2006 to 2100. The use of fixed thresholds is one of the ways to examine how the predefined events (i.e. heavy or extreme precip-itation) migrate in a changing climate. We convert the CMIP5 model-simulated daily meteorological fields from 2006 to 2100 to normalized anomalies relative to the seasonal climatological means and standard devi-ations of each model from the CMIP5 historical simu-lations (1979–2005). We analyze the projected changes in heavy precipitation frequency during seven 27-year periods centered at year 2020, 2030, 2040, 2050, 2060, 2070, and 2080, respectively. So the first period spans from 2007 to 2033, and so on. The relative change of each model is calculated relative to its respective season-al heavy precipitation frequency from 1979 to 2005 and expressed as a number of events per year. This is done for both model-based precipitation and three analogue schemes based on uv500.
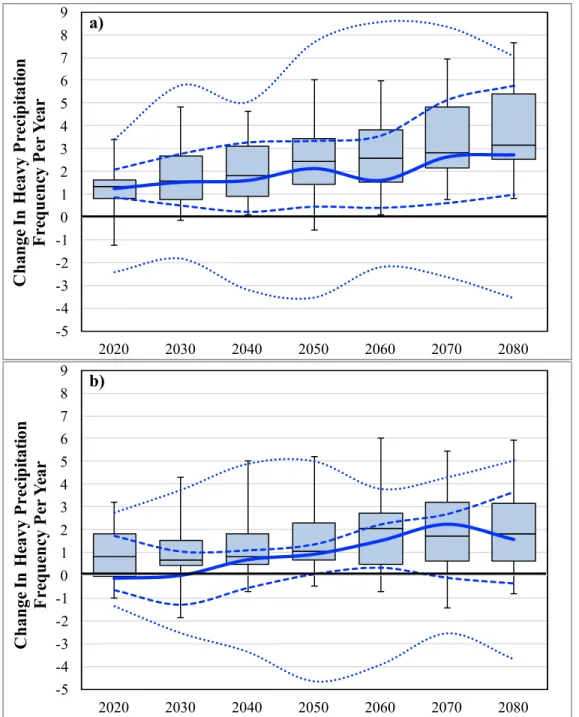
Figure 8 displays the general evolution of the changes in heavy precipitation frequency estimated from an en-semble of model precipitation and the analogue scheme uvw500tpw under RCP8.5 and RCP4.5 scenarios for DJF
of PCCA. Under the RCP8.5 scenario, the multi-model medians of both analyses indicate pronounced increases in heavy precipitation frequency, with medians of precip-itation and analogue results showing 1.3–2.7 and 1.3–3.1 more events/year throughout the examined periods, re-spectively (Figure 8a). There is an upward trend in the medians with the largest increases occurring near or at the end of the century. The medians of the analogue re-sults are generally larger (indicative of stronger increas-es) than those of the corresponding model precipitation. Both analyses show some disagreements in the sign of change with the majority of models indicating increases in the frequency. However, the analogue results demon-strate reduced disagreements in the sign of change in comparison with model precipitation, with all the mod-els consistently showing the increases in the frequency during five out of seven periods (including the last three). Inter-model disagreements in the magnitude of change remain larger for model precipitation than for analogue results, ranging from 3.5 fewer to 8.5 more and 1 fewer to 7.5 more events per year, respectively, throughout the entire period. Especially during the middle-late periods, the model precipitation results exhibit rather marked in-creases in both IQRs and inter-model spreads compared with the early periods. In contrast, IQRs and inter-model spreads in the analogue results remain fairly consistent throughout the entire period.
As expected, the increases in the frequency from both analyses are less pronounced under the lower emission scenario (RCP4.5), with multi-model medians show-ing 0.2 fewer to 2.2 more events/year for precipitation and 0.7–2 more events/year for the analogue scheme throughout the entire period, with the larger increas-es occurring in the late periods (Figure 8b). Likewise, during most of the periods, the medians of analogue results exhibit slightly stronger increases than the cor-responding precipitation results. The mitigation tends
to shift not only the multi-model medians but also the entire distributions toward the smaller increases in heavy precipitation frequency across all the periods. As a result, both analyses show stronger disagreements in the sign of change than under the RCP8.5 scenario, with more models showing decreases in frequency, especially in the early periods. However, inter-model disagreements in the magnitude of change are slightly reduced due to the smaller radiative forcing, ranging from a decrease of 5 to an increase of 5 events per year for precipitation,
Figure 8. the changes in heavy precipitation frequency estimated from an ensemble of model precipitation (blue lines) and the
analogue scheme uvw500tpw (whisker bar) under (a) rcP8.5 and (b) rcP4.5 scenarios for DJF of PccA across the periods centered
at year 2020, 2030, 2040, 2050, 2060, 2070, and 2080, respectively. the solid, dash, and dotted blue lines represent median, Q1 and Q3, minimum and maximum values, respectively.
-5 -4 -3 -2 -1 0 1 2 3 4 5 6 7 8 9 2020 2030 2040 2050 2060 2070 2080
C
ha
ng
e I
n
H
eavy
Prec
ip
ita
tio
n
Fre
qu
en
cy
Per
Y
ear
a)
-5 -4 -3 -2 -1 0 1 2 3 4 5 6 7 8 9 2020 2030 2040 2050 2060 2070 2080C
ha
ng
e I
n
H
eavy
Prec
ip
ita
tio
n
Fre
qu
en
cy
Per
Y
ear
b)
and a decrease of 2 to an increase of 6 events per year for analogue across the entire period. Overall, the analogue scheme uvw500tpw produces smaller inter-model spreads
as compared with model precipitation during all the pe-riods, especially under the RCP8.5 scenario.
Evolutions of frequency changes from the analogue schemes uvw500tpw500 and uvw500q2m illustrate very
sim-ilar features to those from the analogue scheme uvw500
t-pw, except that the multimodel medians of uvw500q2m
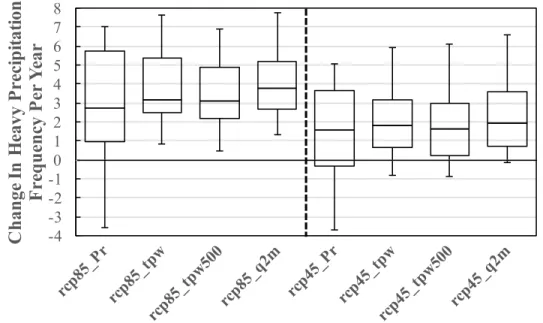
demonstrate stronger increases of 1.4–3.8 and 0.8–2.0 events/year under the RCP8.5 and RCP4.5 scenarios, re-spectively (not shown). Figure 9 displays the comparison of frequency changes from model precipitation and three analogue schemes during the period of year 2067 to year 2093 (centered at year 2080) under both RCP scenarios. All the analogue schemes improve upon model precip-itation by producing reduced disagreements in the sign of frequency changes and smaller inter-model spreads, especially under the higher emission (RCP8.5) scenario. The mitigation effect of lower emission (RCP4.5) is evi-dent with smaller increases consistent for both analyses. Among three analogue schemes, no scheme is clearly su-perior in consistently producing the smallest inter-model spreads under both scenarios, which is observed during other periods as well (not shown). The general evolution of the changes in JJA MWST heavy precipitation fre-quency estimated from an ensemble of model-simulated precipitation and the analogue scheme uvw500tpw is
dis-played in Figure 10 under the RCP8.5 and RCP4.5 sce-narios. Immediately evident and distinctively different from DJF of PCCA is the multi-model medians of both analyses generally exhibit small decreases in heavy
pre-cipitation frequency throughout the examined periods under both RCP scenarios. Wehner (2013) also report-ed the decreases in the projectreport-ed mid-century summer precipitation extremes over large parts of North Amer-ica based on NARCAPP regional climate model simu-lations. Under the RCP8.5 scenario, the multi-model medians show 0.0–0.6 fewer events/year for precipitation and 0.3–0.9 fewer events/year for the analogue scheme throughout the periods (Figure 10a). There is no evident downward trend in the medians. Both analyses exhib-it wide disagreements in the sign of change wexhib-ith about 50–75% of the models showing decreases in frequency during different periods. It is worth noting the distinc-tively large inter-model discrepancies in the magnitude of change from model precipitation during the mid-dle-late periods, which are more than doubled those in the early periods. By the end of the century, the discrep-ancies can range from an increase of 6 to a decrease of 7 events. In contrast, the inter-model discrepancies from analogue scheme uvw500tpw remain fairly constant and
consistently smaller than those from model precipita-tion across the periods. Both analyses also produce IQRs rather consistent throughout the entire period.
The mitigation effect with the lower emission (RCP4.5) is rather weak except that the inter-model spreads are much reduced in the middle-late periods for precipitation and in most of the periods for the analogue results. The mag-nitudes of change throughout the entire period range from an increase of 4 to a decrease of 7 and an increase of 2.5 to a decrease of 3.5 events per year for the precipita-tion and analogue scheme, respectively. The multi-model medians and disagreements in the sign of change from
Figure 9. the changes in heavy precipitation frequency during the period of 2067 to 2093 (centered at 2080) estimated from an
ensemble of cMIP5 model precipitation and synoptic conditions employed by various analogue schemes under rcP8.5 and rcP4.5 scenarios for DJF of PccA.
-4 -3 -2 -10 1 2 3 4 5 6 7 8
C
ha
ng
e I
n
H
eavy
Prec
ip
ita
tio
n
Fre
qu
en
cy
Per
Y
ear
both analyses remain fairly similar to the correspond-ing counterparts under the RCP8.5 scenario throughout the period (Figure 10b). Overall, the analogue scheme uvw500tpw produces much smaller inter-model spreads
than model precipitation during all the periods under both RCP scenarios. We see similar characteristics in evo-lutions of frequency changes from the analogue schemes uvw500tpw500 and uvw500q2m to those from the analogue
scheme uvw500tpw, except that their multi-model
medi-ans can show slightly stronger or slightly weaker decreas-es during different periods (not shown). The comparison of frequency changes from model precipitation and three analogue schemes are displayed in Figure 11 for the last
period (centered at year 2080) under both RCP scenari-os. All the analogue schemes are superior to model pre-cipitation by producing smaller inter-model spreads of frequency changes, especially under the higher emission RCP 8.5 scenario. The mitigation of lower emission is not evident, except that the inter-model spreads are re-duced for both analyses. Among three analogue schemes, uvw500q2m exhibits the largest intermodel discrepancies
under both scenarios, which are also observed during other periods (not shown). The correspondence between precipitation-based and each of analogue-based frequen-cy changes on a per model basis is also examined in the last period under the RCP8.5 scenario for two study regions
Figure 10. Same as Figure 8 but for JJA of MWSt.
-7 -6 -5 -4 -3 -2 -1 0 1 2 3 4 5 6 7 2020 2030 2040 2050 2060 2070 2080