HAL Id: pasteur-00835065
https://hal-riip.archives-ouvertes.fr/pasteur-00835065
Submitted on 18 Jun 2013
HAL is a multi-disciplinary open access
archive for the deposit and dissemination of
sci-entific research documents, whether they are
pub-lished or not. The documents may come from
teaching and research institutions in France or
abroad, or from public or private research centers.
L’archive ouverte pluridisciplinaire HAL, est
destinée au dépôt et à la diffusion de documents
scientifiques de niveau recherche, publiés ou non,
émanant des établissements d’enseignement et de
recherche français ou étrangers, des laboratoires
publics ou privés.
Reservoir Rattus rattus: The Influence of Topographic
Relief on the Distribution of the Disease within the
Madagascan Focus.
Carine Brouat, Soanandrasana Rahelinirina, Anne Loiseau, Lila Rahalison,
Minoarisoa Rajerison, Dominique Laffly, Pascal Handschumacher, Jean-Marc
Duplantier
To cite this version:
Carine Brouat, Soanandrasana Rahelinirina, Anne Loiseau, Lila Rahalison, Minoarisoa Rajerison, et
al.. Plague Circulation and Population Genetics of the Reservoir Rattus rattus: The Influence of
Topographic Relief on the Distribution of the Disease within the Madagascan Focus.. PLoS Neglected
Tropical Diseases, Public Library of Science, 2013, 7 (6), pp.e2266. �10.1371/journal.pntd.0002266�.
�pasteur-00835065�
Plague Circulation and Population Genetics of the
Reservoir
Rattus rattus
: The Influence of Topographic
Relief on the Distribution of the Disease within the
Madagascan Focus
Carine Brouat1*, Soanandrasana Rahelinirina2, Anne Loiseau3, Lila Rahalison2¤, Minoariso Rajerison2, Dominique Laffly4,5, Pascal Handschumacher6, Jean-Marc Duplantier1
1 IRD, UMR022 CBGP, Montferrier-sur-Lez, France, 2 Institut Pasteur de Madagascar, Antananarivo, Madagascar, 3 INRA, UMR1062 CBGP, Montferrier-sur-Lez, France, 4 De´partement de Ge´ographie, UFR Sciences Espaces Socie´te´s, Universite´ de Toulouse, Toulouse, France, 5 GEODE UMR 5602 CNRS, Toulouse, France, 6 IRD, UMR912 SE4S, Marseille, France
Abstract
Background: Landscape may affect the distribution of infectious diseases by influencing the population density and dispersal of hosts and vectors. Plague (Yersinia pestis infection) is a highly virulent, re-emerging disease, the ecology of which has been scarcely studied in Africa. Human seroprevalence data for the major plague focus of Madagascar suggest that plague spreads heterogeneously across the landscape as a function of the relief. Plague is primarily a disease of rodents. We therefore investigated the relationship between disease distribution and the population genetic structure of the black rat, Rattus rattus, the main reservoir of plague in Madagascar.
Methodology/Principal Findings:We conducted a comparative study of plague seroprevalence and genetic structure (15 microsatellite markers) in rat populations from four geographic areas differing in topology, each covering about 150– 200 km2within the Madagascan plague focus. The seroprevalence levels in the rat populations mimicked those previously reported for humans. As expected, rat populations clearly displayed a more marked genetic structure with increasing relief. However, the relationship between seroprevalence data and genetic structure differs between areas, suggesting that plague distribution is not related everywhere to the effective dispersal of rats.
Conclusions/Significance:Genetic diversity estimates suggested that plague epizootics had only a weak impact on rat population sizes. In the highlands of Madagascar, plague dissemination cannot be accounted for solely by the effective dispersal of the reservoir. Human social activities may also be involved in spreading the disease in rat and human populations.
Citation: Brouat C, Rahelinirina S, Loiseau A, Rahalison L, Rajerison M, et al. (2013) Plague Circulation and Population Genetics of the Reservoir Rattus rattus: The Influence of Topographic Relief on the Distribution of the Disease within the Madagascan Focus. PLoS Negl Trop Dis 7(6): e2266. doi:10.1371/ journal.pntd.0002266
Editor: Pamela L. C. Small, University of Tennessee, United States of America Received October 19, 2012; Accepted April 29, 2013; Published June 6, 2013
Copyright: ß 2013 Brouat et al. This is an open-access article distributed under the terms of the Creative Commons Attribution License, which permits unrestricted use, distribution, and reproduction in any medium, provided the original author and source are credited.
Funding: Funding was provided by the IRD (Institut de Recherche pour le De´veloppement, http://www.ird.fr/), the IPM (Institut Pasteur de Madagascar, http:// www.pasteur.mg/), the program RAMSE (Recherche applique´e a` Madagascar sur la sante´ et l’environnement) and an ANR-SEST (Agence Nationale pour la Recherche, Sante´-Environnement et Sante´- Travail, http://www.agence-nationale-recherche.fr/) program (Nu06 SEST 10). The funders had no role in study design, data collection and analysis, decision to publish, or preparation of the manuscript.
Competing Interests: The authors have declared that no competing interests exist. * E-mail: carine.brouat@ird.fr
¤ Current address: Centers for Disease Control and Prevention, Atlanta, Georgia, United States of America.
Introduction
Evaluating the contribution of landscape characteristics to spatial heterogeneity in the occurrence of infectious diseases is critical for the assessment of risks and the design of optimal surveillance and control programs. Plague (Yersinia pestis infection) is a highly virulent, re-emerging disease that has caused three pandemics in the last 2000 years [1]. Several hundred human cases are reported each year, mostly in Africa ([2]). Despite its major impact on human populations, plague is primarily a disease of rodents and the fleas associated with them. Plague ecology has been extensively studied in North America, which accounts for
only 1.2% of all recent cases in humans [2]. In this region, landscape structure accounted for the spread of the disease [3,4] through effects on the dispersal of the rodent host [5]. For instance, the occurrence of plague was found to be negatively associated with the presence of putative dispersal barriers, such as rivers, streams or roads, within the landscape [3]. Furthermore, the occurrence of an unfavorable habitat for reservoirs was associated with significant genetic structure in populations of the plague bacterium, even when the geographic distance between trap sites was small [4]. In major plague foci (such as the Democratic Republic of the Congo and Madagascar, which together account for 90.1% of all human cases worldwide [2]),
plague ecology has been little studied. However, African plague foci may differ considerably from American foci, because the reservoir or vector species involved may have very different ecological features and distributions [6].
Plague was introduced into Madagascar in 1898, and has remained endemic in the central highlands of the country since the 1920s, with hundreds of human cases reported each year [7] and continuous circulation within rodent populations [8]. Human seroprevalence levels and reported plague cases are heteroge-neously distributed across the highlands of Madagascar [7,9,10]. It has been suggested that this spatial variability in the occurrence of the disease within human populations is related to topographic relief (e.g., the degree of change in elevation within a particular geographic area). Indeed, a comparative analysis of two adjacent areas showed that villages in which positive plague seroprevalence was found in humans tended to be clustered together in the mountainous area, but more evenly distributed across the landscape in the plateau area [11]. This pattern may reflect differences in the degree of human movements and exchanges, and hence, in the translocation of infected rodents or fleas between villages. Alternatively, as shown for other biological systems (e.g., [12]), it may reflect effects of the landscape on the population genetic structure of disease vectors and/or reservoirs (e.g. fleas and rodents).
The genetic structure of flea populations is thought to be strongly determined by host dispersal patterns ([13], but see [14,15]). In Madagascar, two fleas, Xenopsylla cheopis and Synopsyllus fonquerniei, have been identified as plague vectors [8]. Both species are known to be specific parasites of rodents and insectivores [16]. In rural areas of the highlands, their principal host is the black rat, Rattus rattus, which is also the main reservoir of plague [8,17]. This rodent species was introduced by humans several centuries before the arrival of the disease on this island [18]. It accounts for more than 95% of all small mammal captures in the highlands of Madagascar (except in isolated forest fragments and towns) [19], suggesting that other reservoir species are unlikely to play a major role in plague spread. Rattus rattus is known to have a limited home range and low levels of dispersal (e.g., a few hundred meters, although much larger distances of a few kilometers, have been observed on occasion) [20,21,22], with reported population densities of a few tens of individuals per hectare [23,24]. The
few ecological data available for this species suggested that genetic differentiation may occur over a fine spatial scale, and that geographic barriers may influence gene flow and population structure [25].
Topographic relief has been shown to influence gene flow in many species (see refs. in [26]) including rodents [27]. We investigated the role of rat dispersal in plague spread, by carrying out a comparative study of plague seroprevalence levels and the genetic structure of rat populations in four areas of the Madagascan plague focus with different topographic relief profiles. We aims at answering the following questions: (1) Does the distribution of plague seroprevalence in rat populations differs between plateau and mountain areas, as shown in humans [11]?; (2) Is the fine-scale genetic structure of rat populations higher in mountain areas than in plateaus, suggesting an effect of landscape (more highly structured by rivers and ridges in mountains than on plateaus) on rat dispersal?; and (3) how is plague distribution related to population genetics of R. rattus?
Materials and Methods Ethics statement
Field sampling was carried out systematically by joint teams of staff from the IRD (Institut de Recherche pour le De´veloppement), the IPM (Institut Pasteur de Madagascar) and the Madagascan Ministry of Health (Communicable Disease Control Department). Each trapping campaign was validated by the national, regional and local health authorities. Traps were set within houses with the approval of the owner or tenant. Outside houses, traps were set with the agreement of the village head, and always on the edge of cultivated fields, so as not to damage crops. The only rodents sampled were those from introduced species (house mouse, black rat and Norway rat), all of which are considered as pests, with no protected status in Madagascar. No permission was therefore required for their capture.
Animals were treated in a humane manner, in accordance with the guidelines of the American Society of Mammalogists [28]. Madagascar has no ethics committee overseeing animal experi-mentation, and the IRD has no ethics board for the review of animal experimentation protocols. However, the ANR-SEST (Agence Nationale pour la Recherche, Sante´-Environnement et Sante´-Travail) program on plague diffusion, which provided some of the funding for this project, has been approved by the Managing Director of the IRD. In addition, regional approval was obtained from the regional Head of Veterinary Service (He´rault, France), for the sampling and killing of rodents and the harvesting of their tissues (approval no. B 34-169-1) carried out during this study.
Study areas and sample collection
Four study areas in which human plague epidemics are regularly reported were compared (Figure 1, Table 1). Mora-manga is an area located in a wide valley, along the Mangoro River, with a slight decrease in elevation along a gradient running from north to south. Mandoto is a plateau area with rolling hills and a fairly flat relief. Rat samples from this area have already been used in a population genetic study [29], but we used 10 additional markers in this study (see below). In Betafo, the landscape is more rugged, with relatively large changes in elevation between villages. Ambositra is a mountainous area, in which villages are located in deep valleys separated by high ridges. Mandoto and Betafo have been studied before, in investigations of the distribution of plague seroprevalence in humans [11].
Author Summary
Plague (Yersinia pestis infection) is a highly virulent disease occurring in many natural ecosystems. One of the major plague foci is Madagascar, where plague has been confined principally to the central highlands since the 1920s. Despite the high prevalence of plague, its ecology has scarcely been studied. Previous studies of plague seroprevalence in humans have suggested that the disease spreads unevenly across landscapes, possibly due to the relief. Plague is primarily a disease of rodents. We therefore investigated the relationship between its distribution and the population genetic structure of its main reservoir, the black rat, Rattus rattus. We used serological and microsatellite-based population genetic analyses to compare four geo-graphic areas of the plague focus (two mountainous areas, two plateaus). Rat populations had a more marked genetic structure in areas of greater relief. The heterogeneous distribution of plague in the highlands may be related to the population genetic structure of its reservoir, but our results suggest also a role for humans in the dispersion of the disease.
Sampling was performed in 1996–1997 (Mandoto), 2000 (Ambositra), 2006–2007 (Betafo) and 2008–2009 (Moramanga), in six to eight villages per area (Table 1). Villages were at least 2 km apart (separated by a maximum of 36 km), to ensure that they were further apart than the distance generally covered by rats around their territory (a few hundred meters, e.g. [20,21,22]). Within each village, we sampled two trap sites corresponding to different habitats, as described in a previous protocol [29]: i) within the villages, in houses and sisal fences around the enclosures close to the houses (V), and ii) in the surrounding irrigated rice fields and crops (R) a few hundred meters from the houses. This sampling scheme was chosen because previous studies have shown that rat
subpopulations from these habitats differ in term of their relative densities, the duration of the breeding season (continuous within villages, restricted to the warm season in fields), their flea species (X. cheopis on the rats from houses, S. fonquerniei on the rats from fields) and flea abundance (higher on the rats from houses), and that the movements of rats between habitats are limited [22,29]. This made it possible for us to evaluate the contribution of such differences to genetic structure at a fine spatial scale. Trap sites were geo-referenced with a Global Positioning System (GPS).
Each captured rat was euthanized by cervical dislocation, then weighted, measured and autopsied. Blood was collected from the heart on seropads (Laboratoire de De´veloppement et d’Analyses
Figure 1. Geographic location of the four areas studied and their sampled subpopulations in Madagascar. Mandoto, Moramanga: plateau areas; Betafo, Ambositra: mountainous areas.
doi:10.1371/journal.pntd.0002266.g001
22440; LDA22 Zoopole–Ploufragan), and a piece of ear or tail was stored in ethanol for molecular analyses.
Serological diagnosis of plague
For each sampled rat, specific antibodies against Y. pestis were detected in seropads by a rat IgG anti-F1 enzyme-linked immunosorbent assay (sensitivity of 100%; specificity of 98.7% for an optical density threshold of 0.05) [30]. Plague seropreva-lence was then calculated as the percentage of seropositive individuals per trap site, taking all the rats analyzed into account.
Molecular methods
We carried out molecular analyses on a maximum of 44 rats per trap site, the rats from a given trap site being considered as a subpopulation (Table 2). Genomic DNA was extracted from ethanol-stored tissues with the PUREGENE DNA purification kit. Genotyping was conducted for 15 microsatellite loci. Six of these loci were originally developed for Rattus norvegicus (D7Rat13, D10Rat20, D11Mgh5, D11Rat56, and D16Rat81; [31]). Samples from Mandoto had already been genotyped for these markers [29], but some were re-analyzed for the purposes of comparison. Ten additional microsatellite loci were recently developed specifically for R. rattus (Rr14, Rr17, Rr21, Rr22, Rr54, Rr67, Rr68, Rr93, Rr107, and Rr114: [32]), and were genotyped for the entire dataset. Every individual successfully genotyped at some loci but not at some others underwent re-amplification once by simple PCR (to avoid primer competition), for each failed locus.
Data analyses
Deviations from Hardy–Weinberg equilibrium (HWE) within subpopulations and genotypic linkage disequilibrium (LD) between pairs of loci were tested using the Markov chain method implemented in GENEPOP v.4 [33]. We corrected for multiple
testing by the False Discovery Rate (FDR) approach [34] implemented in the QVALUEpackage of R.
Some loci displayed significant heterozygote deficiencies in several subpopulations (see Results). In these loci, some null genotypes were found. We used MICRO-CHECKERv.2.2.3 [35] to test whether heterozygote deficiencies could be accounted for by the existence of null alleles. We then used FREENA([36], available
from www.montpellier.inra.fr/URLB), to assess the need to correct for null alleles.
The genetic diversity of each subpopulation was assessed by calculating Nei’s unbiased genetic diversity (HS, [37]), allelic
richness (r, evaluating the number of alleles independent of sample size, calculated for a minimum of 7 individuals by the rarefaction procedure [38] implemented in FSTAT v.2.9.3.2 [39]), and FIS
(tested for significance with FSTAT). Effective population size (NE)
was estimated with LDNE [40]. The method used is based on linkage disequilibrium and assumes random associations of alleles at different loci. Alleles with a frequency $0.02 were used to minimize possible bias [40]. We investigated whether plague epizootics had left detectable traces on genetic diversity and population size, by assessing the relationship between r, HS, FISor
NEand plague seroprevalence in each subpopulation within areas
by carrying out Spearman’s rank non parametric correlation analyses in SAS v. 9.3 [41]. We compared r, HS, and FISbetween
areas with FSTAT(10,000 permutations), and NE using
nonpara-metric Kruskal-Wallis tests in SAS.
Genetic structure was examined in several ways within the four study areas. Bayesian clustering analyses were first performed with STRUCTURE v.2.3.3 [42]. This approach is based on an explicit
evolutionary model for genetic variation and makes statistical inference on the basis of individual data, to estimate the number of genetic clusters in each area and assign individuals to the various clusters. We used the DK method to infer the number of genetic groups per area [43]. All analyses were performed with an admixture model and correlated allele frequencies [44]. We performed 10 independent runs for each K value (from 1 to n+1, n being the number of villages sampled in each area). Each run included 50,000 burn-in iterations followed by 500,000 iterations. We also checked that a single mode was obtained in the results of the 10 STRUCTUREruns for each K value, by using the Greedy
algorithm implemented in CLUMPPv.1.1.2 [45].
We also estimated FST values [46] for each pair of
subpopu-lations within each area, using FSTAT. We generated 95% confidence intervals (CIs) for the mean FSTper area by bootstrap
resampling across loci, and we then used FSTAT(10,000 repetitions)
to compare mean FST. We assessed whether villages may explain
population genetic structure within a given area, by performing AMOVA (analysis of molecular variance, [47]) with ARLEQUIN
v.2.000 [48], using the locus-by-locus option. The variance components were tested using randomization (1,000 permuta-tions). At the finest spatial scale, we used G-based (log-likelihood ratio) randomization tests [49] to evaluate the effect of habitat on genetic structure, with FSTAT. These analyses were carried out with pairs of subpopulations corresponding to different habitats within villages (Betafo: 4 pairs; Mandoto: 4 pairs; Ambositra: 3 pairs; Moramanga: 4 pairs). Independent tests of pairwise genetic differentiation were combined, by the generalized binomial procedure implemented in MULTITESTv.1-2 [50].
We analyzed isolation by distance (IBD) by regressing pairwise estimates of FST/(1 - FST) against the logarithm of the Euclidean
geographic distances between trap sites ([51]). Under a model of isolation by distance, genetic distance between subpopulations would be expected to increase with geographic distance. Mantel tests were performed to test the correlation between matrices of Table 1. Study areas and their characteristics.
Moramanga Mandoto Betafo Ambositra
Landscape Plateau Plateau Relief Relief
Sampling date Apr. 2008–Nov. 2009 Sept. 1996–Jan. 1997 Sept. 2006–Jan. 2007 Feb.–Apr. 2000
Village number 6 5 6 8
Subpopulation number 10 9 10 11
Number of sampled/genotyped rats 188/179 464/262 386/275 269/194 Min/Max DE 2.6/28.6 1.9/20.9 3.7/26.3 3.2/35.8
DE= Euclidean distance among villages (km).
Table 2. Seroprevalence and genetic estimates per subpopulation. Area Subpop SP (%) N HS r FIS NE FST Moramanga EAboV 0 8 0.71 5.4 0.032 14 [9; 22] EAboR 0 14 0.68 4.8 0.057 74 [34; ‘] EMkaV 0 21 0.73 5.3 0.092 36 [28; 50] EMkaR 0 30 0.75 5.4 20.008 25 [21; 31] EAmaV 0 21 0.73 5.4 0.039 42 [29; 70] EAmaR 0 16 0.71 5.0 0.011 44 [28; 93] EAryV 0 11 0.71 5.1 0 92 [36; ‘] EAryR 0 22 0.75 5.4 0.065 71 [48;131] EAbaR 0 22 0.72 5.3 0.044 395 [79; ‘] EMroR 7.14 14 0.68 4.6 0.157* 125 [35; ‘] Mean 0.72±0.02 5.2±0.3 0.046 [0.018; 0.076] 91.9±111.6 0.019 [0.01; 0.027] Mandoto MAasR 3.17 21 0.69 4.6 0.064 30 [21; 45] MAasV 1.69 44 0.72 5.3 0.019 64 [51; 84] MAhiR 12.50 16 0.75 5.6 0.041 / MAhiV 34.88 44 0.70 5.2 0.116* 42 [31; 62] MAtoR 9.09 22 0.68 4.7 0.005 30 [23; 42] MAtoV 8.06 42 0.67 4.9 0.037 45 [36; 58] MBitR 5.55 10 0.72 5.4 0.015 / MBitV 3.30 44 0.73 5.1 0.063 37 [31; 45] MMokV 8.69 19 0.70 5.1 0.025 31 [19; 67] Mean 0.70±0.03 5.0±0.4 0.049 [0.004; 0.101] 39.9±12.2 0.038 [0.029; 0.047] Betafo BAklV 0 36 0.73 5.2 0.032 39 [31; 51] BAklR 0 20 0.67 4.7 20.052 14 [11; 17] BVniV 0 40 0.68 5.0 0.06 40 [32; 53] BVniR 0 20 0.67 4.6 20.16 23 [17; 33] BAlnV 11.32 40 0.68 5.0 0.066 51 [41; 67] BAlnR 0 15 0.64 4.5 20.039 24 [16; 42] BApgV 12.96 40 0.70 5.0 0.067 28 [23; 34] BApgR 33.33 15 0.66 4.6 0.04 16 [12; 22] BAhyV 0 35 0.70 5.0 0.101* 52 [39; 77] BAtnV 45.45 14 0.72 5.2 0.104 373 [67; ‘] Mean 0.68±0.03 4.9±0.3 0.046 [20.001; 0.011] 66.1±108.7 0.041 [0.033; 0.050] Ambositra AAboV 0 22 0.75 5.5 0.042 33 [24; 47] AAdrV 0 22 0.71 5.1 0.058 58 [32; 191] AAtaV 0 22 0.73 5.1 0.085 82 [48; 231] AAbaV 0 16 0.69 4.7 0.148* 17 [13; 23] ATitR 0 17 0.56 3.7 20.121 5 [3; 6] AAklV 0 10 0.71 4.8 20.028 8 [6; 12] AAklR 0 9 0.71 4.5 0.01 11 [7; 19] AAknV 0 29 0.73 5.3 0.052 19 [16; 22] AAknR 0 11 0.72 4.8 20.014 19 [13; 34] AAmpV 5.56 22 0.68 4.6 0.032 9 [7; 11] AAmpR 0 14 0.71 5.2 0.043 21 [14; 34] Mean 0.70±0.05 4.8±0.5 0.038 [20.001; 0.093] 25.6±23.9 0.053 [0.045; 0.064] Seroprevalence (SP) was calculated on all sampled individuals per subpopulation, and genetic estimates were calculated on genotyped individuals (N) per subpopulation. Mean and standard errors (r, HS) or 95% confidence intervals (FIS, FST) are reported for each area.
*indicated significant FISvalues after correction for multiple tests.
doi:10.1371/journal.pntd.0002266.t002
genetic differentiation and geographic distance in GENEPOP(10,000
permutations), excluding intra-village comparisons. The spatial pattern of genetic variation was also investigated by spatial autocorrelation analyses of mean genetic relatedness between pairs of individuals. These analyses complemented standard tests of isolation by distance, as spatial autocorrelation can occur at very fine scales, below the level of the area. Moreover, genetic relatedness provides a more contemporary picture of population genetic structure than the integrative FST. Spatial autocorrelation
analyses were performed for each area with SPAGEDI v.1.2 [52],
and the relatedness coefficient rxy [53] was calculated for each
distance class. Genotypic data for more than 398 pairs were included in each distance class. The null hypothesis of random genetic structure was rejected if the correlation coefficient exceeded the limits of the 95% confidence interval, as determined from 10,000 permutations.
Finally, we investigated the relationship between plague seroprevalence distribution and genetic structure in rat subpop-ulations while statistically controlling for the effect of the Euclidean geographic distance. This was done with partial Mantel tests [54] performed in FSTAT (10,000 permutations), using pairwise absolute differences between seroprevalence levels and pairwise estimates of FSTbetween subpopulations. A positive
correlation would suggest a strong influence of rat dispersal on plague distribution.
Results
In total, we sampled 1297 rats in the four areas. In the mountain area of Ambositra and the plateau of Moramanga, most of the rats were seronegative, and plague seroprevalence levels were different from zero at only one trap site per area (Ambositra: AAmpV, two seropositive rats; Moramanga: EMroR, one seropositive rat) (Table 2). In Betafo, plague seroprevalence was positive only in the north westernmost villages (BAln, BApg, BAtn) (Figure 1; Table 2). In Mandoto, seropositive individuals were found in all villages (Table 2).
In total, 910 rats were genotyped. Ten loci (D10R20, D7R13, Rr14, Rr17, Rr22, Rr54, Rr68, Rr93, Rr107, Rr114) were at
HWE. The other five (D11R56, D16R81, D11M5, Rr21, Rr67) displayed significant heterozygote deficiencies in several subpop-ulations, probably due to null alleles. Estimated null allele frequencies were low [36] (from 0.05 to 0.13; mean frequency for all loci = 0.037). All analyses yielded similar results with and without loci not at HWE: those presented here were obtained with the whole dataset. LD was significant for 25 of the 4200 tests performed (0.6% of comparisons), so the 15 loci were considered to be independent.
The 15 microsatellite loci considered in the analyses were polymorphic in all subpopulations (Table 2). In Ambositra and Moramanga, the subpopulations with positive plague seropreva-lence also had low levels of genetic diversity and a high FIS
(Table 2) Subpopulation-specific NE values were below 100
individuals, except in three subpopulations with infinite confidence intervals for which estimations were thus, by definition, imprecise (Table 2). Spearman’s rank correlation analyses for genetic diversity and seroprevalence were carried out for Betafo and Mandoto (more than one subpopulation with seropositive rats). The only result close to statistical significance was a positive relationship between seroprevalence and FISin Betafo (rs= 0.59,
P = 0.07). In Mandoto, the subpopulation with the highest seroprevalence (MAhiV) also had the highest FIS(Table 2), but
the relationship between these two factors was not significant. Genetic diversity did not differ between areas (r: P = 0.14; HS:
P = 0.13; FIS: P = 0.96), unlike effective population size (P = 0.02),
with the smallest NEvalues obtained for Ambositra and the highest
ones for Moramanga.
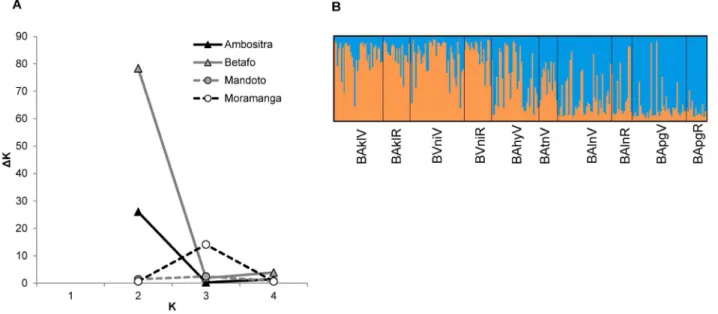
STRUCTUREindicated the presence of a single genetic cluster in
Moramanga (minor peak of DK not associated with an interpret-able structure) and Mandoto (no maximum DK), and of two genetic clusters within the mountainous areas of Betafo and Ambositra (Figure 2A). In Betafo, the two genetic clusters clearly corresponded to northern and southern subpopulations (Figure 2B). In Ambositra, the clustering was weaker and was related to a pair of subpopulations, ATitR- AAmpV (proportion of membership to cluster 2: 0.92 for ATitR, 0.75 for AAmpV, ,0.38 for other subpopulations). ATitR and AAmpV were not partic-ularly similar in terms of their FST and they are not located
Figure 2. Results of STRUCTUREanalyses. (A) Estimates of DK for each possible value of K within each of the four areas; (B) Structure bar plot for the run with the highest estimated posterior probability for Betafo at K = 2: subpopulations are ordered from south (left) to north (right).
geographically close together (Euclidean distance of 13 km; Figure 1), but their genetic diversity was significantly lower than that of other subpopulations (FSTATpermutation tests, r: P = 0.03;
HS: P = 0.09; Table 2), suggesting possible artifactual clustering.
Overall FSTestimates differed between zones (P = 0.02), with the
lowest value obtained for Moramanga and the highest for Ambositra (Table 2). Pairwise FST estimates ranged from 0 to
0.05 in Moramanga, from 0.008 to 0.06 in Mandoto, from 0.01 to 0.09 in Betafo and from 0.02 to 0.16 in Ambositra. In all four areas, there was significant genetic differentiation between villages (Moramanga: Va= 0.88%, P,0.005; Mandoto: Va= 1.16%,
P,0.002; Betafo: Va= 0.94%, P,0.003; Ambositra: Va= 1.17%,
P = 0.02) although most of the genetic variation was observed within subpopulations (Vc.94%, P,0.0001). There was also
significant genetic differentiation between habitats within villages, in each area (unweighted mean FST, Moramanga: FST= 0.012;
P,0.001; Mandoto: FST= 0.024, P,0.001; Betafo: FST= 0.037;
P,0.001; Ambositra FST= 0.053, generalized binomial test
P = 0.003).
Genetic IBD was significant in Betafo (P = 0.0001; slope b = 0.009, 95%CI = [0.0035; 0.022]) and in Mandoto (P = 0.02; slope b = 0.012, 95%CI = [0.005; 0.022]), but not in Moramanga (P = 0.59; slope b = 0.0004, 95%CI = [20.005; 0.007]) (Figure 3).
For Ambositra, genetic differentiation was negatively related to distance (P = 0.02; slope b = 20.016, 95%CI = [20.02; 20.01]) (Figure 3D). However, this relationship was no longer significant (P = 0.09) if the ATitR/AAmpV subpopulations (which were clustered together in STRUCTUREanalyses) were excluded.
The analysis of spatial genetic autocorrelation analysis yielded positive values for the first distance classes (within trap sites) in each area. For the second distance class (corresponding to distances between habitats within villages) correlation values were significant and positive only in Betafo and Mandoto. Genetic similarities between individuals subsequently decreased for higher-order classes, becoming mostly non-significant.
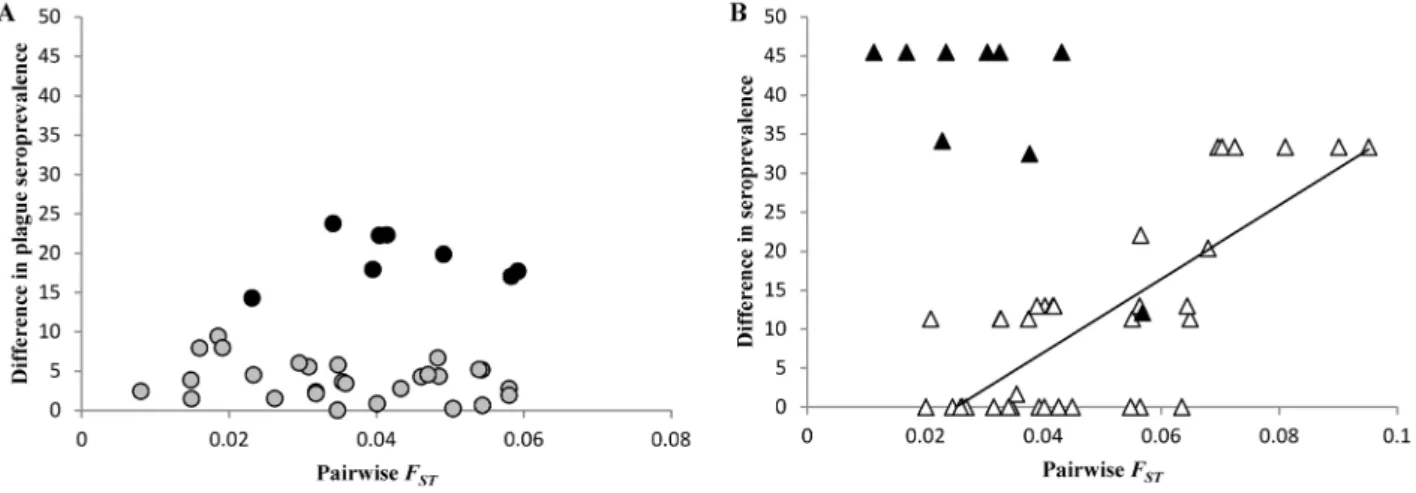
Partial Mantel tests using seroprevalence data were carried out for Mandoto and Betafo (more than one subpopulation with seropositive rats). In Mandoto, significant correlations were found between differences in plague seroprevalence levels and genetic structure (r2= 12.0, P = 0.038) or geographic distance (r2= 16.7, P = 0.014). These spurious correlations were related to the subpopulation MAhiV characterized by the highest seropreva-lence level of the area (Table 2; Figure 4A): when this subpopulation was removed from the analysis, partial Mantel tests were not significant (genetic structure: r2= 1.54, P = 0.47;
geographic distance: r2= 0.4, P = 0.72). In Betafo, there was no
Figure 3. Genetic isolation by distance patterns inRattus rattuspopulations of the four areas. Relationships (the regression line is shown only when significant) between pairwise Euclidean geographic distance between subpopulations and genetic differentiation, estimated as FST/(1-FST).
(A) Moramanga, plateau area; (B) Mandoto, plateau area; (C) Betafo, mountainous area; (D) Ambositra, mountainous area. doi:10.1371/journal.pntd.0002266.g003
significant correlation between differences in plague seropreva-lence and genetic structure (r2= 1.2, P = 0.47) or geographic distance (r2= 0.1, P = 0.81). However, when the subpopulation BAtnV that is also characterized by the highest seroprevalence level of the area, was removed from the analysis, the correlation involving genetic structure became highly significant (r2= 42.6, P = 0.0001) (Figure 4B).
Discussion
Distribution of plague seroprevalence in rat populations
In Madagascar, the distribution of plague seroprevalence levels and reported plague cases was shown to differ between plateau and mountain areas in humans [11]. Our aim was to investigate whether the same pattern was observed in rat populations. In Ambositra and Moramanga, only one rat subpopulation per area had a positive seroprevalence for plague. This made it impossible to examine the relationship between topographic relief and seroprevalence distribution in these areas. The very small number of seropositive rats found in Ambositra (2 rats) was surprising, as this area reported the largest number of human cases during the 1990s [10]. Given the lifespan of wild R. rattus (about one year: [21]), this may indicate a low incidence of the disease during the year preceding sampling: indeed, six and five human cases were reported in the villages studied in Ambositra and Moramanga, respectively (Plague Laboratory database, Madagascan Ministry of Health). Alternatively, experimental infestations have shown that a substantial proportion of the rats from the highlands of Madagascar may be resistant to plague, remaining seronegative after exposure (even inoculated at high dose) [30]. For unknown reasons, these rats may be more frequent in Ambositra and Moramanga than elsewhere. Otherwise, plague seroprevalence data for rats were consistent with expectations in the other two areas studied: in Betafo (mountainous area), positive seropreva-lence levels were clustered in the northwestern most subpopula-tions (BAln, BApg, BAtn, Table 2), whereas in Mandoto (plateau area), seroprevalence was positive for all subpopulations (Table 2). As for human plague seroprevalence data [11], this pattern may reflect differences in human lifestyles (due to a combination of historical and environmental factors) between Mandoto (more social interactions between villages) and Betafo (isolated villages), and hence more translocation of infected rats or fleas between villages in Mandoto than in Betafo. Alternatively, it may reflect
differences in the spread of plague between reservoir subpopula-tions in mountains and those in plateau zones. Under this second hypothesis, we would expect a more marked population genetic structure for rats in the mountains than for those in plateau areas.
Rat population genetics and topographic relief
In all areas, significant but weak genotypic differentiation of R. rattus subpopulations was observed over a relatively small spatial scale (between habitats in the same village, and between villages). Our results were globally consistent with the expectation of an increasing genetic structure of rat populations with topographic relief. Popula-tion genetic structure clearly increased from Moramanga (the flattest area) to Ambositra (the most mountainous area). No genetic isolation by distance was detected in Moramanga or Ambositra (Figure 3). This may reflect the occurrence of different processes, due to the differences in population genetic structure (see mean FSTin Table 2).
In Moramanga, low levels of genetic structure may reflect large population sizes (as supported by NEestimates: Table 2), high levels of
gene flow and random dispersal between subpopulations at the scale of this homogeneous landscape, mostly covered by rice fields. In Ambositra, high levels of genetic structure are suggestive of small populations (Table 2), low levels of gene flow and low levels of dispersal between subpopulations, which are isolated from each other even when geographically close. For instance, there was a high degree of genetic differentiation between AAklV and AAmpV (FST= 0.10),
two subpopulations that are only 3.5 km apart, but on different watersheds. Also, the highly differentiated ATitR subpopulation, despite its central location in the area studied, appears to be very small (NE= 5) and located in an isolated valley. Note however that the
linkage disequilibrium method may provide biased downward estimates of NE, in case of pulse migration [55].
Population genetic structure estimates were however interme-diate and not significantly different from each other (and from that of Ambositra) in Mandoto and Betafo (Table 2). Some indices, such as STRUCTUREresults (Figure 2) or pairwise FST over large
distances (Figure 3B, C), indicated that population structure was weaker in Mandoto, but we expected more clear-cut results given the differences in topographic relief between these two areas. In both areas, genetic differentiation increased with geographic distance, and IBD patterns were similar (Figure 3B, C). This suggests that our relief typology (mountainous area/plateau area) may have been too simplistic as concerns rat dispersal patterns.
Figure 4. Relationship between plague seroprevalence data and genetic structure in rats. Each subpopulation pair was characterized by its absolute difference between seroprevalence levels, and its pairwise FST. (A) Mandoto, plateau area: black circles indicated the subpopulations pairs
involving MAhiV; (B) Betafo, mountainous area: black triangles indicated the subpopulation pairs involving BAtnV. doi:10.1371/journal.pntd.0002266.g004
Rodent dispersal may be limited by more subtle physical properties of the surrounding environment, such as the fragmen-tation of favorable habitats (e.g., crops) by less favorable environments (e.g., steppes) or the occurrence of barriers, such as rivers [56,57,58,59], which may not differ between Mandoto and Betafo. Indeed, further landscape genetic analyses would be helpful in order to describe in more details the influence of landscape on the population genetic structure of black rats.
Rat population genetics and plague
Population genetic analyses indicated similar effective dispersal rates of rats in Betafo and Mandoto. Nevertheless, plague seroprevalence distribution was related to genetic structure in Betafo, but not in Mandoto (Figure 4). The role of rat dispersal regarding plague spread may be different in the two areas, reflecting their differences in human lifestyles. In Mandoto, the lack of concordance between seroprevalence data and genetic structure indicated that plague spread is not explained by the effective dispersal of the reservoir. The hypothesis that other mammal species disperse Y. pestis-infected fleas in this area, thereby counteracting the effect of rat population structure on disease spread (e.g., [14] in North American plague foci) appears unlikely, as trapping data showed the small mammals communities to be poorly diverse, largely dominated by R. rattus (98.5% of captures in Mandoto). Alternatively, rat population structure may play a less important role than human social interactions in determining the distribution of plague seroprevalence in rats and humans of this area. High levels of human movements in Mandoto may favor the translocation of Y. pestis-infected rodents and/or fleas between villages, thereby spreading plague in both the human and rat populations independently of their genetic or geographic proximity. There is ample evidence for the influence of human traffic on the spread of plague over larger distances, both in Madagascar and elsewhere [60]. Our results suggest that human-mediated Y. pestis transfers may also be important at a more local scale.
In the mountainous area of Betafo, the distribution of seroprevalence levels was clearly related to genetic structure when pairwise comparisons involving BAtnV are removed (Figure 4B). The positive correlation clearly suggests that rat dispersal has an influence on plague distribution in this area, except in BAtnV which was characterized by the highest plague seroprevalence level (Table 2). BAtnV had no spurious effects in IBD analyses. This village is located at immediate proximity of the main road of the area. BAtnV may thus be more related to distant human communities than the other villages of Betafo, which are all located at more than two kilometers from the asphalt road. As in Mandoto, few infected rodents, fleas, or humans (one human case reported in BAtnV in 2005; Plague Laboratory database, Madagascan Ministry of Health) may have reach BAtnV from a
geographically distant location, and trigger an epidemics in local rats.
Empirical studies investigating the genetic consequences of infectious diseases in animal have shown that some populations lose genetic diversity [61,62,63], whereas others do not [64,65]. Indeed, the impact of a decrease in population size on genetic diversity depends on the intensity of the disturbance, the length of time until recovery and the rate of recovery [66]. The positive seroprevalences obtained for some subpopulations indicated recent plague epizootics affecting the current generation of rats (Table 2). FIS tended to be higher in subpopulations with positive plague
seroprevalence in each area, especially in MAhiV and BAtnV (Table 2), but the relationship was significant only in Betafo. Thus, some indices indicated that plague epizootics affected the population genetic structure of the reservoir, but the evidence was not very strong. For instance, NEvalues were not significantly
smaller in villages with a positive plague seroprevalence (Table 2). This suggests that plague epizootics have a small impact on population size, possibly because a substantial proportion of rats are resistant to the disease [30,67,68]. Stronger evidence for a causal relationship between plague and rat population genetics would require longitudinal surveys of rodent populations (e.g., [3]), with sampling before and after an epizootic to control for the large number of variables that may affect the estimated parameters.
Conclusion
As expected, rat populations displayed a more marked genetic structure with increasing relief in highlands of Madagascar. Plague spread in rat and human populations can be partly related to the population genetic structure of the reservoir, but also to human social activities. Further improvements to our understanding of the consequences of landscape for plague distribution will require detailed analyses of the opportunities for movement open to the various participants in the plague cycle (human, rats, fleas), together with longitudinal surveys of plague seroprevalence in human and rat populations.
Acknowledgments
We thank the staff of the Plague Laboratory (Institut Pasteur de Madagascar and Ministry of Heath) for their excellent assistance during the fieldwork, and Karine Berthier and the anonymous reviewers for helpful comments on the manuscript. English editing was done by Julie Sappa (Alex Edelman and Associates). Data were generated thanks to the technical facilities of the SFR MEB ‘‘Montpellier Environnement Biodiversite´.’’
Author Contributions
Conceived and designed the experiments: JMD LR CB. Performed the experiments: JMD SR AL. Analyzed the data: CB SR DL. Contributed reagents/materials/analysis tools: MR PH. Wrote the paper: CB. References
1. Stenseth NC, Atshabar BB, Begon M, Belmain SR, Bertherat E, et al. (2008) Plague: Past, Present, and Future. PLoS Medicine 5: e3.
2. World Health Organization (2010) Human plague: review of regional morbidity and mortality, 2004–2009. Geneva: World Health Organization. pp. 37–48. 3. Collinge SK, Johnson WC, Ray C, Matchett R, Grensten J, et al. (2005)
Landscape structure and plague occurrence in black-tailed prairie dogs on grasslands of the western USA. Landscape Ecology 20: 941–955.
4. Girard JM, Wagner DM, Vogler AJ, Keys C, Allender CJ, et al. (2004) Differential plague-transmission dynamics determine Yersinia pestis population genetic structure on local, regional, and global scales. Proceedings of the National Academy of Sciences of the United States of America 101: 8408–8413. 5. Sna¨ll T, O’Hara RB, Ray C, Collinge SK (2008) Climate-Driven Spatial Dynamics of Plague among Prairie Dog Colonies. The American Naturalist 171: 238–248.
6. Prentice MB, Rahalison L (2007) Plague. Lancet Infectious Diseases 369: 1196– 1207.
7. Migliani R, Chanteau S, Rahalison L, Ratsitorahina M, Boutin J-P, et al. (2006) Epidemiological trends for human plague in Madagascar during the second half of the 20th century: a survey of 20 900 notified cases. Tropical Medicine and International Health 11 1228–1237.
8. Brygoo ER (1966) Epide´miologie de la peste a` Madagascar. Archives de l’Institut Pasteur de Madagascar 35: 1–147.
9. Chanteau S, co-ordinating author on behalf of the plague investigation group of the Institut Pasteur de Madagascar (2006) Atlas de la peste a` Madagascar. Paris: IRD/IP/AUF. 94 p.
10. Ratsitorahina M, Rabarijaona L, Chanteau S, Boisier P (2000) Seroepidemi-ology of human plague in the Madagascar highlands. Tropical Medicine and International Health 5: 94–98.
11. Handschumacher P, Duplantier J-M, Chanteau S (2000) La re´surgence de la peste a` Madagascar: une maladie centenaire a` l’e´preuve de l’histoire et de l’e´cologie. Espace, Populations, Socie´te´s 2: 195–208.
12. Root J, Black IV WC, Calisher CH, Wilson KR, Mackie RS, et al. (2003) Analyses of gene flow among populations of deer mice (Peromyscus maniculatus) at sites near Hantavirus pulmonary syndrome case-patient residences. Journal of Wildlife Diseases 39: 287–298. 13. Barrett LG, Thrall PH, Burdon JJ, Linde CC (2008) Life history determines genetic structure and evolutionary potential of host–parasite interactions. Trends in Ecology & Evolution 23: 678–685.
14. Jones PH, Britten HB (2010) The absence of concordant population genetic structure in the black-tailed prairie dog and the flea, Oropsylla hirsuta, with implications for the spread of Yersinia pestis. Molecular Ecology 19: 2038–2049. 15. Jones PH, Washburn LR, Britten HB (2011) Gene flow in a Yersinia pestis vector, Oropsylla hirsuta, during a plague epizootic. Journal of Vector Borne Diseases 48: 125–132.
16. Duchemin J-B (2003) Bioge´ographie des puces de Madagascar [PhD thesis]. Paris, France: Paris XII University.
17. Duplantier J-M, Duchemin J-B, Chanteau S, Carniel E (2005) From the recent lessons of the Malagasy foci towards a global understanding of the factors involved in plague reemergence. Veterinary Research 36: 437–453. 18. Tollenaere C, Brouat C, Duplantier J-M, Rahalison L, Rahelinirina S, et al.
(2010) Phylogeography of the invasive species Rattus rattus in the western Indian Ocean, with special emphasis on the colonization history of Madagascar. Journal of Biogeography 37: 398–410.
19. Duplantier J-M, Rakotondravony D (1999) The rodent problem in Madagascar: agricultural pest and threat to human health. In: Singleton GR, Hinds LA, Leirs H, Z Z, editors. Ecologically-based management of rodent pests. Camberra: Australian Centre for International Agricultural Research. pp. 441–459. 20. Ewer RF (1971) The biology and behaviour of a free-living population of black
rats (Rattus rattus). Animal Behaviour Monograph 4: 127–174.
21. Meehan AP (1984) Rats and mice: their biology and control. East Grinstead, UK: Rentokil Limited. 383 p.
22. Rahelinirina S, Duplantier JM, Ratovonjato J, Ramijaona O, Ratsimba M, et al. (2010) Study on the Movement of Rattus rattus and Evaluation of the Plague Dispersion in Madagascar. Vector-borne and zoonotic diseases 10: 77–84. 23. Fleming TH (1975) The role of small mammals in tropical ecosystems. In: Golley
FB, Petrusewicz K, Ryszkowski L, editors. Small mammals: their productivity and population dynamics. Cambridge, UK: Cambridge University press. pp. 269–298.
24. Cheylan G, Granjon L (1985) Ecologie d’une population de rats noirs Rattus rattus a` Port Cros (Var) : me´thodologie et premiers re´sultats obtenus sur quadrat. Travaux Scientifiques du Parc National de Port-Cros 11: 109–130. 25. Abdelkrim J, Byrom AE, Gemmell NJ (2010) Fine-scale genetic structure of
mainland invasive Rattus rattus populations: implications for restoration of forested conservation areas in New Zealand. Conservation Genetics 11: 1953– 1964.
26. Storfer A, Murphy MA, Spear SF, Holderegger R, Waits LP (2010) Landscape genetics: where are we now? Molecular Ecology 19: 3496–3514.
27. Berthier K, Galan M, Foltete JC, Charbonnel N, Cosson JF (2005) Genetic structure of the cyclic fossorial water vole (Arvicola terrestris): landscape and demographic influences. Molecular Ecology 14: 2861–2872.
28. Sikes RS, Gannon WI, the Animal Care and Use Committee of the American Society of Mammalogists (2011) Guidelines of the American Society of Mammalogists for the use of wild mammals in research. Journal of Mammalogy
92: 235–253.
29. Gilabert A, Loiseau A, Duplantier JM, Rahelinirina S, Rahalison L, et al. (2007) Population genetics of Rattus rattus in a rural plague focus of Malagasy Highlands. Canadian Journal of Zoology 85: 965–972.
30. Andrianaivoarimanana V, Telfer S, Rajerison M, Ranjalahy MA, Andriamiar-imanana F, et al. (2012) Immune responses to plague infection in wild Rattus rattus, in Madagascar: A role in foci persistence? PLoS ONE 7: e38630. 31. Jacob HJ, Brown DM, Bunker RK, Daly MJ, Dzau VJ, et al. (1995) A genetic
linkage map of the laboratory rat, Rattus norvegicus. Nature Genetics 9: 63–69. 32. Loiseau A, Rahelinirina S, Rahalison L, Konecny A, Duplantier J-M, et al.
(2008) Isolation and characterization of microsatellites in Rattus rattus. Molecular Ecology Resources 8: 916–918.
33. Raymond M, Rousset F (1995) Genepop (version 1.2): population genetics software for exact tests and ecumenicism. Journal of Heredity 86: 248–249. 34. Benjamini Y, Hochberg Y (1995) Controlling the false discovery rate: a practical
and powerful approach to multiple testing. Journal of the Royal Statistical Society Series B-Methodological 57: 289–300.
35. van Oosterhout C, Hutchinson WF, Wills DPM, Shipley P (2004) Micro-checker: software for identifying and correcting genotyping errors in microsat-ellite data. Molecular Ecology Notes 4: 535–538.
36. Chapuis MP, Estoup A (2007) Microsatellite null alleles and estimation of population differentiation. Molecular Biology and Evolution 24: 621–631. 37. Nei M (1987) Molecular Evolutionary Genetics. New York, USA: Columbia
University Press. 512 p.
38. El Mousadik A, Petit RJ (1996) Chloroplast DNA phylogeography of the argan tree of Morocco. Molecular Ecology 5: 547–555.
39. Goudet J (2001) FSTAT: a program to estimate and test gene diversities and fixation indices (Version 2.9.3). http://www2.unil.ch/popgen/softwares/fstat. htm.
40. Waples RS, Do C (2008) LDNE: a program for estimating effective population size from data on linkage disequilibrium. Molecular Ecology Resources 8: 753– 756.
41. SAS (2002) SAS for Windows 9.1. Cary, North Carolina: SAS Institute. 42. Pritchard JK, Stephens M, Donnelly P (2000) Inference of population structure
using multilocus genotype data. Genetics 155: 945–959.
43. Evanno G, Regnaut S, Goudet J (2005) Detecting the number of clusters of individuals using the software structure: a simulation study. Molecular Ecology 14: 2611–2620.
44. Falush D, Stephens M, Pritchard JK (2003) Inference of population structure using multilocus genotype data: linked loci and correlated allele frequencies. Genetics 164: 1567–1587.
45. Jakobsson M, Rosenberg NA (2007) CLUMPP: a cluster matching and permuting program for dealing with label switching and multimodality in analysis of population structure. Bioinformatics 23: 1801–1806.
46. Weir BS (1996) Genetic data analysis II. Sunderland (MA): Sinauer Associates. 376 p.
47. Excoffier L, Smouse PE, Quattro JM (1992) Analysis of molecular variance inferred from metric distances among DNA haplotypes: application to human mitochondrial DNA restriction data. Genetics 131: 479–491.
48. Schneider S, Roessli D, Excoffier L (2000) Arlequin, version 2.0: a software for population genetic data analysis. Geneva: Genetics and Biometry Laboratory, University of Geneva, Geneva.
49. Goudet J, Raymond M, de Meeuˆs T, Rousset F (1996) Testing differentiation in diploid populations. Genetics 144: 1933–1940.
50. de Meeuˆs T, Gue´gan J-F, Teriokhin A (2009) MultiTest V.1.2, a program to binomially combine independent tests and performance comparison with other related methods on proportional data. BMC Bioinformatics 10: 443. 51. Rousset F (1997) Genetic differentiation and estimation of gene flow from
F-Statistics under isolation by distance. Genetics 145: 1219–1228.
52. Hardy OJ, Vekemans X (2002) SPAGeDi: a versatile computer program to analyse spatial genetic structure at the individual or population levels. Molecular Ecology Resources 2: 618–620.
53. Queller DC, Goodnight KF (1989) Estimating relatedness using genetic markers. Evolution 43: 258–275.
54. Smouse PE, Long JC, Sokal RR (1986) Multiple regression and correlation extensions of the Mantel test of Matrix correspondence. Systematic Zoology 35: 627–632.
55. Waples RS, England PR (2011) Estimating Contemporary Effective Population Size on the Basis of Linkage Disequilibrium in the Face of Migration. Genetics 189: 633–644.
56. Gauffre B, Estoup A, Bretagnolle V, Cosson JF (2008) Spatial genetic structure of a small rodent in a heterogeneous landscape. Molecular Ecology 17: 4619– 4629.
57. Macqueen PE, Nicholls JA, Hazlitt SL, Goldizen AW (2008) Gene flow among native bush rat, Rattus fuscipes (Rodentia : Muridae) populations in the fragmented subtropical forests of south-east Queensland. Austral Ecology 33: 585–593.
58. Roach JL, Stapp P, Van Horne B, Antolin MF (2001) Genetic structure of a metapopulation of black-tailed prairie dogs. Journal of Mammalogy 82: 946– 959.
59. Vignieri SN (2005) Streams over mountains: influence of riparian connectivity on gene flow in the Pacific jumping mouse (Zapus trinotatus). Molecular Ecology 14: 1925–1937.
60. Vogler AJ, Chan F, Wagner DM, Roumagnac P, Lee J, et al. (2011) Phylogeography and molecular epidemiology of Yersinia pestis in Madagascar. PloS Neglected Tropical Diseases 5 (9): e1319. doi:10.1371/jour-nal.pntd.0001319.
61. Surridge AK, Bell DJ, Ibrahim KM, Hewitt GM (1999) Population structure and genetic variation of European wild rabbits (Oryctolagus cuniculus) in East Anglia. Heredity 82: 479–487.
62. Trudeau KM, Britten HB, Restani M (2004) Sylvatic plague reduces genetic variability in black-tailed prairie dogs. Journal of Wildlife Diseases 40: 205–211. 63. Lachish S, Miller KJ, Storfer A, Goldizen AW, Jones ME (2011) Evidence that disease-induced population decline changes genetic structure and alters dispersal patterns in the Tasmanian devil. Heredity 106: 172–182.
64. Queney G, Ferrand N, Marchandeau S, Azevedo M, Mougel F, et al. (2000) Absence of a genetic bottleneck in a wild rabbit (Oryctolagus cuniculus) population exposed to a severe viral epizootic. Molecular Ecology 9: 1253–1264. 65. Teacher AGF, Garner TWJ, Nichols RA (2009) Evidence for Directional
Selection at a Novel Major Histocompatibility Class I Marker in Wild Common Frogs Rana temporaria Exposed to a Viral Pathogen Ranavirus. PLoS ONE 4 (2): e4616. doi:10.1371/journal.pone.0004616
66. England PR, Osler GHR, Woodworth LM, Montgomery ME, Briscoe DA, et al. (2003) Effects of intense versus diffuse population bottlenecks on microsatellite genetic diversity and evolutionary potential. Conservation Genetics 4: 595–604. 67. Rahalison L, Ranjalahy M, Duplantier J-M, Duchemin J-B, Ravelosaona J, et al. (2003) Susceptibility to plague of the rodents in Antananarivo, Madagascar. In: Skurnik M, Bengoechea JA, Granfors K, editors. The genus Yersinia: entering the functional genomic era. New York: Kluwer Academic/Plenum Publishers. pp. 439–442.
68. Tollenaere C, Rahalison L, Ranjalahy M, Duplantier J-M, Rahelinirina S, et al. (2010) Susceptibility to Yersinia pestis Experimental Infection in Wild Rattus rattus, Reservoir of Plague in Madagascar. EcoHealth 7: 242–247.
![Table 2. Seroprevalence and genetic estimates per subpopulation. Area Subpop SP (%) N H S r F IS N E F ST Moramanga EAboV 0 8 0.71 5.4 0.032 14 [9; 22] EAboR 0 14 0.68 4.8 0.057 74 [34; ‘] EMkaV 0 21 0.73 5.3 0.092 36 [28; 50] EMkaR 0 30 0.75 5.4 20.008 25](https://thumb-eu.123doks.com/thumbv2/123doknet/13733515.436538/6.918.97.834.114.1041/table-seroprevalence-genetic-estimates-subpopulation-subpop-moramanga-eabov.webp)