HAL Id: hal-02396270
https://hal.archives-ouvertes.fr/hal-02396270
Submitted on 12 Dec 2019
HAL is a multi-disciplinary open access
archive for the deposit and dissemination of
sci-entific research documents, whether they are
pub-lished or not. The documents may come from
teaching and research institutions in France or
abroad, or from public or private research centers.
L’archive ouverte pluridisciplinaire HAL, est
destinée au dépôt et à la diffusion de documents
scientifiques de niveau recherche, publiés ou non,
émanant des établissements d’enseignement et de
recherche français ou étrangers, des laboratoires
publics ou privés.
Development of a Kinetic Model for the Moderate
Temperature Chemical Vapor Deposition of SiO 2 Films
from Tetraethyl Orthosilicate and Oxygen
Simon Ponton, Hugues Vergnes, Diane Samelor, Diane Samélor, Daniel
Sadowski, Constantin Vahlas, Brigitte Caussat
To cite this version:
Simon Ponton, Hugues Vergnes, Diane Samelor, Diane Samélor, Daniel Sadowski, et al..
Develop-ment of a Kinetic Model for the Moderate Temperature Chemical Vapor Deposition of SiO 2 Films
from Tetraethyl Orthosilicate and Oxygen. AIChE Journal, Wiley, 2018, �10.1002/aic.16222�.
�hal-02396270�
Development of a Kinetic Model for the Moderate Temperature
Chemical Vapor Deposition of SiO
2
Films
from Tetraethyl Orthosilicate and Oxygen
Simon Ponton
LGC, Université de Toulouse, CNRS, Toulouse, France and CIRIMAT, Université de Toulouse, CNRS, Toulouse, France Hugues Vergnes
LGC, Université de Toulouse, CNRS, Toulouse, France Diane Samelor, Daniel Sadowski and Constantin Vahlas CIRIMAT, Université de Toulouse, CNRS, Toulouse, France
Brigitte Caussat
LGC, Université de Toulouse, CNRS, Toulouse, France
An apparent kinetic model for the chemical vapor deposition of SiO2 from tetraethyl orthosilicate (TEOS) and O2 was developed in a poorly investigated range of operating conditions, that is, at atmospheric pressure and between 350 and 500 C, based on literature survey and experimental results obtained in a hot wall tubular reactor. The kinetic model was implemented into the computational fluid dynamics code FLUENT and validated both in shape and value by comparison with experimental deposition rate profiles. It reveals that for the conditions tested, a possible mechanism of SiO2 deposition involves two intermediate species formed from TEOS homogeneous decomposition, the first one being active from 300 C and the second one contributing to deposition for temperatures higher than 370 C. The calculated local profiles of gas flow, gas temperature, species mass fraction, and silica deposition rate indicate that the first intermediate species leads to marked film thickness gradients, the second one being more stable as producing uniform thicknesses. © 2018 American Institute of Chemical Engineers AIChE J, 64: 3958–3966, 2018
Keywords: deposition methods (CVD, MOCVD), materials, reaction kinetics, simulation, process, process synthesis
Introduction
Since the 1980s, the processing of thin and dense SiO2 films from tetraethyl orthosilicate (Si(OC2H5)4, TEOS) by chemical
vapor deposition (CVD) has been widely investigated to solve mainly microelectronic issues,1,2 such as copper diffusion barrier, capacitor dielectric, and intermetallic dielectric for multilayer metallization systems.3 Nowadays and beyond microelectronics, SiO2 films processed from TEOS still remain key enabling mate-rials in new applications and devices. For instance, in the optic and optoelectronic fields, SiO2 films are used as transparent coat-ings to perform Bragg mirrors4 or antireflection layers.5 When deposited on polymers, they improve gas barrier properties of food packages and biomedical devices.6,7 Conformal SiO2
coat-ings on complex-in-shape structures are used to develop mem-branes for hydrogen separation.8
TEOS is halide-free molecule which is convenient to manipu-late and allows cost-effective manufacture without toxic by-prod-ucts.9 Several processing pathways are available for the CVD of SiO2 films from TEOS. The pyrolysis of TEOS diluted in an
Correspondence concerning this article should be addressed to B. Caussat at brigitte.caussat@ensiacet.fr
inert carrier gas takes place between 700 and 900 C resulting in stoichiometric films with excellent electrical properties, thickness uniformity, and step coverage.10 However, such high deposition temperatures are not convenient to coat thermally sensitive sub-strates and devices. The decrease of process temperature has been achieved either by plasma assistance (plasma-enhanced chemical vapor deposition; PECVD), or through the addition of an oxi-dant, most often ozone, O3.11 The PECVD temperature window ranges
from the ambient to 300 C, depending on the reactor geometry and process parameters. However, dense and transpar-ent SiO2
films are obtained only for low TEOS molar fractions.12
The higher the precursor molar fraction is, the higher are the car-bon and hydrogen contents of the films.12,13 Comparison of the films obtained from either TEOS or hexamethyldisiloxane reveals strong correlations between the organosilicon molecule and the film composition.14 This suggests that the precursor is fragmen-ted in the gas phase due to electron impacts of the plasma gas and these fragments drive the deposition rate. Under O3, SiO2 films can be deposited at temperatures starting from 350 C.15 They present smooth morphology and they uniformly coat low aspect ratio trenches.15 However, authors report particles genera-tion in the gas phase for this process16 and a strong inhibition of the deposition rate is observed due to homogeneous reactions
Free Radical Generation
High TEOS PECVD Thermal CVD
TEOS + O3
Medium Thermal CVD
TEOS + O2
Low TEOS Pyrolysis
20 100 200 300 400 500 600 700 800 900 1000 Process Temperature (°C)
Figure 1. Process temperature vs. free radical genera-tion for the various TEOS silica CVD routes.
occurring between TEOS and O3.17 Even if the PECVD and TEOS/O3 routes can lead to films with convenient properties for various applications, they also involve homogeneous chem-ical reactions due to the generation in the gas phase of large amounts of free radical species. For this reason, these pro-cesses are not the most appropriate ones to ensure uniform coatings and good deposition rate control for complex-in-shape structures.
The thermal CVD of silica from TEOS and oxygen, O2
mix-tures is poorly documented in the literature in terms of experi-mental results, chemical mechanisms, and associated kinetic data, probably because O3 has better answered to the microelec-tronic issues. At atmospheric pressure, the addition of O2 to TEOS
results in TEOS decomposition temperature as low as 272 C, that is, 255 lower than the temperature corresponding to the decomposition of TEOS alone.18 In this work, it is reported that ethanal, methanal, water, and CO2 are the resulting decomposition by-products. Pavelescu et al. deposited silica films in a tubular reactor from TEOS and O2 at atmospheric pressure in the
temperature range 350–850 C.19 The obtained deposition rates vary between 2 and 10 nm min−1. They first decrease with increasing temperature from 350 to 500 C and then increase above 500 C. Konakov et al. modeled SiO2 depo-sition from TEOS/O2
in a microreactor under atmospheric pres-sure between 300 and 800 C.20 They used the chemical mechanisms and kinetic data published by Coltrin et al. for SiO2 deposition from TEOS
pyrolysis at low pressure between 600 and 800 C,21 obtained from quantum chemistry calcula-tions.22 The use of TEOS pyrolysis mechanisms and kinetics to simulate SiO2 deposition
from TEOS/O2 clearly highlights the lack of data for this pathway. However, as illustrated in Figure 1, the TEOS/O2 route
presents some noticeable advan-tages, in particular a lower range of deposition temperatures in comparison with TEOS pyrolysis and less unsaturated species formation when compared with the PECVD and TEOS/O3 routes. These advantages could be of major importance to uni-formly coat complex in shape and/or thermally sensitive
substrates like membranes or new generations of nano- or opto-electronic devices.
Computational fluid dynamics (CFD) models for CVD reac-tors have been developed to analyze the local gas flow, temper- ature, and concentration profiles, as well as the local deposition rates on the substrates at the reactor scale.23,24 When combined
with experimental results, this is a valuable tool to optimize the geometry and the deposition conditions leading to the target film thickness and composition, especially on complex-in-shape substrates.25 This is the approach used in this study. Such mac-roscopic models can be coupled with microscopic surface models, for instance to link process parameters and film rough-ness26 or to optimize the substrate morphology to enhance light trapping of solar cells.27
This article aims to bring new information about the chemical mechanisms and the kinetic phenomena governing silica thin films deposited by CVD from TEOS and O2 at atmospheric pres-sure in a temperature range between 350 and 500 C. We apply an approach combining experimental studies and process analysis by numerical simulation, in order to develop an original apparent kinetic model. This model will help coating complex-in-shape substrates using optimized CVD reactor geometry and deposition conditions.
Materials and Methods Experimental
Deposition experiments were performed in a horizontal, hot wall tubular CVD fused silica reactor (24 mm diameter, 500 mm length) heated by a Trans Temp tube furnace. A stainless steel planar substrate holder (180 × 10 × 2 mm3) was placed at 115 mm from the reactor entrance, as shown in Figure 2. Experi-ments were performed at four set point (SP) temperatures (350, 400, 450, and 500 C), established using the fixed SP Ther-mocouple #1. The temperature was measured along the symme-try axis of the tubular reactor and also at the surface of the substrate holder. These measurements were performed every 30 mm along the reactor length, by using the Thermocouple #2, prior the CVD experiments. The CVD reactor inlet was con-nected to a TEOS bubbler system heated at 51 C. Fifty-eight standard cubic centimeters of nitrogen, N2 (99.9999%, Messer) bubbled through the liquid TEOS thus carrying the precursor vapors to the deposition zone. Five hundred and twenty standard cubic centimeters of O2 (99.999%, Messer) was added to the mixture just before the reaction chamber. Gas lines were heated between 75 and 100 C to prevent the condensation of TEOS. A dry pump and a pressure gauge connected to the outlet of the quartz tube were used to keep the total reaction pressure at 730 Torr.
O2 gas line
Gas Flow
N2 gas line
Thermocouple #1 Pressure Dry
Pump
Thermocouple #2 controller system
Substrate holder Trans Temp Furnace Exhaust
TEOS bubbler system
CVD tube Figure 2. Schematic view of the CVD reactor.
inlet Ø = 28 mm XZ plane CVD tube wall Substrate holder 295 mm z y x
Figure 3. 3-D computational domain of the CVD reactor.
180 mm
2 mm
outlet
17 mm
Silicon samples (30 × 10 × 0.2 mm3) cut from 4’ Si(100) wafers (Sil’tronix-ST) were degreased in an ultrasound bath using acetone for 5 min, then rinsed with ethanol for 5 min, and finally dried in Ar flow. Six samples were placed on the substrate holder at the beginning of the heated zone for each experiment, in order to cover an increasing temperature zone (total length of the samples: 180 mm). The experimental strategy was indeed to process SiO2 films deliberately in a nonisothermal zone and to place the first substrate at the beginning of the heated zone, in order to deduce a maximum of mechanistic and kinetic informa-tion from each experiment. This was expected to yield films of nonuniform thickness. In particular, as it will be detailed later, the quite direct contribution of TEOS to deposition can thus be studied as the TEOS partial pressure is known only at the reactor inlet, and Arrhenius-like graphs can be plotted.
The SiO2 thickness profiles were measured by reflectometry (NanoCalc 2000 UV/Vis) every 10 mm along the central axis of each sample.
Process model
We developed a CFD model considering gas phase and surface chemical reactions, using a purely continuous approach at a macro-scopic scale. The CVD reactor was simulated using the computer design software, mesh generator, and CFD code FLUENT 16.2 (ANSYS). FLUENT is a pressure-based, implicit Reynolds Aver-aged Navier Stokes solver that employs a cell-centered finite vol-ume scheme having second-order spatial accuracy. It discretizes any computational domain into elemental control volumes, and permits the use of quadrilateral or hexahedral, triangular or tetrahe-dral, and hybrid meshes. The following assumptions were made:
• Steady-state conditions,
• Laminar gas flow (Reynolds number lower than 1000), • Ideal gas,
• No compressibility effects due to the low value (maximum 0.04) of the Mach number in the reactive zone,
• No effect of the heats of reaction, because of the high dilu-tion of TEOS.
The O2 and N2 physical properties were taken from the FLUENT database, the Lenard Jones (L–J) parameters for TEOS were taken from the CHEMKIN data base (σ = 7.1 Å
and ε/k = 522 K), and the physical properties of the inter-mediate and by-products were assumed equal to those of TEOS. A three-dimensional (3-D) geometrical domain of 251,325 cells was used to represent the whole reactive zone. Figure 3 presents the 3-D geometry used for the calcula-tions. Quadrilateral meshes are displayed along the XZ plane.
The associated boundary conditions are the following: • At the gas inlet, a flat profile was considered on the gas velocity, and the mass flow rate was fixed at 1.36 × 10⁻⁵ kg s−1. In accordance with the process conditions, the mass frac-tion of TEOS, N2, and O2 were 3.8 × 10⁻³, 8.9 × 10⁻², and 0.9072, respectively, and the temperature of the gaseous mix-ture at the inlet was fixed at 80 C.
• On the walls and substrate surfaces, a classical no-slip con-dition was used for the gas velocity. The mass flux density of each species was assumed to be equal to the corresponding heterogeneous reaction rate. The surface temperatures were fixed to the experimental temperature profile measured on the walls (i.e., the substrate holder and the CVD reactor walls). • At the exit, classical Danckwerts conditions (diffusive flux densities equal to zero) were applied for gas velocity and mass fractions, the total pressure being fixed at the experimental value, 97,325 Pa.
The geometry of the reactor was discretized in order to ana-lyze simultaneously transport phenomena and chemical reac-tions occurring in the gas phase and on the substrate surface. The resolution of the equations of mass and momentum con-servation and thermal energy balance in each elementary ele-ment of the discretized geometry allowed to calculate the local gas flow and temperature profiles along the CVD reactor. The kinetic data concerning the homogeneous and heterogeneous reactions were considered into the species conservation equa-tions to predict the local distribution of species mass fraction and of SiO2 deposition rate.
The rates of the surface chemical reactions considered into FLUENT correspond to an Arrhenius type expression:
R
k
=
k
0,k exp −E
k :preactant n ð1ÞFigure 4. Photographs of the SiO2 films on the Si
sub-strates along the substrate holder for the four experiments.
where Rk holds for the rate of the reaction k in the forward direction (kmol m−2 s−1), k0 is the pre-exponential factor of the reaction k (kmol m−2 s−1 Pa−n), Eak (kJ mol−1) is the activa-tion energy of the reaction k, T (K) is the temperature of the
phase where the reaction k takes place, preactant (Pa) is the partial
pressure of the reactant, and n is the global order of the reaction
k. As oxygen is in large excess in comparison with TEOS, its partial pressure is constant in the reactor and then its effect has been included in the apparent kinetic pre-exponential factors.
For the homogeneous chemical reactions, Rk is expressed in kmol m−3 s−1 and k0 in kmol m−3 s −1 Pa−n. The homogeneous reactions occur into all the cells of the mesh corresponding to the gas phase. The heterogeneous reactions only happen on the surfaces of the cells corresponding to solid surfaces (reac-tor walls, substrate holder, and substrates themselves). The mesh and cell sizes remained constant.
Results and Discussion Experimental results
Figure 4 presents the photographs of the SiO2 films depos-ited on the six Si substrates along the substrate holder for the four SP temperatures studied. For each experiment, on the zones corresponding to the maximum deposition rates, radial and axial iridescences appear, attributed to thickness variations of the SiO2 films, as can be seen in Figure 5. The experiment realized at 350 C SP temperature reveals no film deposited on the three first silicon samples.
Figure 5 details the reactor thermal profile and the experi-mental deposition rates as a function of the position from the reactor inlet obtained for experiments performed at the four defined SP temperatures. The INT1, INT2, and total curves will be discussed in the next section. The temperature difference between the reactor inlet and outlet varies between 270 and
420 C depending on the SP temperature. An isothermal zone of
5 C exists at the last 10 cm of the substrate holder. Most of the deposition rates vary between 0.5 and 10 nm min−1; that is, in the same range as those reported in Pavelescu publication.19 They are strictly increasing for the 350 C SP temperature, whereas they increase sharply and then slowly decrease for the other SP temperatures.
Figure 6 presents the experimentally obtained deposition rates as a function of the inverse of the substrate temperature, for the four thermal profiles studied. It clearly appears that for the experiments corresponding to the SP temperatures of 400, 450, and 500 C, the first points of each experiment pre-sent a linear evolution in this Arrhenius-like graph. As they
Figure 5. Evolution of the reactor thermal profile (empty circles), of the experimental deposition rates (black squares, with the black dotted line given as a guide to the eye) and of the calculated ones, as a function of the posi-tion from the reactor inlet.
The total calculated deposition rate and the ones attributed to INT1 and to INT2 are illustrated by the bold red curve and by the dashed green and blue ones, respectively. The gray zone in each diagram depicts the position of the substrate holder in the reactor.
Figure 6. Evolution of the logarithm of the deposition rates of SiO2 as a function of the inverse of the surface
temperature for the experiments performed at the four SP temperatures.
are located at the beginning of the heated zone, these points correspond to a quite direct contribution of TEOS to SiO2 deposition. An activation energy of 161.3 kJ mol−1 is deduced from these points. This value cannot be compared with those of the literature, in particular with those of Pavelescu et al.,19 because the authors used deposition rate results obtained from samples positioned on a row in isothermal zones, that is, from gas phases with variable composition containing partly decom-posed TEOS. Their reported activation energies are representa-tive of numerous chemical reactions, therefore they are apparent.
For the 350 C SP temperature, the deposition-free zone in the first 9 cm of the substrate holder corresponds to a substrate temperature which does not exceed 300 C, as can be seen in Figure 5. This means that for the conditions tested, the mini-mum temperature for SiO2 deposition is 300 C. For the exper-iments corresponding to the SP temperatures between 400 and 500 C, Figure 6 confirms that the deposition rate first increases with temperature up to 360–380 C and then decreases. This behavior is characteristic of the existence of two sets of chemical reactions, with probably a rather direct contribution of TEOS in the first temperature range, followed by a strong contribution of intermediate species above 380 C. For the 350–500 C temperature range, Pavelescu et al.19
obtained a decreasing evolution of the deposition rate, proba-bly due to the position of their substrates on a row in an iso-thermal zone as previously mentioned. Their results are then coherent with ours obtained in the zone of decreasing deposition rate.
Literature results discussion and elaboration of a kinetic model
Table 1 synthetically presents literature information on the activation energies and the experimentally determined by-products during SiO2 deposition from the pyrolysis of TEOS and from TEOS/O2. Most of the studies were conducted at low pressure and at temperatures higher than 500 C. The apparent activation energy for the 600–800 C range remains close to 190 kJ mol−1 and the nature of the by-products is quite identical whatever the conditions tested. This agreement among the authors highlights the fact that the same phenom-ena probably govern the SiO2 deposition and are relatively independent of process parameters.
Chu et al.28 compared the thermal stability of tetramethyl orthosilicate and TEOS. They obtained activation energies of 339 and 205 kJ mol−1, respectively. The authors assumed that the initiation step of the TEOS pyrolysis reaction occurs in the gas phase through the involvement of two ethoxy ligands OCαH2C βH3. A six-centered unimolecular arrangement is obtained by an α-elimination mechanism, which catalyzes the reaction and decreases the activation energy. The resultant intermediate species is O Si(OC2H5)2 which is responsible for the surface reaction, and the corresponding by-products are ethylene and ethanol. Ethylene, and at a lesser extend ethanol and ethanal were detected by Fourier transform infrared spec-trometry16,22 and by mass spectrometry.29 Chu et al. also car- ried out TEOS decomposition studies in the presence of toluene and obtained kinetic parameters which at 477 C were one order of magnitude smaller than those with TEOS alone. As toluene is a well-established chain inhibitor, these results indicate possible contributions from a radical-induced mechanism.30
Takeuchi et al.31 investigated the decomposition of TEOS in a CVD reactor at 677 C and 13 Pa and identified hex-aethoxysiloxane in the products by direct mass spectrometric analysis. The collected condensed product revealed the pres-ence of ethoxy-containing silica in the solid component, while the liquid phase was pure ethanol. The deposition rate profiles were suggestive of two reactive intermediates.
As said in Introduction, Pavelescu et al.,19 processed SiO2 films from TEOS/O2 mixtures in a hot wall CVD reactor at atmospheric pressure between 350 and 800 C. The obtained Arrhenius plot reveals two deposition rate regimes, noticeably
Table 1. Experimental Kinetic Data and By-Products Determined for SiO2 CVD from TEOS
Reactants T( C) P (Torr) Ea (kJ mol−1) By-Products References TEOS + N2 500–800 0.3 192.5 Ethylene, ethanol, ethanal [23]
650–800 1–3 188.3
TEOS + N2 450–550 725–755 205 CO, ethylene, ethanal [24]
TEOS + N2 680–700 0.25–0.4 184 – [3] TEOS + N2 650–800 1–4 188.3 – [25] TEOS + O2 700–800 0.30 192.5 – [26] (10:1 vol) 10−4 TEOS 750–830 184 – [21]
TEOS + Ar 527 10−3 and 760 – Ethylene, ethanol, methane, CO, ethanal, water [18]
TEOS + O2 277 760 – Water, CO2, methanal, ethanal, CO
TEOS + O2 350–500 760 −25.1 – [19]
Table 2. Apparent Chemical Volumetric Reactions and Associated Kinetic Data
Apparent Chemical Reaction Ea (kJ mol−1) k0 (kmol m−3 s−1 Pa−n) n
Si(OC 161.3 1.15 × 10 6 1 (R1) 2H5) 4 (g) + O2 (g) !INT1 (g) + P1 (g) 205 10 1 (R2) INT1 (g) + O2 (g) ! INT2 (g) + P2 (g) 6 × 10
a negative activation energy of −25.1 kJ mol−1 for the global reaction at temperatures lower than 500 C. The authors corre-lated this energy with the adsorption–dissociation mechanism of O2 molecules. At higher temperatures, (>550 C), the activa-tion energy equals 46 kJ mol−1 and it was associated with the heat of combustion of the C O H groups.
Desu3 performed SiO2 deposition from TEOS pyrolysis in a hot wall CVD reactor at low pressure (33–53 Pa), between 600 and 800 C. He concluded that TEOS decomposition involves the dissociation of a C O bond and that the formed gas phase intermediate is probably an ethoxy based silica such as O Si(OC2H5)2. He proposed a three-step model to repre-sent the decomposition chemistry of TEOS, following which TEOS undergoes an unimolecular decomposition in the gas phase to produce the intermediate O Si(OC2H5)2, which is adsorbed on a surface site and finally decomposed to form SiO2 films.
Coltrin et al.21 proposed another model for the formation of SiO2 films from the pyrolysis of TEOS between 600 and 800 C. Parts of their data come from quantum calculations. Four gas phase chemical reactions are considered, among which the one with the highest activation energy corresponds to the formation of a gaseous intermediate. They assumed that during this step, TEOS is decomposed via the β-hydride elimi-nation channel, forming C2H4 and Si(OH)(OC2H5)3. This spe-cies has the lowest activation energy in the surface and produces directly SiO2.
The relative contribution of gas phase and surface reactions during CVD from TEOS pyrolysis was experimentally investi-gated by Hong et al.32 The authors proposed a model that includes a polymerization reaction of TEOS resulting in two groups of intermediate, a high-activity and a low-activity ones that participate to the deposition of the SiO2 film.33
This literature compilation reveals that SiO2 deposition mechanism during TEOS pyrolysis is governed by the surface reaction of TEOS and/or the participation of one or two inter-mediates that are formed in the gas phase. For some authors, TEOS decomposes in the gas phase as the initial step and cre-ate intermedicre-ate(s) that drive the surface reaction. For others, both TEOS and intermediates contribute to SiO2 film growth. Using O2, Pavelescu et al.19 suggest a strong homogeneous activity that inhibits the deposition rate at temperature lower than 500 C. At higher temperature, the activation of an inter-mediate with higher activation energy could explain the increase of the deposition rate with the temperature. To con-clude, homogeneous reactions are highlighted during both pyrolysis and under oxygen atmosphere experiments but the first step of the reaction still remains unclear. This information is a key parameter to develop an apparent kinetic model.
On the basis of the information available in the literature and of the experimental results of the previous section, we
have developed an apparent chemical mechanism involving two homogeneous chemical reactions of TEOS decomposition and two heterogeneous reactions, as detailed in Tables 2 and 3. Each apparent chemical reaction represents numerous real chemical reactions which are unknown. Fictive intermediate species called INT1 and INT2 are considered standing for the various species formed from TEOS decomposition. We have obtained the corresponding kinetic data by comparing the cal-culated deposition rates given by the CFD code FLUENT and the experimental ones, for the SP temperatures 400, 450, and 500 C.
The simulation results obtained with this kinetic model in terms of deposition rate due to each species (INT1, INT2, and Total) along the reactor length for the four runs are compared with the experimental deposition rates in Figure 5.
The first apparent reaction (R1) results in the formation of the intermediate species INT1, representing a set of gaseous molecules related to TEOS decomposition, probably mainly O Si(OC2H5)2 according to the literature.3,28 (R1) occurs as soon as the TEOS temperature exceeds 300 C; its activation energy is fixed to the value deduced from the first points of the Arrhenius-like graph of Figure 5. INT1 gives rise to the heterogeneous reaction (R3), responsible for the initial abrupt increase of the SiO2 deposition rate, illustrated in Figure 5. This reaction (R3) has a low activation energy indicating that, as soon as INT1 is formed, it reacts on the surface. The uncon-verted INT1 can then react homogeneously to form the inter-mediate molecule INT2 through reaction (R2), whose activation energy is higher than that of (R1). (R2) is responsi-ble for the quite sharp decrease of the deposition rate after its maximum. The various gaseous species represented by INT2 can also provide SiO2 (reaction (R4)) and in this way they attenuate the sharp decrease of the growth rate observed at SP temperatures of 400 and 450 C, or even result in rather con-stant deposition rates observed at 500 C. Each apparent reac-tion (Ri) forms a set of gaseous by-products gathered under the name Pi.
It is worth noting that this apparent chemical mechanism was selected after having tested several alternative ones. In particu-lar, we tested a reaction scheme implying the contribution of TEOS both to the direct deposition of SiO2 and to the formation of two intermediate gaseous species, among which one also yields SiO2.
This mechanism cannot reproduce the experimental results, because the simulations revealed that TEOS is sharply consumed near the reactor walls and the substrate holder, due to the abrupt increase of deposition rate on the first samples. As operation at atmospheric pressure results in reduced gas diffu-sivity, the computed TEOS concentrations were close to zero in the vicinity of the walls and the substrates. As a consequence, the subsequent formation of intermediate species from TEOS, which serve as SiO2 precursors in the zone of the last three
Table 3. Apparent Chemical Surface Reactions and Associated Kinetic Data
Apparent Chemical Reaction Ea (kJ mol−1) k0 (kmol m−2 s−1 Pa−n) n INT1 (g) + O
2 (g) !SiO2 + P3 (g) 12.26 1.29 × 10
−6 1 (R3)
30 −10 2 (R4)
Figure 7. Local gas velocity profiles along the XZ plane for the four experiments.
samples, was not possible. This is why it was mandatory to design a first homogeneous reaction producing a gaseous inter-mediate species INT1 in the entire reactor volume. The preemi-nence of this homogeneous reaction is supported by the intermolecular interactions in the gas phase prevailing at atmo-spheric pressure. It is also in agreement with the literature, as stated by Chu et al.28 and Desu.3 The observed iridescences in Figure 4 indicate that INT1 probably represents quite reactive species with surfaces. The INT2 molecules seem more stable, because the three last samples on the substrate holder are quite uniformly coated.
It must be highlighted that this apparent chemical scheme is not the only simple model that can represent the experi-mental results obtained. In particular, competition between reaction and desorption of an intermediate could cause the observed evolution as a function of temperature. It is also interesting to note that the competition between adsorption and desorption from an adsorbed reactive species could explain the results from 350 to 450 C (with an increase of the desorption rate with temperature). However, when observing the experimental deposition rate profiles for the SP tempera-tures of 450 and 500 C (Figure 5), the deposition rate is close to 2 nm min−1 at 0.295 m from the inlet for both experiments, position where the temperature is, respectively, equal to 450 and 500 C. This indicates that an intermediate species (with higher activation energy) is activated and participates to the deposition, to counterbalance the decrease of the deposition rate.
Moreover, as shown by Pavalescu et al.,19 at temperatures higher than 500 C, the deposition rate no more decreases with temperature. So, to explain the change of deposition rate behavior vs. temperature, it is likely that an intermediate spe-cies is created and participates to SiO2 deposition. This
Figure 8. Temperature distribution fields along the XZ plane for the four experiments.
Figure 9. Local deposition rates on the surface of the substrate holder for the four experiments.
intermediate species has a low impact for the deposition rate at low temperature (<350 C) and its activity increases with temperature, as stated by our model.
Process simulation results
Once implemented and validated in terms of deposition rate, the simulation model was used to obtain local hydrodynamic, thermal, and mass transfer information. All the results below correspond to local profiles along the XZ vertical plane crossing the reactor symmetry axis, as illustrated in Figure 3. Figure 7 presents the local gas velocity profiles inside the reactor for the four runs performed. The velocity profile is parabolic, as classi-cally observed for laminar gas flow. The maximum gas velocity is observed in the hottest zones of the reactor and is close to 0.1 m s−1. The corresponding minimum gas residence time in the computed zone is close to 5 s, which is rather high for a hot wall CVD reactor24 due to the operation at atmospheric pres-sure, and favors the homogeneous chemical reactions. The gas velocity is close to zero under the substrate holder.
The local temperature profiles inside the reactor are pre-sented in Figure 8. They are parabolic, the walls and substrates being hotter than the bulk of the gas. Such profiles can be explained by the dominance of the convective phenomena and by the low thermal conductivity of the gaseous phase.
The calculated local deposition rate profiles are given in Figure 9. A careful comparison with the experimental local pro-files shown in Figure 4 reveal a striking agreement on both the shape and the values of the deposition rate profiles. This agree-ment validates the elaborated apparent chemical model and the
Figure 10. Local mass fraction profiles of TEOS along the XZ plane for the four experiments.
Figure 11. Local mass fraction profiles of the intermedi-ate INT1 along the XZ plane for the four experiments.
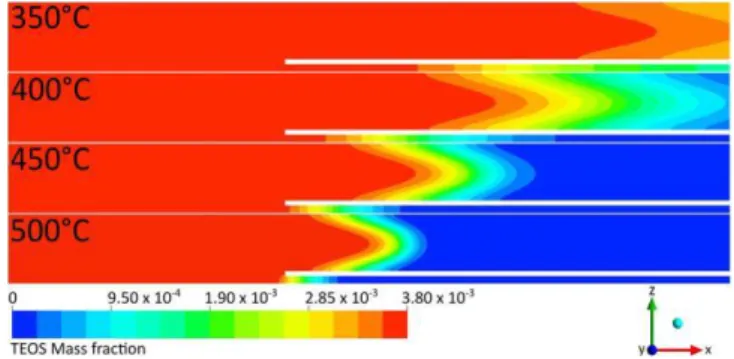
associated kinetic laws as a possible representation of the phe-nomena involved, for the range of operating conditions tested. The local TEOS mass fraction profiles are presented in Figure 10. TEOS is totally consumed into the reactor between 400 and 500 C, but the TEOS overall conversion rate into SiO2 is only equal to 7.5, 15.2, 15.5, and 17.7% for the 350, 400, 450, and 500 C SP temperatures, respectively. This is quite low, due to the low surface area of solid surfaces in this reactor and to the low gas diffusivity imposed by the atmospheric pressure. Except for the 350 C SP temperature, the axial evolution of the TEOS mass fractions profiles is rather abrupt in the zones corresponding to the maximum deposition rates. Its axial gradient becomes steeper with increasing temperature. It appears closer to the reactor inlet below the substrate holder, because the gaseous volume to solid surface ratio is lower in that area.
Figures 11 and 12 present, respectively, the INT1 and INT2 local mass fraction profiles. The concentration of INT1 is approximately 30 times lower than that of TEOS. Expectedly, INT1 is the most concentrated in the zones of maximum depo-sition rate as it gives rise to the heterogeneous reaction (R3). Its consumption after this zone increases with the temperature. The mass fraction gradients for INT1 are very sharp, espe-cially from 450 C, due to the high surface reactivity of this species imposed by the low activation energy of reaction (R3). The INT2 mass fractions are of the same order of magnitude as those of TEOS, as INT2 is the main product of decomposi-tion of TEOS in the gas phase for the condidecomposi-tions tested. The local profiles of Figure 12 present smooth evolutions in partic-ular near the walls, corresponding to the behavior of quite
stable species, which can be explained by the higher activation energy of the (R4) reaction, in comparison with the (R3) one.
Conclusion
An original range of operating conditions, that is, at atmo-spheric pressure and temperatures between 350 and 500 C, was explored with the aim to develop an apparent kinetic model for the CVD of SiO2 from TEOS and O2. A detailed bibliographic survey and dedicated experiments performed on planar substrates in nonisothermal zones of a hot wall tubular reactor were used. The kinetic model was implemented into the CFD code FLUENT and validated both in shape and value by comparison with the experimental deposition rate profiles. These results indicate that for the conditions tested, a possible representation of SiO2 deposition involves two intermediate species formed from TEOS homogeneous decomposition, the first one being active from 300 C and the second one contrib-uting to deposition for temperatures higher than 370 C.
Calculated local profiles of gas flow, gas temperature, spe-cies mass fractions, and silica deposition rates were analyzed. They reveal that the first intermediate species is responsible for the marked thickness gradients, due to its high surface reactivity, the second one being more stable as producing more uniform film thicknesses.
This model has been developed to be used for the optimiza-tion of the deposioptimiza-tion condioptimiza-tions to coat complex-in-shape substrates, probably in different reactor geometries with much more isothermal zones. In particular, the coating could be per-formed in regions for which the second intermediate is active, after having organized the appropriate thermal conditions upstream.
By combining experimental studies and numerical simula-tions, the proposed approach allows a better control of the physical and chemical mechanisms occurring during the CVD of SiO2 for this original range of deposition conditions. This approach could be applied to other CVD processes. The inter-mediate molecules being fictive and accounting for numerous real species, the apparent kinetic model could be improved through additional experimental information, in particular gas phase composition.
Acknowledgments
The authors acknowledge I. Touche from LGC for her help on the CFD simulations.
Figure 12. Local mass fraction profiles of the intermedi-ate INT2 along the XZ plane for the four experiments.
Literature Cited
1. Röhl FS, Becker S. Low pressure deposition of deposed SiO2 by
pyrolysis of tetraethylorthosilicate (TEOS). J Electrochem Soc. 1987; 134(11):2923-2931.
2. Crowell JE, Tedder LL, Cho HC, Cascarano FM, Logan MA. The chemical vapor deposition of SiO2 from TEOS. J Electron Spectrosc
Relat Phenom. 1990;54-55(C):1097-1104.
3. Desu SB. Decomposition chemistry of tetraethoxysilane. J Am Ceram Soc. 1989;72(9):1615-1621.
4. Callard S, Gagnaire A, Joseph J. New method for in situ control of Bragg reflector fabrication. Appl Phys Lett. 1996;68(17):2335-2336. 5. Martinet C, Paillard V, Gagnaire A, Joseph J. Deposition of SiO2 and
TiO2 thin films by plasma enhanced chemical vapor deposition for
antireflection coating. J Non-Cryst Solids. 1997;216:77-82.
6. Erlat AG, Wang B-C, Spontak RJ, et al. Morphology and gas barrier properties of thin SiOx coatings on polycarbonate: correlations with plasma-enhanced chemical vapor deposition conditions. J Mater Res. 2000;15(3):704-717.
7. Premkumar PA, Starostin SA, Creatore M, et al. Smooth and self-similar SiO2 -like films on polymers synthesized in roll-to-roll atmo-spheric pressure-PECVD for gas diffusion barrier applications. Plasma Processes Polym. 2010;7:635-639.
8. Nitodas S, Favvas E, Romanos G, Papadopoulou M, Mitropoulos A, Kanellopoulos N. Development and characterization of silica-based membranes for hydrogen separation. J Porous Mater. 2008;15:551-557.
9. Motoaki A, Okuyaman K, Tohge N, Shimada M, Satoh JI, Muroyama M. Gas-phase nucleation in an atmospheric pressure chemi-cal vapor deposition process for SiO2 films using TEOS. Jpn J Appl Phys.
1992;31:L1439-L1442.
10. Rojas S, Modelli A, Wu WS, Borghesi A, Pivac B. Properties of sili-con dioxide films prepared by low-pressure chemical vapor deposition from tetraethylorthosilicate. J Vac Sci Technol B Microelectron Nanom Struct. 1990;8(6):1177.
11. Nguyen S, Dobuzinsky D, Harmon D, Gleason R, Fridmann S. Reac-tion mechanisms of plasma and thermal assisted chemical vapor depo-sition of tetraethylorthosilicate oxide Films. J Electrochem Soc. 1990; 137(7):2209-2215.
12. Valle C, Goullet A, Granier A, Lee AVD, Durand J. Inorganic to organic crossover in thin films deposited from O2 /TEOS plasmas. J Non Cryst Solids. 2000;272:163-173.
13. Deshmukh SC, Aydil ES. Investigation of SiO2 plasma enhanced chemical vapor deposition through tetraethoxysilane using attenuated total reflection Fourier transform infrared spectroscopy. J Vac Sci Technol. 1995;13(5):2355-2367.
14. Granier A, Goullet A, Gaboriau F, Turban G, Aumaille K, Valle C. A comparative study of oxygen / organosilicon plasmas and thin SiOxCyHz
films deposited in a helicon reactor. Thin Solid Films. 2000;359:188-196.
15. Fujino K, Nishimoto Y, Tokumasu N, Maeda K. Silicon dioxide depo-sition by atmospheric pressure and low-temperature CVD using TEOS and ozone. J Electrochem Soc. 1990;137(9):2883-2887.
16. Shareef IA, Rubloff GW, Gill WN. Role of gas phase reactions in sub-atmospheric chemical vapor deposition ozone/TEOS processes for oxide deposition. J Vac Sci Technol B. 1996;14(2):772-774.
17. Kawahara T, Yuuki A, Matsui Y. Related content reaction mechanism of chemical vapor deposition using tetraethylorthosilicate and ozone at atmospheric pressure. Jpn J Appl Phys. 1992;31:2925-2930.
18. Van Der Vis MGM, Cordfunke E, Konings R. The thermodynamic properties of tetraethoxysilane (TEOS) and an infrared study of its thermal decomposition. J Phys IV. 1993;3:75-82.
19. Pavelescu C, Kleps I. Activation energies in chemical vapour deposi-tion kinetics of SiO2 films using TEOS chemistry. Thin Solid Films.
1990;190:L1-L3.
20. Konakov S, Krzhizhanovskaya VV. Modeling chemical vapor deposi-tion of silicon dioxide in microreactors at atmospheric pressure. J Phys Conf Ser. 2015;574:1-4.
21. Coltrin ME, Ho P, Moffat HK, Buss RJ. Chemical kinetics in chemical vapor deposition: growth of silicon dioxide from tetraethoxysilane (TEOS). Thin Solid Films. 2000;365(2):251-263.
22. Allendorf MD, Melius CF. Theoretical study of thermochemistry of molecules in the silicon-carbon-chlorine-hydrogen system. J Phys Chem. 1993;97(3):720-728.
23. Kleijn CR. Computational modeling of transport phenomena and detailed chemistry in chemical vapor deposition – a benchmark solu-tion. Thin Solid Films. 2000;365:294-306.
24. Vergnes H, Samélor D, Gleizes A, Vahlas C, Caussat B. Local kinetic modeling of aluminum oxide metal-organic CVD from aluminum tri-isopropoxide. Chem Vap Deposition. 2011;17(7–9):181-185. 25. Etchepare PL, Vergnes H, Samelor D, Sadowski D, Caussat B, Vahlas
C. Modelling of a DLI MOCVD process to coat by alumina the inner surface of bottles. Surf Coat Technol. 2015;275:167-175.
26. Aviziotis IG, Cheimarios N, Duguet T, Vahlas C, Boudouvis AG. Multiscale modeling and experimental analysis of chemical vapor deposited aluminum films: linking reactor operating conditions with roughness evolution. Chem Eng Sci. 2016;155:449-458.
27. Crose M, Kwon JSI, Nayhouse M, Ni D, Christofides PD. Multiscale modeling and operation of PECVD of thin film solar cells. Chem Eng Sci. 2015;136:50-61.
28. Chu JCS, Breslin J, Wang NS, Lin MC. Relative stabilities of tetra-methyl orthosilicate and tetraethyl orthosilicate in the gas phase. Mater Lett. 1991;12(3):179-184.
29. Morancho R, Delperier B, Vinante C. Analysis and modelling of tetra-ethoxysilane pyrolysis. J Anal Appl Pyrolysis. 1988;13:141-149. 30. Herzler J, Manion JA, Tsang W. Single-pulse shock tube study of the
decomposition of tetraethoxysilane and related compounds. J Phys Chem A. 1997;101(30):5500-5508.
31. Takeuchi H, Izumi H, Kawasaki A. Decomposition study of TEOS in thermal CVD. Mater Res Soc. 1994;334:45-50.
32. Hong LS, Shimogaki Y, Komiyama H. Macro/microcavity method and its application in modeling chemical vapor deposition reaction sys-tems. Thin Solid Films. 2000;365(2):176-188.
33. Sorita T, Shiga S, Ikuta K, Egashira Y, Komiyama H. The formation mechanism and step coverage quality of tetraethylorthosilicate-SiO2
films studied by the micro macrocavity method. J Electrochem Soc. 1993;140(10):2952-2959.