https://doi.org/10.4224/12341004
Questions? Contact the NRC Publications Archive team at
PublicationsArchive-ArchivesPublications@nrc-cnrc.gc.ca. If you wish to email the authors directly, please see the first page of the publication for their contact information.
https://publications-cnrc.canada.ca/fra/droits
L’accès à ce site Web et l’utilisation de son contenu sont assujettis aux conditions présentées dans le site
LISEZ CES CONDITIONS ATTENTIVEMENT AVANT D’UTILISER CE SITE WEB.
READ THESE TERMS AND CONDITIONS CAREFULLY BEFORE USING THIS WEBSITE.
https://nrc-publications.canada.ca/eng/copyright
NRC Publications Archive Record / Notice des Archives des publications du CNRC : https://nrc-publications.canada.ca/eng/view/object/?id=341d8b91-4d2b-4f27-86cf-6778ec13264a https://publications-cnrc.canada.ca/fra/voir/objet/?id=341d8b91-4d2b-4f27-86cf-6778ec13264a
Archives des publications du CNRC
For the publisher’s version, please access the DOI link below./ Pour consulter la version de l’éditeur, utilisez le lien DOI ci-dessous.
Access and use of this website and the material on it are subject to the Terms and Conditions set forth at
Ice-induced global loads on USCGC Healy and CCGS Louis S. St-Laurent as determined from whole-ship motions
TP 14291E
Ice-Induced Global Loads on USCGC HEALY and
CCGS LOUIS S. ST-LAURENT
as Determined from Whole-ship Motions
M. Johnston, R. Frederking, G. Timco and M. Miles
Technical Report, CHC-TR-014
TP 14291E
Ice-Induced Global Loads on USCGC HEALY and
CCGS LOUIS S. ST-LAURENT
as Determined from Whole-ship Motions
M. Johnston, R. Frederking, G. Timco and M. Miles Canadian Hydraulics Centre
National Research Council of Canada Montreal Road
Ottawa, Ontario K1A 0R6
Prepared for: Transport Canada 11th Fl. Place de Ville, Tower C
330 Sparks Street Ottawa, Ontario K1A 0N8
Technical Report, CHC-TR-014 March 2003
Abstract
This report provides documentation on the recently updated MOTAN system. The MOTAN uses measured whole-ship motions to obtain the global loads associated with transient ice impacts. Model-scale and full-scale data are used to demonstrate the feasibility of using the MOTAN system to provide reliable information on global loads. Whole-ship motions of the icebreakers HEALY and LOUIS, which have similar ship displacements, are used to determine ice-induced global loads for more than 200 impacts. Results show good agreement between global loads measured on the HEALY and LOUIS. Impacts with warm first-year ice at ship speeds up to 11 kt caused global loads from 1.7 to 7.0 MN. Impacts with medium to thick second-year and multi-year ice at speeds from 0.6 to 16.1 kt resulted in global loads from 1.9 to 17.3 MN. The three highest global loads on the LOUIS (15.7, 16.7 and 17.3 MN) resulted from ramming a rubbled multi-year floe at about 11 kt. The three impacts occurred in quick succession, over a period of about 5 seconds, as the ship slowed to 5 kt from 11 kt. Plotting the initial impact force (the first in a series) versus ship speed showed a clear trend of increasing global load with increasing ship speed, for the multi-year ice events. A lesser correlation was found for thick second-year ice impacts and no apparent correlation for thick first-year and medium second-year ice impacts.
Résumé
Le présent rapport documente le système MOTAN récemment modernisé. Le MOTAN fait appel aux mouvements des navires mesurés pour évaluer les charges globales associées aux impacts des glaces transitoires. Les données extraites d’un modèle et des navires mêmes sont utilisées pour démontrer la faisabilité de l’utilisation du système MOTAN pour assurer de l’information fiable sur les charges globales. Les mouvements de navire des brises-glaces HEALY et LOUIS ont été utilisés pour déterminer les charges globales exercées par les glaces lors de plus de 200 impacts. Les résultats montrent une bonne concordance entre les charges globales mesurées sur le HEALY et le LOUIS. Les impacts de glace tempérée de l’année survenus à une vitesse de 11 nœuds créent des charges globales de 1,7 à 7,0 MN. Les impacts contre des glaces d’épaisseur moyenne à très épaisse vieilles de deux ou de plusieurs années à des vitesses de 0,6 à 16,1 nœuds produisent des charges globales de 1,9 à 17,3 MN. Les trois plus grosses charges du LOUIS (15,7, 16,7 et 17,3 MN) ont été provoquées par l’impact à environ 11 nœuds d’un tassage de floe de glace pluriannuelle cassée et reformée. Les trois impacts sont survenus en succession rapide en 5 secondes environ, le navire ayant alors ralenti de 11 à 5 nœuds. Le pointage de l’impact initial (le premier d’une série) par rapport à la vitesse du navire révèle une nette tendance d’augmentation de la charge globale en présence d’une vitesse de navire croissante pour des événement avec des glaces pluriannuelles. Une corrélation moins forte a été constatée lors des impacts de glace épaisse vielle de deux ans, mais aucune corrélation apparente pour les impacts de glace épaisse de l’année et moyennement épaisse vieille de deux ans.
Table of Contents
Abstract... i Table of Contents...iii List of Figures ... v List of Tables... v 1.0 Introduction ... 1 2.0 Background ... 13.0 MOTAN Inertial Measurement System ... 2
3.1 Measuring Whole-ship Motions... 2
3.2 HPF Program, Determining Total Vertical Force for Symmetrical Impacts... 3
4.0 Validation of HPF Program: Model Tests... 5
4.1 Results of CHC Model Tests: Symmetrical Impacts... 6
4.2 Results of CHC Model Tests: Oblique Impacts ... 9
4.3 Developing Software to Determine Global Forces for all Impact Types... 9
4.4 Meeting to Discuss Changes to Load Calculation Software ... 9
4.5 Development of Hydrodynamic Coefficients... 10
4.6 Equations of Motion used in Developing New MOTAN Software... 11
4.7 EFM: Second-Generation Load Calculation Software ... 11
4.8 Determining Salient Components of the Global Ice Impact Force ... 12
4.8.1 Longitudinal Ice Impact Force Component, Fx... 14
4.8.2 Lateral Ice Impact Force Component, Fy... 14
4.8.3 Vertical Ice Impact Force Component, Fz... 14
4.9 Global Ice Impact Force: Resultant ... 14
5.0 Validation of EFM Program ... 15
5.1 CHC Model Tests ... 15
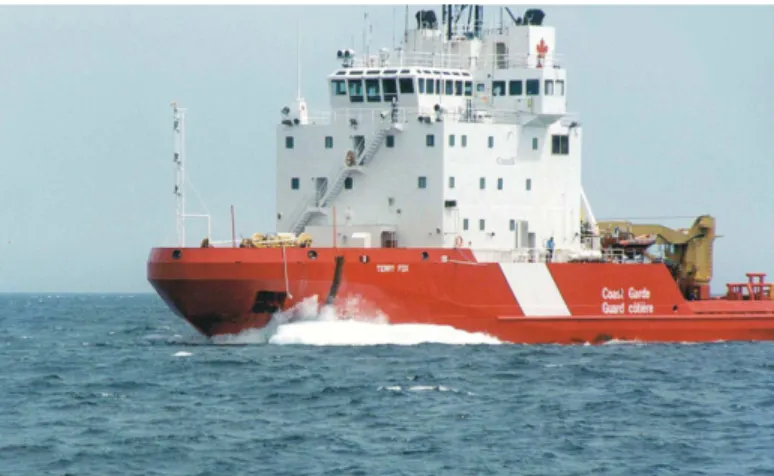
5.2 Full-scale Validation using TERRY FOX Data ... 15
5.2.1 MOTAN... 16
5.2.2 IMD External Impact Panel ... 16
5.2.3 Strain-Gauged Area... 17
5.2.4 Global Loads at Full-scale: Qualitative Assessment ... 17
6.0 Full-scale MOTAN Installations on HEALY and LOUIS ... 18
6.1 MOTAN Installation on USCGC HEALY... 18
6.1.1 Selecting Global Loads on HEALY: Representative Event... 19
6.2 MOTAN Installation on CCGS LOUIS S. ST-LAURENT ... 23
6.2.1 Selecting Global Loads on the LOUIS: Representative Event... 24
7.0 Comparison of Global Loads on HEALY and LOUIS ... 27
7.1 Global Load Based Upon Ice Type... 28
7.1.1 Characterizing Ice Types in Early and Late Season ... 28
7.1.2 Thick First-year Ice ... 28
7.1.3 Second-year and Multi-year Ice in Late Season ... 29
7.1.4 Global Loads Corresponding Only to Initial Impacts... 30
8.0 Conclusions ... 31
9.0 Recommendations... 32
10.0 Acknowledgments... 33
11.0 References... 33 Appendix A: Model Tests at Canadian Hydraulics Centre ...A-1 Appendix B: Hydrodynamic Coefficients for HEALY, LOUIS and FOX... B-1
List of Figures
Figure 1 Schematic of MOTAN system...2
Figure 2 Schematic of model test program conducted at Canadian Hydraulics Centre ...5
Figure 3 Comparison of vertical force from MOTAN and dynamometer, full-scale...7
Figure 4 Vertical forces measured by the MOTAN and dynamometer for head-on rams,...8
Figure 5 MOTAN-derived vertical bow force in relation to ship speed...8
Figure 6 Output from EFM1 program... 12
Figure 7 Components used to calculated global ice impact force... 13
Figure 8 Ship-ice collision during the Bergy Bit Trials, June 2001... 15
Figure 9 Global loads from MOTAN compared to two other instrumentation systems ... 17
Figure 10 Location of MOTAN on HEALY... 18
Figure 11 Ship loads and motions of HEALY during part of Event H14 ... 21
Figure 12 Ship loads and motions of HEALY during later part of Event H14... 22
Figure 13 Location of MOTAN on LOUIS... 24
Figure 14 Ship loads and motions of LOUIS during first ram of Event L42 ... 25
Figure 15 Ship loads and motions of LOUIS during second ram of Event L42... 26
Figure 16 Global ice impact forces measured on HEALY and LOUIS... 27
Figure 17 Global loads on the HEALY and LOUIS, according to ice type... 29
Figure 18 Three highest global loads measured during the LOUIS trials ... 30
Figure 19 Global ice impact forces on the LOUIS, initial impact only ... 31
List of Tables
Table 1 Ship Parameters required for Hydrodynamic Coefficients ... 10Ice-Induced Global Loads on USCGC HEALY and
CCGS LOUIS S. ST-LAURENT
as Determined from Whole-ship Motions
1.0
Introduction
Ice-induced global loads on the USCGC HEALY and the CCGS LOUIS S. ST-LAURENT are presented. The global loads documented in this report were obtained from the whole-ship motions measured by the MOTAN system. This report provides a detailed description of the MOTAN system, discusses changes that have been made to the system since its first full-scale installation in 2000, presents results from validation studies and documents global loads for more than 200 impacts with first-year, second-year and multi-year ice. The work was sponsored by Transport Canada.
2.0
Background
Traditionally, global ice impact loads on ships have been measured by installing strain gauges on strategic hull-girder beams throughout the ship. That approach involves treating the ship as an elastically deformable structure and measuring its structural deformations. The ice loads on local areas of the ship can be measured by installing strain gauges on the frames and stringers adjacent to the ship’s outer plating. Although the installation and calibration of the strain gauges require considerable time and money, that type of instrumentation can be effective for measuring global and local loads.
In April 2000, the Canadian Hydraulics Centre (CHC) of the National Research Council of Canada developed a novel approach for determining global loads on ships. Assuming the ship is a rigid body, the measured whole-ship motions can be used to obtain the external ice forces. MOTAN measures whole-ship motions in six-degrees of freedom and then uses those motions to determine the various ice force components at the point of impact. To date, MOTAN has been used on the USCGC HEALY (Johnston et al., 2001-a), CCGS LOUIS S. ST-LAURENT (Johnston et al., 2001-b) and the CCGS TERRY FOX (Johnston et al. in Gagnon et al., 2002-a).
3.0
MOTAN Inertial Measurement System
MOTAN is a two-part package (Figure 1). The first part consists of a portable MOTAN instrument that is used to measure whole-ship motions. The second part consists of the computer software needed to process output from the MOTAN instrument. The physical sensor weighs 1.88 kg and is 260 mm by 160 mm wide by 100 mm. Its three accelerometers and three angular rate sensors are used to measure whole-ship motions in six degrees of freedom. The accelerometers measure the total ship acceleration (including the earth’s gravity components) and the rate sensors measure the three-dimensional angular rotational rate of the ship, along a fixed coordinate system. All recorded motions are resolved along the instantaneous positions of the X, Y and Z body axes of the ship.
MOTAN
Rate Acceleration Sensor:
3 accelerometers 3 angular rate sensors
Computer Software: Displacement Surge x x x Sway y y y Heave z z z Pitch θ θ θ Roll φ φ φ Yaw ψ ψ ψ x y z Heave Pitch Roll Yaw Sway Surge MOTAN7A Whole-ship Motions
(6 files each in displacement, rate and acceleration)
HPF (expanded to EFM) Global Load Calculation
(determined using whole-ship motions output by MOTAN7A)
Figure 1 Schematic of MOTAN system
3.1 Measuring Whole-ship Motions
The MOTAN sensor provides information about the whole-ship motions in the form of six analog voltage signals, three of which pertain to the ship accelerations and three that relate to the rotational rate of the ship. The measured ship accelerations and angular rates are converted to whole-ship motions using specially developed computer software. The software was originally developed by CHC for measuring model ship motions in the laboratory, and has since been modified by CHC to allow ice-induced global loads to be determined on ships, at full scale.
The first part of the software package is referred to as MOTAN7A. It uses control input to provide time series of displacement, velocity and acceleration of the surge, sway, heave, roll, pitch and yaw motions, relative to a fixed coordinate system (Figure 1). Angular motions are computed using the standard Society of Naval Architect and Marine Engineers (SNAME) convention for definition of roll, pitch and yaw (SNAME, 1952). MOTAN7A can be used to compute whole-ship motions at any point on the ship, regardless of where the physical MOTAN sensor was installed. To do that, the positional coordinates of the instrument must be known and the ship must satisfy the assumption of a rigid body. MOTAN can be easily installed at any convenient location on the vessel, which makes it ideal for field operations.
3.2 HPF Program, Determining Total Vertical Force for Symmetrical Impacts
The general equations of motion used to describe ship motions in waves rely upon external wave exciting forces. When the wave exciting term is replaced by external impact force, the ship motions in open water can be translated to ship motions in ice. As a first approach, a MOTAN program called “heave-pitch force” or “HPF” was developed in 2000 to examine the feasibility of determining global loads from whole-ship motions. Using HPF, the global loads were able to be determined for only the relatively straightforward cases of symmetrical head-on collisions between a rigid body vessel and an ice feature.
Restricting the impact to symmetrical rams simplified an inherently complex situation. The simplified approach used ship motions in pitch and heave to determine the total vertical impact force. The standard equations of motion for coupled heave and pitch motions of a vessel operating in head seas are derived in Comstock (1967), as shown in Equations (1) and (2).
) ( ) ( 2 2 2 2 t F h t d d e t d d d z c t d z d b t d z d a m+ + + + θ + θ + θ = (1) ) ( ) ( 2 2 2 2 t M z H t d z d E t d z d D C t d d B t d d A Iy + θ + θ + θ + + + = (2) where
θ = pitch angle of ship
dθ/dt = pitch rate
d²θ/dt² = pitch acceleration
z = heave of ship
dz/dt = heave rate
d²z/dt² = heave acceleration
m = mass of the ship
Iy = mass moment of inertia of the ship about the midship y-axis
F (t) = total external force
M (t) = total external moment
1
Conrol input includes: MOTAN position (relative to the ship’s origin), low frequency cut-off limit for the Fast Fourier Transform (FFT) integration, and high frequency cut-off limit for the motion analysis.
and the coefficients include
A = hydrodynamic added mass
B = hydrodynamic pitch damping coefficient
C = hydrostatic pitch restoring moment coefficient
D = hydrodynamic inertia pitch- heave cross coupling coefficient
E = hydrodynamic damping pitch- heave cross coupling coefficient
H = hydrostatic pitch- heave cross coupling coefficient
In principle, the vertical ice impact force could be determined from either Equation (1) or Equation (2). The HPF program uses Equation (2) to calculate global loads because the MOTAN system can measure the pitch angle more accurately than the heave displacement (only one integration is required to obtain the pitch angle from the measured pitch rate, whereas a double integration is required to obtain the heave displacement from the vertical acceleration signal).
If both cross-coupling coefficients D and E in Equation (2) are neglected (based upon Gerritsma, 1960), the pitching moment equation becomes independent of the heave acceleration and heave rate. The simplified pitching moment equation is:
) ( ) ( 2 2 t M z H C t d d B t d d A Iy + θ + θ + θ + = (3)
The first term in Equation (3) is the moment due to the mass moment of inertia of the ship (Iy)
and the hydrodynamic added mass effects (A). The second term, B • (dθ/dt) is the moment due to hydrodynamic damping effects. The third term (C • θ) is the hydrostatic restoring moment in pitch. The last term is (H • z) is the hydrostatic heave cross-coupling moment due to the difference between the longitudinal centre of flotation and the longitudinal centre of buoyancy of the ship.
The HPF program uses Equation (3) to determine the pitching moment based upon the ship’s geometry and its hydrostatic parameters2. The pitching moment is used to calculate the total vertical impact force by dividing by R, the radial distance from the ship’s centre of gravity to the point of impact. If the point of impact can be assumed to be at the bow, as in the case of symmetrical head-on rams, the total vertical impact force can be determined from Equation (4):
R t M t FI ) ( ) ( = (4)
where
FI (t) = vertical ice (symmetrical) impact force at specified position along the hull
M (t) = pitching moment
R = external ice impact force radius
4.0
Validation of HPF Program: Model Tests
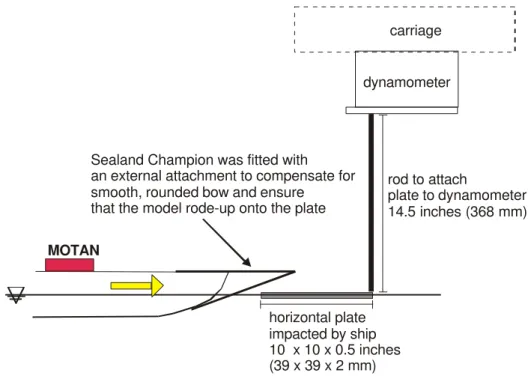
The MOTAN hardware and software were validated in model tests conducted at the Canadian Hydraulics Centre (CHC). The MOTAN was installed on the model-scale SEALAND
CHAMPION to record its accelerations and rotational rates along the X, Y, and Z body axes.
The model was pushed into an instrumented plate that was just beneath the water surface. The plate was connected to a dynamometer3, which was attached to an overhead carriage (Figure 2). For each of the test runs, the forces obtained from MOTAN were compared to output from the dynamometer (forces and moments along the X, Y and Z axes). Six symmetrical, head-on rams and seven oblique impacts were conducted during the test series.
dynamometer carriage
Sealand Champion was fitted with
an external attachment to compensate for smooth, rounded bow and ensure
that the model rode-up onto the plate
horizontal plate impacted by ship 10 x 10 x 0.5 inches (39 x 39 x 2 mm) rod to attach plate to dynamometer 14.5 inches (368 mm) MOTAN
Figure 2 Schematic of model test program conducted at Canadian Hydraulics Centre
3
The dynamometer used (model MC-6) had a force limit (in X and Y direction) of 2000 N and a moment limit (in X and Y direction) of 300 N/m.
Typically, during ship ice collisions at full-scale, an icebreaker impacts the floe, rides-up onto it and then backs off the floe. Because the model used for the laboratory tests had a flat bow, impacts with the plate resulted in minimal ride-up – during the head-on rams, the model behaved more like a cargo vessel than an icebreaker. Since the model ship did not interact with the “ice” in the same way an icebreaker would have, a false bow was attached to the model to exaggerate its pitch and heave motions. Symmetrical head-on rams were again conducted with the modified bow. Those impacts resulted in the model ship riding-up onto the instrumented plate, bouncing several times and then sliding off (in the x-direction, the direction of impact). Consequently, each symmetrical ram produced multiple “hits”.
A total of 32 distinct impacts were recorded during the test program. Each ship-plate collision was videotaped to obtain information about the ship speed and point of impact. Tapes showed (as later confirmed by MOTAN measurements) that the stem-on symmetrical rams caused ship motions that were predominantly in the x-direction (the direction of impact). When the point of impact was on the shoulder of the model during the oblique collisions, the model experienced considerable sway and yaw motions. Documenting where the impact occurred was especially important because that information was required for calculating global loads with the MOTAN software.
A scale factor of 31 was used to convert data from model-scale to full-scale. That scale factor was determined from the length ratio between the ship model and the full-scale TERRY FOX, the icebreaker that was believed to be most similar to the model. Average impact speeds during the model tests ranged from 18 to 34 cm/s, which represented 1.0 to 1.9 m/s (2.0 to 3.7 kt) at full-scale.
4.1 Results of CHC Model Tests: Symmetrical Impacts
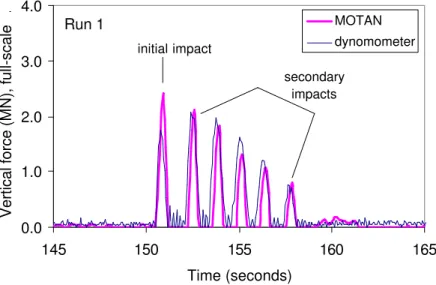
The scaled data were input into the program MOTAN7A to determine the full-scale whole-ship motions, from which the total vertical impact force was calculated. Figure 3 shows an example of the force-time series (scaled) for a symmetrical, head-on ram as measured by the MOTAN and the dynamometer. Six distinct impacts occurred as the ship rode-up onto the plate and then slid off. The hits classified as either one initial impact or multiple secondary impacts. Both the MOTAN and dynamometer showed that the initial impact resulted in the highest force, whereas the secondary impacts had lower forces. Appendix A shows plots from the six runs, in addition to the one shown in Figure 3. The data from each impact show similar trends.
0.0 1.0 2.0 3.0 4.0 145 150 155 160 165 Time (seconds)
Vertical force (MN), full-scale .
MOTAN dynomometer Run 1 initial impact secondary impacts
Figure 3 Comparison of vertical force from MOTAN and dynamometer, full-scale
Figure 4 shows the peak vertical forces for all of the impacts that occurred during the symmetrical test runs. Full-scale loads during the tests ranged from 0.8 to 5.4 MN. There was good correlation between the forces measured on the dynamometer and those obtained from the MOTAN, as shown by the R² value of 0.87.
The figure shows better agreement for the secondary impacts (circular data markers) than the initial impacts (square data markers). The MOTAN-derived forces were higher than the dynamometer for each of the six initial impacts. During the secondary impact, forces obtained from the MOTAN were either less than, greater than or equivalent to those from the dynamometer. Differences between the two measurement systems may have resulted from the modified bow (since it altered ship characteristics), the estimated control input to the software HPF (ship displacement, waterplane area, metacentric radius) or the flexible response that the impact caused in the instrumented plate.
Figure 5 shows the vertical impact forces from the MOTAN and dynamometer, in terms of ship speed. The data points in the figure correspond to the initial impact only for five of the symmetrical rams. Results showed that, under the controlled conditions of a laboratory environment, higher ship speeds generally resulted in larger initial impact forces.
y = 1.0438x R² = 0.87 0 1 2 3 4 5 6 0 1 2 3 4 5 6
MOTAN vertical force (MN), full-scale
Dyanamometer vertical force (MN),
full-scale
.
initial impacts
secondary impacts
Figure 4 Vertical forces measured by the MOTAN and dynamometer for head-on rams, (data to full-scale) 0 1 2 3 4 5 6 1 2 3 4
Ship speed (knots), full-scale
Vertical force (MN), full-scale
. MOTAN dynamometer Symmetrical rams (model Symmetrical rams (model
Figure 5 MOTAN-derived vertical bow force in relation to ship speed (data to full-scale)
4.2 Results of CHC Model Tests: Oblique Impacts
Model tests conducted at CHC involved seven oblique impacts, however the MOTAN software HPF could not be used to determine the loads for those impacts. That is because the HPF program is valid for symmetrical head-on impacts only, in which ship motions are predominantly in heave and pitch. In comparison, oblique collisions can cause appreciable sway, yaw and roll – motions that cannot be neglected when computing the resultant global load.
The inadequacy of using program HPF for oblique collisions was illustrated by the loads that it output, which were from 4 to 10 times lower than the dynamometer (not shown). Clearly, if impacts other than symmetrical, head-on rams are to be considered, the load calculation software would need to be revised.
4.3 Developing Software to Determine Global Forces for all Impact Types
Because experience gained during the full-scale MOTAN installations on the HEALY, LOUIS and TERRY FOX showed that ship-ice interactions are seldom restricted to heave and pitch dominated, symmetrical head-on rams, a new program was developed to take into account motions other than pitch and heave. Developing that software required three tasks: (1) identifying important parameters and motion components that should be included in the new software, (2) obtaining the hydrodynamic coefficients for the ships of interest and (3) developing the new load calculation software.
4.4 Meeting to Discuss Changes to Load Calculation Software
Before developing the second-generation of MOTAN load calculation software, a meeting was held to evaluate the strengths and weaknesses of the existing MOTAN package. The meeting involved the CHC and Prof. C. Daley of Memorial University of Newfoundland. Prof. Daley was selected for consultation because of his extensive research on the mechanics of ship-ice collisions.
At the meeting, the fundamentals of the MOTAN system were discussed, along with results from the CHC model tests and sample data from previous installations of the MOTAN on HEALY,
LOUIS and TERRY FOX. The main points of the meeting were as follows;
• The MOTAN system has considerable potential for being used as a technique for determining global loads on ships due to transient ship-ice collisions.
• The accurate assessment of vessel hydrostatic, hydrodynamic and kinematic properties is crucial to developing software to determine global loads from whole ship motions.
• The new analysis software would require developing six linear differential equations of motions.
• Those equations would require the ship’s mass matrix, its added mass and damping coefficients and the restoring force coefficients to be determined for the ships of interest.
• Six differential equations should be used to calculate a force vector at the origin of the ship’s coordinate system. That vector will need to be translated to the point of impact.
• Determining the component forces at the point of impact will require calculating the distance from the ship’s origin (the point of reference for the whole ship motions) to the point of impact.
• The concept of using the MOTAN system to calculate global loads for symmetrical and oblique collisions appears promising.
4.5 Development of Hydrodynamic Coefficients
In order to use the suite of whole-ship motions to determine an ice-induced impact force, the ship’s hydrodynamic coefficients was needed for each of the ships on which the MOTAN had been installed. Fleet Technology Ltd. was contracted to develop the hydrodynamic coefficients for each of the three icebreakers – HEALY, LOUIS and TERRY FOX.
Developing hydrodynamic coefficients required the following information;
• geometry, hull form and select particulars listed in Table 1
• operating speeds of interest: specified as 1, 4, 8 and 12 kt
• encounter wave frequency: selected to cover maximum speed of 12 kt in head seas
Table 1 Ship Parameters required for Hydrodynamic Coefficients
Principal Particulars HEALY LOUIS TERRY FOX
Length between perpendiculars (m) 120.85 110.32 81.97
Beam (m) 24.23 23.31 17.25
Design Draft (m) 8.53 8.53 8.20
Displacement (tonnes) 15964.5 12874.8 6733.2
Vertical Center of Gravity (m, above baseline) 9.83 8.56 6.73
Longitudinal Center of Gravity (m, from FP) 62.68 60.08 43.22
4.6 Equations of Motion used in Developing New MOTAN Software
The hydrodynamic coefficients for the three ships were determined for the six, linear, coupled differential equations of motion, the vectorial form of which is shown in Equation (5):
{ }
F =[
M +A]
{
η&&}
+[ ]
B{ }
η& +[ ]
C{ }
η (5) whereF = exciting force, vector for three forces and three moments M = generalized mass matrix of the ship
A = hydrodynamic added mass matrix
B = hydrodynamic damping coefficient matrix
C = hydrostatic restoring force moment coefficient matrix
η = vectorial translatory and angular displacements
The six linear equations of motions were solved by software called ShipMoPC, using a strip theory approach. ShipMoPC was developed by Defence Research Establishment Agency (DREA). Rather than outputting the hydrodynamic coefficients directly, ShipMoPC stores them in an intermediate file. Fleet Technology, Ltd. developed an algorithm to access that file and directly output the hydrodynamic coefficients for HEALY, LOUIS and TERRY FOX. Appendix B contains the hydrodynamic coefficients for those three ships, at a representative operating speed of 8 kt4. Fleet Technology (2001) presents the full suite of hydrodynamic coefficients for
HEALY, LOUIS and TERRY FOX at ship speeds of 1, 4, 8 and 12 kt.
4.7 EFM: Second-Generation Load Calculation Software
The second-generation load calculation software was called “EFM”, for “exciting forces and moments”. The EFM program calculated the resultant ice impact force from the complete set of whole-ship motions, rather than using only pitch and heave motions (as in the HPF software). The EFM program uses a right-handed co-ordinate system, in order to be compatible with the DREA program ShipMoPC. The sign convention of the EFM program is as follows:
• X-axis: positive towards the bow
• Y-axis: positive to port
• Z-axis: positive upwards
• Positive Surge = forward motion
• Positive Sway = motion to port
• Positive Heave = upward motion
• Positive Roll = starboard side down
• Positive Pitch = bow down
• Positive Yaw = bow turning to port
4
The added-mass (A) and damping (B) matrices shown in Equation (5) both depend on ship speed and the encounter frequency. The users enters the ship speed at impact for the different events, which the software uses to interpolate and find A and B at the specified ship speed.
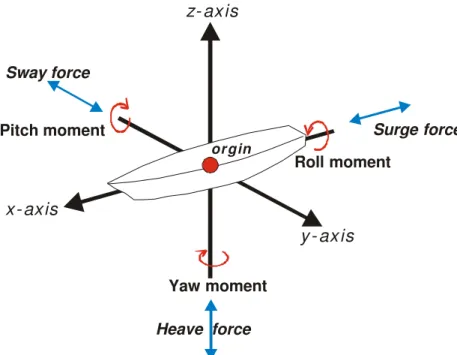
Ice impact forces are determined from the EFM program using the 18 time-series traces output from MOTAN7A (Figure 1) and information about the hydrodynamic coefficients of the ship and specific control input5. The program computes exciting forces and moments on the ship using Equation (5) from the surge, sway, heave, roll, pitch and yaw motions. The EFM program outputs three exciting forces components and three exciting moments, as shown in Figure 6. All output from the MOTAN7A and EFM program are referenced to the origin of the ship’s co-ordinate system. That origin is taken as the intersection of a vertical line through the ship’s centre of gravity and the plane of the undisturbed free surface of the surrounding water.
x- axis or gin y - ax is z- axis Heave force Pitch moment Roll moment Yaw moment Sway force Surge force
Figure 6 Output from EFM1 program
(forces and moments calculated at ship’s origin)
4.8 Determining Salient Components of the Global Ice Impact Force
Output from the EFM program includes surge, sway and heave force components and pitch, roll and yaw moments. That information can be used to determine the force components at the point of impact by making some assumptions about where the impact occurred. The point of impact can sometimes be determined (in a general sense) from observations recorded on the bridge. When that information is not available, the reasonable assumption is made that the impact occurred on the shoulder, near the bow6.
5
Control input for the EFM program includes: ship displacement, vertical centre of gravity above the waterplane and the roll, pitch and yaw radii of gyration.
6
The resultant impact force at the point of impact can be determined from the following equation:
( )
²( )
²( )
² z y x F F F F = + + (6) whereF = global ice impact force
Fx = longitudinal ice impact force component
Fy = lateral ice impact force component
Fz = vertical ice impact force component
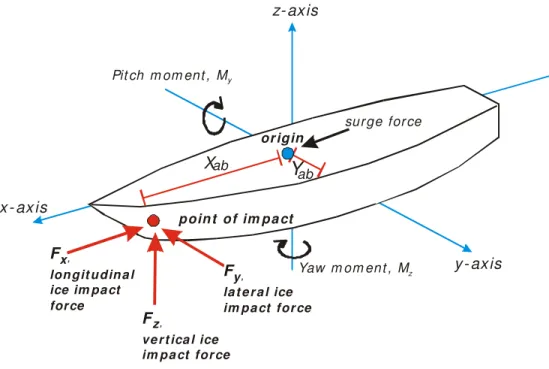
Note that the force components at the ship’s origin are referred to as surge, sway and heave forces (Figure 6), whereas force components at the point of impact are referred to as longtidinal, lateral and vertical ice impact forces (Figure 7). The surge force component output directly from EFM can be used to determine the longitudinal force component (Fx) because the surge force is
the same everywhere along the longitudinal axis of the ship That is not the case for the sway and heave motions (hence forces), which are much larger in the bow than at the ship’s origin. The following discussion examines the procedure used for calculating the three force components at the point of impact.
x - ax is
Fz,
ve r t ica l ice im pa ct for ce
Fx,
lon git u din a l ice im pa ct force Fy, la t e r a l ice im pa ct for ce y- axis poin t of im pa ct or igin z- axis Pit ch m om ent , My Yaw m om en t , Mz sur ge for ce Xab Y ab
4.8.1 Longitudinal Ice Impact Force Component, F x
The longitudinal force component (Fx) at the point of impact is the same as the surge force
component that is directly output from EFM.
4.8.2 Lateral Ice Impact Force Component, F y
The lateral ice impact force component (Fy) can be determined from the yaw moment (Mz) by
dividing by the radial distance to the point of load application which, in the case of yaw, is in the longitudinal direction (Xab), as illustrated in Figure 7. Since the point of load application
during ship-ice interaction is assumed to be at the waterline (on the shoulder), Fy produces no
roll moment.
4.8.3 Vertical Ice Impact Force Component, F z
The vertical force at the point of impact (Fz) can be determined from the pitch moment (My).
That requires dividing My by the same longitudinal distance (Xab) that was used to compute the
lateral force, Fy.
The vertical force (Fz) could also be determined from the roll moment. That would involve
dividing by some fraction of the breadth of the ship (Yab). Since Xab is greater than Yab, the
former distance is not as sensitive to errors that may arise in estimating the radial distance to the point of impact. Either method of determining the impact location involves some percentage of error, which is why the pitch moment is preferred (over the roll moment) for calculating Fz.
4.9 Global Ice Impact Force: Resultant
Having decided to use the surge force, yaw moment and pitch moment to calculate the global ice impact force, Equation (6) can be rewritten as:
( )
² ² ² + + = ab y ab z x X M X M F F (7) whereF = global ice impact force
Mz = yaw moment, about z-axis
My = pitch moment, about y-axis
5.0
Validation of EFM Program
The EFM program was validated by first, examining data from the CHC model tests and second, examining full-scale data from the TERRY FOX during the Bergy Bit Trials. Gagnon et al. (2002-b) provide an overview of the Trials. The third stage of validation, which has yet to be completed, will involve conducting tests at the Institute for Marine Dynamics (IMD), using a model of the TERRY FOX. Each of the so-called ‘validation’ programs is discussed below.
5.1 CHC Model Tests
The EFM program requires accurate information about the ship’s hydrodynamic coefficients, whereas the previous load-calculation software (HPF) did not require that information. The hydrodynamic coefficients were developed for the HEALY, LOUIS and TERRY FOX, all of which are icebreakers. None of those hydrodynamic coefficients were appropriate for the ship used for the CHC model tests. That is because the model ship was more like a cargo vessel than an icebreaker and because its bow had been modified (by attaching a temporary frame). As a result, data obtained from the CHC model tests could not be used to validate the EFM program. In December 2003, model tests involving the TERRY FOX will be conducted at the Institute for Marine Dynamics (IMD), as part of an initiative for the Program on Energy Research and Development (PERD). Preparations for the TERRY FOX model test program are currently underway. It is anticipated that the upcoming model tests will be similar to (but more elaborate than) the model tests conducted at the CHC.
5.2 Full-scale Validation using TERRY FOX Data
Full-scale data from the TERRY FOX during the 2001 Bergy Bit Trials were used to validate the global loads determined from the EFM program. The Bergy Bit Trials involved conducting controlled collisions with small pieces of glacial ice at a range of speeds (Gagnon et al, 2002-b). Figure 8 shows a typical collision that occurred during the trials.
The Trials resulted in more than 178 events, 17 of which were examined for the MOTAN validation study. Since data acquired during the Bergy Bit Trials are proprietary until July 2004, the MOTAN-derived global loads were published in a separate, controlled report (Johnston et al., 2003-a). Results from the full-scale validation study are presented here, in general terms.
Three different instrumentation systems were used to measure loads on the TERRY FOX during the Bergy Bit Trials. Whole-ship motions were measured by the MOTAN for more than 178 events, from which global loads could then be determined. The other two measurement systems involved local areas of the hull. The first system consisted of an external impact panel and the second system used the more conventional technique of strain-gauging the hull (Gagnon et al., 2002-b). Because the impacts occurred over relatively small areas during the Bergy Bit Trials, loads on the localized areas were able to be compared to the MOTAN-derived global loads. Since the two measurement areas on the hull were adjacent (but separate), impacts involved either one instrument or the other. Although MOTAN-derived impact forces could be compared to either the strain-gauged area or the impact panel, forces on the strain-gauged area could not be compared to forces on the impact panel.
5.2.1 MOTAN
Two MOTAN units were installed on the TERRY FOX during the Bergy Bit Trials. One unit was installed near the bow, in the forward bubbler, room and the second unit was installed near the ship’s centre of gravity. There was good agreement between the whole-ship motions measured by the two instruments (Johnston et al. in Gagnon et al., 2002-a). Data from the MOTAN near the ship’s centre of gravity were used for the full-scale validation work because it was closer to the origin used by the EFM program, than the MOTAN in the bow (Figure 7). 5.2.2 IMD External Impact Panel
The external impact panel used in the Bergy Bit Trials was designed and developed at the Institute for Marine Dynamics (IMD) of the National Research Council of Canada. The panel was located near the bow, on the port side, just below the waterline (Gagnon et al., 2002-b). The panel had a sensing area of approximately 4.0 m² (1.6 m wide by 2.5 m high). The IMD impact panel relies upon a flexible sheet of stainless steel (1 mm thick) that, when loaded, compresses between parallel strips of tape onto an acrylic slab. The ship-ice contact area was documented from video cameras mounted along the perimeter of the impact panel. In essence, the applied load was proportional to the total contact area, as determined from the degree of contact made between the steel plate and the acrylic slab. The relationship between contact area and applied load was based upon calibration work performed at the IMD. Gagnon et al. (2002-a) provide a thorough description of the IMD impact panel and its results. The impact panel provided a record of the contact area and measured the applied load for a number of events during the trials.
5.2.3 Strain-Gauged Area
The third load measurement system on the TERRY FOX used strain gauges over a 6.0 m² area (nominal coverage) of the port side of the hull, at the waterline. The strain-gauged area was adjacent to (but aft of) the IMD impact panel, between frames 134 and 139. The area had 120 strain gauges at 60 locations on the frames and stringers, which subdivided the overall sensing area into 34 smaller areas. Loads over the instrumented area were obtained from a finite element model. That model was verified using direct shear strain comparisons for the physical calibration and model predictions. That was achieved, in part, by applying known hydraulic loads at a number points on the instrumented area while the TERRY FOX was docked in Halifax. Gagnon et al. (2002-a) provide further details of the strain-gauged area.
5.2.4 Global Loads at Full-scale: Qualitative Assessment
For this validation study, global impact loads from the MOTAN were compared to loads on either the strain-gauged area or the IMD impact panel for eight of the 17 examined impact events. The remaining nine impacts either occurred outside the instrumented area or involved multiple hits in close succession (for which data from the other instrumentation systems are not available). Since loads measured during the Bergy Bit Trials are proprietary until July 2004 (Gagnon et al., 2002a), quantitative results from the study cannot be presented here. Instead, results from the Bergy Bit Trials are discussed in a qualitative sense. Johnston et al. (2003-a) provide a complete discussion of the comparison.
The study showed good agreement between the global loads measured by the three different instrumentation systems. Figure 9 shows a (numberless) cross-plot of the MOTAN-derived global loads (x-scale) and the loads measured by either of the two panels (y-scale) for eight different events. The four events involving the strain-gauged area are shown by square data markers and the four events involving the IMD impact panel were given circular data markers. Each of the data markers is below the line of 1:1 correspondence (dotted line) – which shows that the MOTAN provides an upper bound for global loads. The study showed that MOTAN-derived global loads were, on average, 32% higher than those measured on the strain-gauged area and 66% higher than the loads measured on the impact panel.
Force from MOTAN, resultant
Force from panel
MOTAN vs. strain-gauged MOTAN vs. IMD panel
6.0
Full-scale MOTAN Installations on HEALY and LOUIS
Having discussed the working principles of the MOTAN system and its validation, this report now examines global loads that were measured on the USCGC HEALY and the CCGS LOUIS S.
ST-LAURENT.
6.1 MOTAN Installation on USCGC HEALY
The first full-scale installation of the MOTAN system was on the USCGC HEALY, during its maiden voyage in ice-covered waters from Halifax, Nova Scotia to Nuuk, Greenland, 2 April to 15 May 2000. Data from the HEALY were used to provide a proof-of-concept of the system – would the MOTAN provide reliable data about the whole-ship motions at full-scale and, if so, could those motions be used to determine global loads on the ship? Answering those questions required measuring the whole-ship motions of the HEALY in a range of open water and ice conditions. Johnston et al. (2000) provide details of the vessel response for 17 events, from open water to thin first-year ice to multi-year ice.
On the HEALY, the MOTAN was securely fastened to a bulkhead at a convenient location, in the refrigeration machinery room, about 26 m forward of the ship’s centre of gravity (Figure 10). The MOTAN did not have its own data acquisition system; rather the data acquisition system for measuring hull strains (St. John et al., 2001) was also used for the MOTAN.
26 m 120.9 m Bridge
aft lab from bridge (29 m ABL): MOTAN sampled when requested
by calling
Aft lab (16 m ABL): control centre for data acquisition system
MOTAN
centre of gravity
5 m
Figure 10 Location of MOTAN on HEALY
During the trials, a sampling frequency of either 20 or 50 Hz was used to sample MOTAN. Although incoming data were not amplified, a 5 Hz low-pass hardware filter was applied to the signal. In spite of the 5 Hz filter, high frequency noise was found to be contaminating the MOTAN signal. It was hoped that moving the MOTAN from its first location (on a bulkhead) to a stiffer location (at the junction of two I-beams) would remedy the problem7. It did not. It was concluded that the noise resulted from the data acquisition system, and that the MOTAN data would need to be “cleaned-up” during processing, in whatever way possible.
In general, a manual trigger was used to sample MOTAN whenever conditions warranted. However several events used an automatic trigger that relied upon the monitored (but not recorded) hull strain. Using the automated technique, when the strain exceeded a preset threshold, MOTAN sampling would begin. When the data were analyzed back in Ottawa, results showed that the automatically triggered records had not been long enough for the software to capture whole-ship motions during the impact. That is because the periodic analysis used by the program requires that the first and last 5% of the record be truncated. If the record was short, and the impact occurred at the beginning (or end) of the file, the impact-related ship response was missed completely when the MOTAN was triggered automatically (Johnston et al., 2000). Unfortunately, one of the most significant impacts on the HEALY was triggered automatically, hence the record was truncated (multi-year ice Event M09, Johnston et al., 2000). Since MOTAN was sampled at a frequency of either 20 or 50 Hz for about 10 minutes at a time, it was decided not to sample the strain gauges at the same time as the MOTAN because that would result in far too much strain data to process (J. St. John, personal communication). As a result, strain data are not available during the MOTAN events and MOTAN data are not available for the hull strain events. That is why MOTAN measurements on the HEALY cannot be validated, even though two different load measurement systems were used during the Trials.
6.1.1 Selecting Global Loads on HEALY: Representative Event
Detecting changes in the measured accelerations and rotational rates in the MOTAN data required an unusually large amount of processing because signal noise was a problem. Roll and pitch motions were obtained by using two of the three MOTAN accelerometers as inclinometers. That approach reduced the noise, but it also reduced the true signal associated with the less-significant ice impact events. As a result, this report includes information about only the large, well-defined impacts on the HEALY, since they caused the largest (and most abrupt) changes in the MOTAN signal.
Data from the HEALY are limited because of the noise problem, but also because the ship operated with extreme caution during its maiden voyage. Much of the time, the HEALY operated in relatively weak, level first-year ice of medium thickness. As a result, only three of the 17 events produced “substantial” global loads during the April/May leg of the HEALY trials. Those three events were designated as H11 (16 April), H12 (17 April) and H14 (23 April).
7
Attempts to trouble shoot the noise that was contaminating the signal resulted in moving the MOTAN from its first location to a second location, a few metres away. As a result, Figure 10 gives only approximate distances for the MOTAN, with respect to the ship’s centre of gravity.
The first step in selecting individual hits from the 10-minute MOTAN files was to examine observations made from the bridge, which would usually indicate when an impact occurred and provide information about the ice feature that caused it. When observations from the bridge were not available, hits were identified using the change in rotational rates registered by the MOTAN. The rotational rates (degrees/s) were examined first because they were least affected by the special processing technique that was used to eliminate noise from the signal. The processed pitch and roll signals (degrees) from three independent systems were also examined to verify the event “signature” observed from files of the rotational rates (Johnston et al., 2001-a). Finally, the recorded ship speed (two samples per second) was used to verify that the ship had actually slowed; a decrease in ship speed and appreciable pitch (or roll) indicated that the
HEALY had collided with an ice feature. That required having synchronized data files from
MOTAN and the GPS system to log ship speed. The method used for detecting peaks from the
HEALY data is illustrated below, using Event H14.
Event H14
Event H14 was recorded on 23 April, when the ship was traveling through an ice regime that consisted of 9/10ths total concentration of medium first-year ice and lesser concentrations of thin first-year ice (Johnston et al., 2001-a). Bridge observations showed that a series of impacts occurred during Event H14 as the HEALY pushed through thick first-year ice floes (1 to 1.5 m thick), about 50 to 500 m in diameter. The global loads, ship speed, rotational rate and angular displacement (in pitch and roll) for those events are shown Figure 11 and Figure 12.
Figure 11 shows the MOTAN-derived ship loads and motions for the first two impacts on
HEALY. The first impact (H14_1) occurred after an elapsed time of 320 s8. That impact caused the ship speed to decrease to 4.6 kt from 9 kt. That reduction in speed was corroborated by pitch measurements from three independent systems (Johnston et al., 2001-a). MOTAN measurements showed that Impact H14_1 caused a global load of 4.3 MN and corresponding pitch and roll angles of 0.52° and 2.9° respectively (Figure 11-c).
Observations from the bridge indicated that the second impact (H14_2) occurred when the
HEALY impacted a ridged floe at 5.8 kt, at an elapsed time of about 363 s. MOTAN data show
that the impact that occurred at 367 s caused a global load of 4.9 MN (Figure 11-a). Figure 11-c shows that Impact H14_2 caused a slightly higher load than H14_1 and occurred at a higher ship speed. Although the pitch for H14_2 was less than the first impact, it occurred over a shorter time interval. As a result, Impact H14_2 had larger accelerations in pitch and heave (not shown) than Impact H14_1, which may explain its higher global load (4.9 MN versus 4.6 MN).
8
A preliminary investigation of the first event (H14_1) was presented in Johnston et al. (2001-a). At that time it was believed that a ridge impact had caused Impact H14_1. Further examination showed that the ridge impact caused
0 2 4 6 8 10 12 200 250 300 350 400 450 Time (s) Global load (MN) 0 5 10 15 Ship speed (kt)
ship speed impact H14_1 impact H14_2
(a)
-0.5 0.0 0.5 1.0 200 250 300 350 400 450 Time (s)Pitch rate (deg/s)
-3 -2 -1 0 1
Roll rate (deg/s)
roll pitch
(b)
-0.5 0.0 0.5 1.0 200 250 300 350 400 450 Time (s) Pitch (deg) -16 -12 -8 -4 0 4 Roll (deg) roll pitch(c)
Figure 11 Ship loads and motions of HEALY during part of Event H14
Figure 12 shows the other six impacts of Event H14. At 423 s, the HEALY impacted a 150 m diameter floe of medium-thick first-year ice that was extensively ridged. Observations from the bridge showed that impacts also occurred at 504, 561, 658, 684 and 691 s. Most of those impacts involved ridged ice and occurred at ship speeds from 7.0 to 11 kt. MOTAN also showed evidence of impacts at nearly the same time as observed from the bridge (see, for example the pitch segment shown in Figure 12-c). Global loads associated with those impacts ranged from 2.3 to 7.0 MN. More impacts could have been selected from Event H14, however there were no observations from the bridge to support them.
0 2 4 6 8 10 12 450 500 550 600 650 700 Time (s) Global load (MN) 0 5 10 15 Ship speed (kt)
ship speed impacts
H14_6, 7 & 8 impact H14_3 impact H14_4 impact H14_5 (a) -0.5 0.0 0.5 1.0 450 500 550 600 650 700 Time (s)
Pitch rate (deg/s)
-3 -2 -1 0 1
Roll rate (deg/s)
roll rate pitch rate (b) -0.5 0.0 0.5 1.0 450 500 550 600 650 700 Time (s) Pitch (deg) -16 -12 -8 -4 0 4 Roll (deg) roll pitch (c)
Events H11 and H12
Although plots of the global loads for the other two significant events on the HEALY shall not be discussed in detail, they are included in the section “Comparison of Global Loads on HEALY and LOUIS”. Bridge observations showed that Event H11 resulted from the HEALY backing and ramming in moderately pressured, heavily deformed, thick first-year ice. The five impacts identified from Event H11 occurred at ship speeds from 0.5 to 2.1 kt and had global loads from 1.7 to 3.9 MN.
Event H12 took place in relatively light ice conditions. The Ice Regime consisted of mostly nilas, grey-white ice and grease ice, although there were minor concentrations of medium and thick first-year ice (Johnston et al., 2000). Three impacts were identified during Event H12, all of which were confirmed by bridge observations. Impact H12_1 occurred when the HEALY impacted a “small ridge” at 6.7 kt and caused a global load of 1.70 MN. Impact H12_2 occurred when the HEALY hit an ice feature at 8.6 kt and resulted in a global load of 3.9 MN. The third impact, H12_3, occurred when the ship impacted an ice feature at 7.3 kt and caused a global load of 4.2 MN. Impacts H12_2 and H12_3 caused ship sway, as noted from the bridge.
6.2 MOTAN Installation on CCGS LOUIS S. ST-LAURENT
The second full-scale installation of MOTAN was on the CCGS LOUIS S. ST-LAURENT during its October 2000 field trials in the central Canadian Arctic (75°N, 93°W). The objective of installing MOTAN on the LOUIS was to provide information about the global ship accelerations caused by operations in ice (Johnston et al., 2001-b; Johnston et al., 2002). For the purposes of this report, however, whole-ship motions recorded during the 2000 LOUIS trials were used to calculate global loads. A total of 42 events were recorded during the trials, most of which involved second-year and multi-year ice.
On the LOUIS, MOTAN was installed near the ship’s centre of gravity, at the junction of two I-beams in the engine casing area (Figure 13). Since signal contamination had been a problem on the HEALY, it was decided that MOTAN would have its own data acquisition system on the
LOUIS. A remotely activated device was used to trigger all 42 events from the bridge.
Typically the LOUIS events were logged for 15 minutes, which meant that each data file captured one or more cycles of backing and ramming. The MOTAN signal was passed through a signal-processing unit, where it was amplified by a gain of 5 and sent through a 5 Hz low-pass filter. All of the LOUIS events were sampled at a frequency of 50 Hz.
3.64m
4.84 m 110.3 m
Bridge (25 m ABL): MOTAN sampled from bridge using remotely-activated
manual trigger
MOTAN
centre of gravity
Figure 13 Location of MOTAN on LOUIS
6.2.1 Selecting Global Loads on the LOUIS: Representative Event
Impacts on the LOUIS were selected by first comparing bridge observations to the time series of the global load. Because the events were generally 15 minutes long, observations were not necessarily as detailed as the those made during the HEALY trials. In addition, the large number of events (42) recorded during the LOUIS trials precluded correlating each and every bridge observation to the MOTAN data. Rather than doing a case-by-case comparison of raw data and bridge observations, individual LOUIS impacts were identified from the measured ship accelerations (rather than from the rotational rates, as done on the HEALY). The surge, sway and heave accelerations were particularly relevant because they had the least amount of processing (Johnston et al., 2002); ship accelerations do not undergo integration or differentiation during data processing.
The surge acceleration was valuable for identifying events, especially for symmetrical impacts, because it usually showed an appreciable rate of change when an ice feature was hit. Sway acceleration was found to be useful for identifying individual oblique impacts. Impacts identified from the surge and sway accelerations were supplemented by information on the pitch and roll accelerations. As a final check, the change in ship speed9 was used to verify the impacts that had been identified from the MOTAN data.
The section below discusses global loads from Event L42. The reader is referred to Johnston et al. (2000-b) for a discussion of the time-series traces of global loads measured during two other
Event L42
Figure 14-a shows the first ramming cycle that occurred during Event L42, when the LOUIS rammed a ridged, multi-year ice floe at about 8.4 kt (at an elapsed time of 47 s). Four impacts were identified from the first ram, each showing changes in one or more of the ship accelerations. Figure 14-b shows the pitch and surge accelerations and Figure 14-c shows the sway and roll accelerations for Impacts L42_1 to L42_4. Global loads for those impacts ranged from 9.5 to 12.6 MN. 0 5 10 15 20 30 35 40 45 50 55 60 65 70 Time (s) Global load (MN) 0 2 4 6 8 10 Ship speed (kt) ship speed impacts L42_1, 2, 3 & 4 (a) -1.0 0.0 1.0 2.0 30 35 40 45 50 55 60 65 70 Time (s)
Pitch accel (deg/s²)
-3 -2 -1 0 1 Surge accel (m/s²) surge acc. pitch acc. (b) -0.5 0.0 0.5 1.0 1.5 30 35 40 45 50 55 60 65 70 Time (s) Sway accel (m/s²) -3 -2 -1 0 1 2
Roll accel (deg/s²)
roll acc.
sway acc.
(c)
The second ramming cycle of Event L42 occurred when the LOUIS aimed for the notch in the floe that had been created by the previous ram. Four impacts were identified during the 30-second ram, the first of which occurred at an elapsed time of about 377 s (Figure 15). Bridge observations noted that the initial impact (L42_5) resulted when the ship rammed the floe at 6.5 kt. As the ship rode-up onto the floe, its speed decreased and it rolled to starboard by about 4° (not shown in the figure). At that point, the ice under the port side of the ship collapsed and the ship rolled to the port side by about 12°. The sudden ice collapse caused significant ship accelerations – persons on the bridge lost their footing and were literally thrown to the port side. The ram shown in Figure 15 resulted in the most significant ship motions during the LOUIS trials – motions that generated global loads from 5.7 to 12.5 MN.
0 5 10 15 20 375 380 385 390 395 400 405 Time (s) Global load (MN) 0 2 4 6 8 10 Ship speed (kt) ship speed impact L42_7 (a) impact L42_5 impact L42_6 impact L42_8 -2 -1 0 1 2 3 375 380 385 390 395 400 405 Time (s)
Pitch acceleration (deg/s²)
-3 -2 -1 0 1 Surge acceleration (m/s²) surge acc. pitch acc. (b) -1 0 1 2 375 380 385 390 395 400 405 Time (s) Sway acceleration (m/s²) -15 -10 -5 0 5
Roll acceleration (deg/s²)
roll acc.
sway acc.
7.0
Comparison of Global Loads on HEALY and LOUIS
Figure 16 shows global loads from the HEALY and the LOUIS, relative to the ship speed (which refers to the speed at the time of the identified impact). Table 1 showed that the displacement of the two ships was similar (15,965 tonnes for HEALY, and 12,875 tonnes for LOUIS). Most of the data in Figure 16 pertain to the LOUIS, since those trials resulted in a total of 202 impacts. The LOUIS impacts resulted from thick first year, second-year and multi-year ice and were conducted at speeds from 0.6 to 16.1 kt. A total of 16 impacts were identified from the three
HEALY events (H11, H12 and H14). The HEALY impacts resulted in global loads from 1.7 to
7.0 MN, for ship speeds from 0.5 to 11.3 kt.
The maximum global load measured on the LOUIS was 17.3 MN and on the HEALY was 7.6 MN. Although many of the global loads on the LOUIS were almost double those measured on the HEALY, the 16 impacts that occurred on the HEALY were comparable to the less significant LOUIS impacts.
0 5 10 15 20 0 5 10 15 20 Ship speed (kt) Global load (MN) . HEALY (16 impacts) LOUIS (202 impacts)
Figure 16 Global ice impact forces measured on HEALY and LOUIS
Neither the HEALY or LOUIS data showed an apparent correlation between the resultant global load and ship speed. Appendix C contains a list of the impacts that generated the ten highest resultant forces, as well as the ten highest longitudinal, lateral and vertical forces at the point of impact. As with the global load, the individual force components do not show any apparent correlation with ship speed. The absence of correlation between the (resultant or component) global load and the ship speed is most likely related to differences such as ice type, contact area and damage zone created by the ship-ice collision.
7.1 Global Load Based Upon Ice Type
The 16 impacts on the HEALY resulted from either level or ridged thick first-year ice, whereas most of the impacts on LOUIS were from medium to thick second-year or multi-year ice. Both data sets were acquired in warm sea ice – the HEALY trials took place in first-year ice in southern Davis Strait in early spring and the LOUIS trials were conducted in Arctic first-year ice, second-year and multi-year ice in the fall (in October).
7.1.1 Characterizing Ice Types in Early and Late Season
Identifying the different ice types was not a problem during the HEALY trials, when different ice thicknesses could be directly related to ice type (age of the ice). That was not the case during the LOUIS trials, however. The tell-tale signs of surface topography, such as (refrozen) melt ponds and hummocking, were not always apparent during the LOUIS trials, which made it very difficult to distinguish between thick first-year ice (FYI), second-year ice (SYI) and multi-year ice (MYI). Every attempt was made to accurately identify the ice type, however there was some natural overlap of thickness for the different ice types. For the purpose of this study, ice types were characterized by a slightly different nomenclature than used by the World Meteorological Association (WMO, 1970). The following range of thickness were used to characterize ice during the HEALY and LOUIS trials:
• early season, thick first-year ice – 1.2 to 1.8 m (used for the HEALY trials)
• late season, thick first-year ice – from 1.0 to 1.2 m
• late-season, medium second-year ice – 1.2 to 1.5 m
• late-season, thick second-year ice – 1.5 to 2 .0 m
• multi-year ice – over 2.0 m thick
7.1.2 Thick First-year Ice
Figure 17-a shows the global loads from thick first-year ice, relative to ship speed. Data from both the HEALY and LOUIS are included in the figure. Individual data points are classified as level year ice or ridged year ice. Only two of the LOUIS impacts involved thick first-year ice, both of which are shown in the figure. Those two data points show that global loads from thick first-year ice were similar for the LOUIS and HEALY. The HEALY impacts with ridged first-year ice resulted in higher global loads than impacts with level first-year ice. In general, the HEALY and LOUIS trials show that warm, thick first-year ice resulted in global loads from 1.7 to 7.0 MN, for impact speeds up to 11 kt.
0 5 10 15 20 0 5 10 15 20 Ship speed (kt) Global load (MN)
Thick FYI - LOUIS Ridged FYI - HEALY Thick FYI - HEALY
(a) first-year ice
0 5 10 15 20 0 5 10 15 20 Ship speed (kt) Global load (MN)
Medium SYI - LOUIS Thick SYI - LOUIS MYI - LOUIS
(b) second-year and multi-year ice
Figure 17 Global loads on the HEALY and LOUIS, according to ice type
7.1.3 Second-year and Multi-year Ice in Late Season
Global loads for second-year and multi-year ice are plotted with respect to ship speed in Figure 17-b. Data points were classified according to medium second-year ice, thick second-year ice or multi-year ice. Global loads for the different ice types ranged from 1.9 to 17.3 MN, for ship speeds from 0.6 to 16.1 kt. Although the data in the figure show considerable scatter, global loads from thick second-year ice (square data points) appear to increase with increasing ship speed. The other ice types do not show that trend. In fact, it could be argued that global loads associated with medium second-year ice (triangular data points) decrease with increasing ship speed.
Despite the scatter in Figure 17-b, data show that the three highest global loads were associated with multi-year ice. Those three impacts occurred during the same event (Event L19), over an interval of about 5 s (Figure 18). The three hits resulted from impacting a rubbled multi-year ice floe at a ship speed of 11 kt. Interestingly, the three highest loads did not occur from the initial, high-speed impact – rather they were produced after the LOUIS had penetrated the floe. That is likely because there was increased ice-ship contact after the initial impact. Global loads associated with those impacts were 17.3, 16.7, and 15.7 MN, for ship speeds from 3.2 to 5.0 kt.
0 5 10 15 20 25 30 495 500 505 510 515 520 Time (s)
Global load (MN) and ship speed (kt)
-0.8 -0.6 -0.4 -0.2 0 0.2 Surge acceleration (m/s²) ship speed global load surge acc.
Figure 18 Three highest global loads measured during the LOUIS trials
7.1.4 Global Loads Corresponding Only to Initial Impacts
Global loads on the LOUIS were plotted against the initial impact speed and categorized by ice type (Figure 19). Data from the HEALY were not included in the plot because, unlike the LOUIS impacts, they did not result from deliberate backing and ramming cycles, nor was the ice approached from what was essentially open water (ice that classified as nilas and grey ice). That approach showed that, in general, global loads associated with thick second-year and multi-year ice increased with increasing ship speed. The clearest trend was shown for the multi-year ice impacts; impacts involving thick second-year ice show a less clear trend. There was no apparent correlation between global load and ship speed for impacts involving thick first-year and