Publisher’s version / Version de l'éditeur:
Vous avez des questions? Nous pouvons vous aider. Pour communiquer directement avec un auteur, consultez la première page de la revue dans laquelle son article a été publié afin de trouver ses coordonnées. Si vous n’arrivez pas à les repérer, communiquez avec nous à [email protected].
Questions? Contact the NRC Publications Archive team at
[email protected]. If you wish to email the authors directly, please see the first page of the publication for their contact information.
https://publications-cnrc.canada.ca/fra/droits
L’accès à ce site Web et l’utilisation de son contenu sont assujettis aux conditions présentées dans le site LISEZ CES CONDITIONS ATTENTIVEMENT AVANT D’UTILISER CE SITE WEB.
Proceeding of the 18th International Congress on Acoustics: 01 April 2004, Kyoto,
pp. 3583-3586, 2004-04-01
READ THESE TERMS AND CONDITIONS CAREFULLY BEFORE USING THIS WEBSITE.
https://nrc-publications.canada.ca/eng/copyright
NRC Publications Archive Record / Notice des Archives des publications du CNRC : https://nrc-publications.canada.ca/eng/view/object/?id=a58c8576-7ac8-4534-95ec-9f13261a36ca https://publications-cnrc.canada.ca/fra/voir/objet/?id=a58c8576-7ac8-4534-95ec-9f13261a36ca
NRC Publications Archive
Archives des publications du CNRC
This publication could be one of several versions: author’s original, accepted manuscript or the publisher’s version. / La version de cette publication peut être l’une des suivantes : la version prépublication de l’auteur, la version acceptée du manuscrit ou la version de l’éditeur.
Access and use of this website and the material on it are subject to the Terms and Conditions set forth at
Statistical analysis of speech privacy based on the SII
Statistical analysis of speech privacy based on the SII
Simon, F.; Bradley, J.S.
NRCC-48329
A version of this document is published in / Une version de ce document se trouve dans :
Proceedings of the 18
thInternational Congress on Acoustics,
Kyoto, April 2004, Paper Fr3B1.2, V-3583-3586
Statistical analysis of speech privacy based on the SII
Francisco Simón
Instituto de Acústica, Consejo Superior de Investigaciones Científicas
C. Serrano, 144, 28006 Madrid, Spain
John S. Bradley
Institute for Research in Construction, National Research Council
Montreal Rd. Ottawa, Canada K1A 0R6
Abstract
Office designers have been concerned with speech privacy for decades. One way to define speech privacy is the capability of a listener to understand, or to be disturbed by, a conversation that is taking place somewhere else in the same, or in the adjacent, office. In the nineties, the study of speech privacy has mainly been carried out in terms of intelligibility, and the speech privacy index, PI, was defined as the complement of the intelligibility (PI = 1 − I). This work will focus on the speech privacy of enclosed offices. In that case the main parameters involved are the source speech, the transmission loss of the separating wall, and the background noise in the receiving room. A statistical model will be developed, based on the Speech Intelligibility Index, to analyse PI as a function of the above mentioned parameters in order to estimate the relative importance of each one of them to the privacy problem.
1. Introduction
In offices, the acoustical environment is closely related to the productivity of workers. The main acoustical problem in these environments is that the noise is made up of different components. Among them, the most important sources of noise may be office activity, imission from outside and conversation from other workers. Undesired speech has specific properties based on the information it carries that make this noise source much more disturbing than others. At present, and due to the modern architectural building techniques, this problem can be very important even for enclosed offices where conversational speech from adjoining rooms can propagate into the office with a level high enough to be heard. Another important issue is that of confidentiality; people producing speech may not want this to be understood outside the meeting room.I Information and consulting services might need a certain degree of speech privacy to suggest confidentiality to their clients.
Speech privacy was first studied in the sixties by Cavanaugh et al.[1]. In their work they stated that a speech privacy rating should depend on the background
noise in the receiving room, the wall sound insulation, and the acoustical characteristics of both emitting and receiving rooms. Their work shows a strong relationship between the intelligibility, I, and the feeling of speech privacy. The most critical of the subjects began to feel a lack of privacy when the articulation index, AI, was 0.05, which was thus described as confidential privacy.
Though from Cavanaugh's work it seems clear that an AI of 0.05 corresponds to confidential privacy, later studies point out that a direct relationship between changes in intelligibility and intelligibility indices for speech privacy is not quite straightforward [2]. In this way the Privacy Index, PI, (defined as PI = 1 - I) has been the objective of modern works, where the goal is to develop integrated design solutions to speech privacy, mainly by the use of signal to noise ratios [3].
2. Monte Carlo model
In enclosed offices with acoustic privacy problems, the intruding noise will be produced by speech in the emitting room and after being modified by room acoustics is transmitted through the wall to the receiving room where it will reach the listener after being, again, modified by the room acoustics. As a first approach both room acoustics effects will be neglected. Then, the quantities involved are the speech spectrum, the wall sound insulation, and the background noise in the receiving room.
The model will have to calculate the intelligibility in the receiving room once the speech has passed through the wall. As an estimate of intelligibility, the speech intelligibility index, SII, will be used [4]. All of these quantities are frequency dependent so that the dimension of the problem becomes large, a way to overcome that difficulty is the use of global ratings for the quantities involved; as there may exist several different members from the same element (speaker, wall, noise) with the same global rating the use of a set of samples becomes necessary.
Firstly, a sample of all possible walls will be created, and then the relationship arising from the model among the different quantities involved will be
shown. That set of walls will be used to study the influence of the global sound reduction index of the wall on the SII in the receiving room. The calculation of the sound pressure level in receiving room will be carried out by the mere subtraction of the wall sound insulation from the speech level. Lately, aural procedures have been developed to estimate the sound in the receiving room that are especially appropriate for subjective surveys [5].
The Monte Carlo model used in this work was firstly created by Moreno et al. [6] and is built up by 6 types of walls characterized by the number of straight segments that represent the main trends and by the position of the joint frequencies between segments (see
Table 1).
Table 1: Wall classification types.
Wall type Profile Description T1 T2 T3 T4 T5 / _/ /− /−/ _/−
One segment over all frequencies Two segments, first flat
Two segments, second flat Three segments, central flat Three segments, central positive slope
3. Model analysis
The Monte Carlo model was generated with a basic sample with 100 elements per type, shifting them up and down as needed to get the required transmission loss,
TL. The sound reduction index, A-weighted, was used
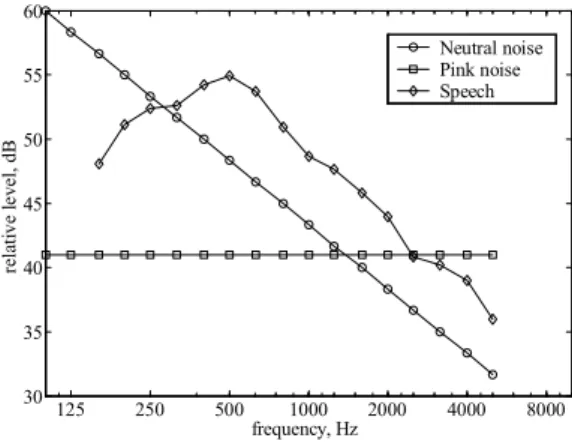
due to its flexibility to take into account different spectral ranges. As speech spectrum, the one included in [4] for normal effort will be used, and three kinds of noise will be investigated, pink noise, neutral noise, and speech spectrum −see Figure 1−. The global sound pressure level was A-weighted, as well.
3.1. Dependence on TL, and noise sound pressure level
When PI is plotted as a function of TL, curves as the ones in Figure 2, the typical S shaped curves are obtained. In general, the results can be approximated by the equation: TL c SPL c c
e
PI
3 2 11
1
− − −+
=
(1)where SPL is the noise level, TL the sound reduction index A-weighted. Constant c3 was calculated to be
about 0.1 for all of the cases studied. On the other hand,
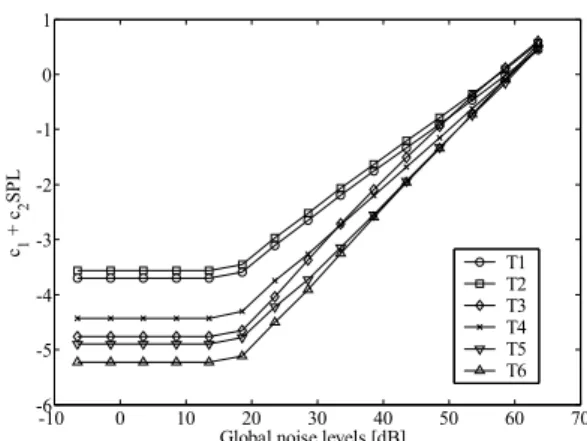
c1 and c2 depend on the kind of noise studied. Figure 3
shows an example for pink noise. Both constants are so different for every case −noise and wall type pairs− that it is not possible to generalize their behaviour
3.2. Signal to Noise ratio dependence
When signal to noise ratios, SN are calculated, graphs like the one in Figure 4 are found, and can be fitted by one expression similar to equation 1:
SN b b
e
PI
2 11
1
− −+
=
(2)where b1 and b2 are a function of the wall and noise
types. The scatter plot shows such a large spread that the variance of the fitting will be very high and the prediction may not be very accurate. On the other hand, the fitting of the upper part of the curve seems not to work quite as well. Presumably, experimental data would be smoother than these plots. In any case equation 2 is conservative.
In Figure 5 the results for b1 and b2 are shown. b2, is
related to the steepness of the curve, and is approximately constant for every wall type and every noise type. Differences are found for b1. Wall types T1 125 250 500 1000 2000 4000 8000 30 35 40 45 50 55 60 frequency, Hz re la ti v e l e v el , dB Neutral noise Pink noise Speech
Figure 1: Noise spectra used.
0 10 20 30 40 50 60 70 0 0.2 0.4 0.6 0.8 1
Transmission loss [dBA]
P ri v ac y I n de x (P I) -25 dB -10 dB 5 dB 20 dB
Figure 2: PI as a function of TL for a set of T2
walls and 4 different pink noise levels.
and T2 are the same for a given noise, so they can be treated as a single case. The rest are close enough that the b1 values can be substituted by a mean value −see
Figure 5−. As a rule of thumb, greater b1 values give
higher PI curves. This means that the best privacy will be achieved for neutral noise and type T1 or T2 walls.
3.3. Variation of Speech Intelligibility Index Resolution Threshold (SIIRT) with TL
The SIIRT is defined as the presentation level necessary for a listener to recognize the speech material correctly a specified percent of the time. Defined this way, the
SIIRT agrees well with the concept of the degree of
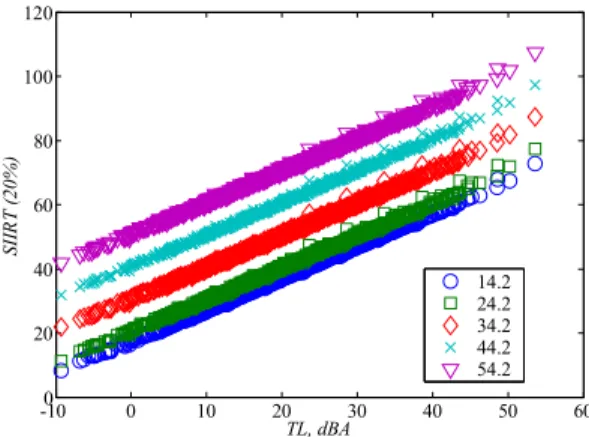
privacy, and it can be useful to asses this for a maximum speech level for which a minimum degree of privacy will never be exceeded. Figure 6 shows a plot of SIIRT (20%) as a function of TL, it can be observed that for a given noise level the plot graphs straight lines. There is a certain noise level below which the lines are superimposed; higher noise levels give higher lines. This same kind of graph is found for every wall type and every kind of background noise, thus a linear fitting seems to be appropriate:
SIIRTPd = p1TL + p2 (3)
where the subscript Pd states the degree of privacy assessed, defined as the maximum SII, expressed as a percentage, that can be obtained for the level indicated by SIIRT. In doing so, plots similar to the one in Figure
7 are obtained for a 20% privacy degree. In all of them
the value of the slope (p1) is one. Curves for p2 have a
first constant interval, with a limit around 25 dBA, and they depend on the kind of noise. The reason is that, according to the SII model used, for lower noise levels, ear internal noise becomes dominant, and the influence of the external noise is negligible.
For higher noise levels p2 shows a linear behavior with
noise levels. Furthermore, for a given noise level p2
values do not differ more than 3 dB among wall types. Thus p2 can be expressed as a linear function of noise
levels:
p2 = c1 SPL + c2 (4)
where c1 and c2 are coefficients to be fitted. Again, c2 is
always one and the square of the correlation coefficient for the fitting defined through equation 3 is always greater than 0.97. Thus equation 3 becomes:
SIIRTPd = TL + SPL + c2 (5)
where c2 depends on the noise type and on the
privacy degree chosen. From Figure 8, where p2 for a
Pd of 20 % is shown, it is apparent that p2 as a function
of the A-weighted SPL of noise and does not depend on the kind of noise. Thus, only one expression can be used where the independent term c2 is a function of Pd.
-10 0 10 20 30 40 50 60 70 -6 -5 -4 -3 -2 -1 0 1
Global noise levels [dB]
c1 + c 2 SP L T1 T2 T3 T4 T5 T6
Figure 3: Behaviour of fitting constants from
equation 1 for all the wall types and pink noise.
-300 -20 -10 0 10 20 30 40 50 0.1 0.2 0.3 0.4 0.5 0.6 0.7 0.8 0.9 1 S/N dBA PI R2 = 0.84258
Figure 4: Speech privacy as a function of
signal-to-noise ratio. Wall type: T1, background noise: speech spectrum. T1 T2 T3 T4 T5 T6 -0.2 0 0.2 0.4 0.6 0.8 1 1.2 1.4 Pink noise Ep noise Neutral noise b1 b2 b1, b2
Figure 5: Fitting constants from equation 2.
4. Conclusions
A Monte Carlo model has been developed for speech privacy of enclosed offices based on the SII descriptor of the intelligibility. From that model it has been shown that a system based on global ratings of background levels inside the room and TL of the separating wall are not adequate.
Nevertheless, models based on signal to noise ratios could be appropriate; the model shows a great spread in the data that might be overcome by the use of some kind of function −the weighting functions used in the
AI calculation could be an example to follow−.
To finish, the use of resolution thresholds has been investigated. This approximation to the privacy problem seems to be the most promising and the most accurate. Furthermore, as noted in Cavanaugh’s work [1], a given privacy level is found for a fixed AI (i.e. there exists a direct relationship between AI and SII), and in the SIIRT study this value is kept constant. Therefore, it is expected that their results would agree well with experimental data. Though, how these quantities can to be measured at such low values, is an open issue currently.
5. References
[1] Cavanaugh, W. J., Farrell, W. R., Hirtle, P. W. and Watters, B. G. “Speech privacy in buildings,” J. Acoust. Soc. Am. 34(4), 475−492, 1962
[2] Thaden, R. "Investigation on the relation between single number ratings and speech intelligibility," Proceedings to inter-noise, The Hague, 2001 [3] Roy, K. P. "Speech privacy in office spaces," 140th
ASA Meeting, 2000
[4] ANSI S3.5-1997. “Methods for Calculation of the Speech Intelligibility Index", 1997
[5] Vörlander, M. and Thaden, R. "Auralisation of airborne sound insulation in buildings," Acustica − acta acustica, 80, 70−76, 2000
[6] Moreno, A., Colina, C. de la, and Simón, F. "Responses to some open questions on single number ratings of sound insulation using Monte Carlo Models," Acustica - acta acustica, 85, 859−869, 1999 -100 0 10 20 30 40 50 60 20 40 60 80 100 120 TL, dBA SII R T ( 2 0 % ) 14.2 24.2 34.2 44.2 54.2
Figure 6: SIIRT as a function of TL for different A-weighted SPL and a speech spectrum as
background noise. 10 20 30 40 50 60 0 10 20 30 40 50 60 p2 p1 SPL, dBA p1 , p 2 (2 0 % ) T1 T2 T3 T4 T5 T6
Figure 7: Fitting constants for equation 3
-10 0 10 20 30 40 50 60 70 15 20 25 30 35 40 45 50 55 60 Ep noise Pink noise Neutral noise SPL, A weighted p 2
Figure 8: Equation 4 plot for different noise
types.