HAL Id: hal-02904375
https://hal.insa-toulouse.fr/hal-02904375
Submitted on 27 Aug 2020
HAL is a multi-disciplinary open access
archive for the deposit and dissemination of
sci-entific research documents, whether they are
pub-lished or not. The documents may come from
teaching and research institutions in France or
abroad, or from public or private research centers.
L’archive ouverte pluridisciplinaire HAL, est
destinée au dépôt et à la diffusion de documents
scientifiques de niveau recherche, publiés ou non,
émanant des établissements d’enseignement et de
recherche français ou étrangers, des laboratoires
publics ou privés.
emissions and producing pathways’ contribution under
nitrifying conditions
Guillaume Humbert, Mathieu Sebilo, Justine Fiat, Longqi Lang, Ahlem Filali,
Véronique Vaury, Mathieu Sperandio, Anniet M. Laverman
To cite this version:
Guillaume Humbert, Mathieu Sebilo, Justine Fiat, Longqi Lang, Ahlem Filali, et al.. Isotopic
evi-dence for alteration of nitrous oxide emissions and producing pathways’ contribution under nitrifying
conditions. Biogeosciences, European Geosciences Union, 2020, 17 (4), pp.979-993.
�10.5194/bg-17-979-2020�. �hal-02904375�
https://doi.org/10.5194/bg-17-979-2020
© Author(s) 2020. This work is distributed under the Creative Commons Attribution 4.0 License.
Isotopic evidence for alteration of nitrous oxide emissions and
producing pathways’ contribution under nitrifying conditions
Guillaume Humbert1,2, Mathieu Sébilo1,3, Justine Fiat4, Longqi Lang5, Ahlem Filali4, Véronique Vaury1, Mathieu Spérandio5, and Anniet M. Laverman21Sorbonne Université, CNRS, INRAE, IRD, UPD, UPEC, Institute of Ecology and Environmental Sciences – Paris,
iEES, 75005 Paris, France
2Centre National de la Recherche Scientifique (CNRS), ECOBIO – UMR 6553, Université de Rennes, 35042 Rennes, France 3Université de Pau et des Pays de l’Adour, E2S UPPA, IPREM (Institut des Sciences Analytiques et de Physico-Chimie pour
l’Environnement et les Matériaux), Pau, France
4Université Paris-Saclay, INRAE, PROSE, 92761, Antony, France 5LISBP, Université de Toulouse, CNRS, INRAE, INSA, Toulouse, France
Correspondence: Guillaume Humbert (g.humbert86@gmail.com) Received: 21 June 2019 – Discussion started: 19 July 2019
Revised: 31 October 2019 – Accepted: 20 January 2020 – Published: 24 February 2020
Abstract. Nitrous oxide (N2O) emissions from a nitrifying
biofilm reactor were investigated with N2O isotopocules. The
nitrogen isotopomer site preference of N2O (15N-SP)
indi-cated the contribution of producing and consuming path-ways in response to changes in oxygenation level (from 0 % to 21 % O2 in the gas mix), temperature (from 13.5
to 22.3◦C) and ammonium concentrations (from 6.2 to
62.1 mg N L−1). Nitrite reduction, either nitrifier denitrifi-cation or heterotrophic denitrifidenitrifi-cation, was the main N2
O-producing pathway under the tested conditions. Difference between oxidative and reductive rates of nitrite consump-tion was discussed in relaconsump-tion to NO−2 concentrations and N2O emissions. Hence, nitrite oxidation rates seem to
de-crease as compared to ammonium oxidation rates at temper-atures above 20◦C and under oxygen-depleted atmosphere, increasing N2O production by the nitrite reduction pathway.
Below 20◦C, a difference in temperature sensitivity between hydroxylamine and ammonium oxidation rates is most likely responsible for an increase in N2O production via the
hy-droxylamine oxidation pathway (nitrification). A negative correlation between the reaction kinetics and the apparent isotope fractionation was additionally shown from the varia-tions of δ15N and δ18O values of N2O produced from
ammo-nium. The approach and results obtained here, for a nitrify-ing biofilm reactor under variable environmental conditions,
should allow for application and extrapolation of N2O
emis-sions from other systems such as lakes, soils and sediments.
1 Introduction
Nitrogen (N) cycling relies on numerous biological processes exploited and altered by anthropic activities (Bothe et al., 2007). One of the major issues related to N cycle alteration is the production of nitrous oxide (N2O), a potent
ozone-depleting and greenhouse gas whose emissions exponentially increased during the industrial era (Crutzen et al., 1979; IPCC, 2014; Ravishankara et al., 2009). Wastewater resource recovery facilities (WRRFs) contribute to about 3 % of an-nual global anthropogenic N2O sources (ca. 6.7 ± 1.3 Tg
N-N2O in 2011; IPCC, 2014), with 0 % to 25 % of the influent
nitrogen loads emitted as N2O (Law et al., 2012b). The
chal-lenges to mitigating these emissions are linked with the un-derstanding of N2O-producing processes and their controls.
Two microbial processes are responsible for the produc-tion of N2O (nitrification and heterotrophic denitrification),
with only one of these capable of consuming it (denitrifica-tion; Fig. 1a; Kampschreur et al., 2009). Nitrification is the oxidation of ammonium to nitrite (NO−2) via the intermediate hydroxylamine (NH2OH) conducted by ammonia oxidizers,
nitrite oxidizers. During nitrification, N2O can be produced
as a reaction side-product from hydroxylamine oxidation by biotic, abiotic or hybrid processes (Caranto et al., 2016; Heil et al., 2015; Terada et al., 2017). Heterotrophic denitrifica-tion and nitrifier denitrificadenitrifica-tion produce N2O from nitrite
re-duction conducted by denitrifiers and ammonium oxidizers, respectively.
Temperature, and electron donor and acceptor concentra-tions have been identified to control N2O emissions from
WRRFs (Bollon et al., 2016; Kampschreur et al., 2009; Tu-mendelger et al., 2014, 2016; Wunderlin et al., 2012). These variables may induce N2O accumulation due to inhibition or
disturbance of enzyme activity (Betlach and Tiedje, 1981; Kim et al., 2008; Otte et al., 1996). In addition to this, the different N2O-producing processes, nitrification, nitrifier
denitrification or heterotrophic denitrification, are rarely ob-served independently from each other in heterogeneous envi-ronments like wastewater, natural waters, soils or sediments. However, the understanding of the influence that environ-mental conditions have on the balance between these pro-cesses and N2O-producing pathways remain to a large extent
unexplored.
In order to decipher N2O-producing and N2O-consuming
pathways, the analysis of N2O isotopocules, molecules that
only differ in either the number or position of isotopic sub-stitutions, has been applied (Koba et al., 2009; Sutka et al., 2006; Fig. 1b–d). The isotope composition of substrates and fractionation mechanisms influence both nitrogen and oxygen isotope ratios of N2O (reported as δ15N and δ18O,
respectively; Fig. 1b). Basically, the oxygen atom in the N2O molecule produced by hydroxylamine oxidation
orig-inates from atmospheric dissolved oxygen with a δ18O value of 23.5 ‰ (Andersson and Hooper, 1983; Hollocher et al., 1981; Kroopnick and Craig, 1972), while the oxygen atom in N2O produced by nitrite reduction originates from nitrite
that has undergone oxygen exchange with water (Kool et al., 2007; Snider et al., 2012). Nonetheless, δ18O-N2O resulting
from the nitrite reduction conducted by the nitrifiers ranges from 13 ‰ to 35 ‰ (Snider et al., 2012). In contrast, the N2O
produced by the heterotrophic denitrifiers through the nitrite reduction pathway has a δ18O value of over 35 ‰ (Snider et al., 2013). However, the oxygen exchange between the N2O
precursors and water can decrease it to values below 35 ‰ (Snider et al., 2015). Therefore, δ18O alone does not enable differentiation between the N2O-producing pathways.
In combination with δ18O, δ15N-N2O allows us to
iden-tify the N2O-producing pathways (Fig. 1b). However, the
isotope fractionations (or isotope effects) largely influence δ15N-N2O due to wide variations between and within the
re-actions involved in the nitrogen cycle (Denk et al., 2017). The isotopic fractionation results from the difference in equilib-rium constant or reaction rate observed between the heavier and lighter isotopes in both abiotic and biotic processes. The net isotope effects (1) approximated from the difference be-tween δ15N of product and substrate characterize the
produc-tion of compounds resulting from sequential or branched re-actions and have been recently reviewed (Denk et al., 2017; Toyoda et al., 2017). So far, only two estimates of the net isotope effect of N2O production by ammonium oxidation
via hydroxylamine of −46.5 ‰ and −32.9 ‰ have been pro-posed (Sutka et al., 2006; Yamazaki et al., 2014). These val-ues are imbricated between −52.8 ‰ and −6 ‰, the range of net isotope effects related to the N2O production through
nitrite reduction performed by nitrifiers or heterotrophic den-itrifiers (Lewicka-Szczebak et al., 2014; Sutka et al., 2008).
Similarly to isotope ratios, the nitrogen isotopomer site preference (15N-SP), the difference between the relative abundances of N2O molecules enriched in 15N at the
cen-tral (Nα) position and terminal (Nβ) position differ accord-ing to N2O-producing pathway (Fig. 1c and d). During
het-erotrophic or nitrifier denitrification the15N-SP of N2O
pro-duced from nitrate or nitrite ranges from −10.7 ‰ to 0.1 ‰, while ranging from 13.1 ‰ to 36.6 ‰ when N2O results from
hydroxylamine oxidation (Frame and Casciotti, 2010; Jung et al., 2014; Sutka et al., 2006; Yamazaki et al., 2014). Fi-nally, N2O reduction to N2by heterotrophic denitrifiers
in-creases the values of δ15N, δ18O and15N-SP of residual N2O
with specific pairwise ratios (Jinuntuya-Nortman et al., 2008; Webster and Hopkins, 1996; Yamagishi et al., 2007).
Nitrogen and oxygen isotope ratios of N2O have lower
po-tential for N2O source identification as compared to15N-SP.
However, we believe that the use of both isotope approaches should strengthen the conclusions from15N-SP and reveal additional isotope effects (Fig. 1).
The aim of the current study is to improve our under-standing regarding the effects of key environmental vari-ables (oxygenation, temperature, NH+4 concentrations) on N2O production and emission rates. More specifically
us-ing nitrogen and oxygen isotope ratios as well as 15N-SP of N2O should allow for deciphering the different producing
and consuming pathways under these different conditions. In order to achieve this, the nitrifying biomass of a submerged fixed-bed biofilm reactor was investigated. Among wastew-ater treatment systems, the biofilm systems are adapted to large urban areas owing to their compactness, flexibility and reliability. An increase in their development is expected in response to the additional 2.5 billion humans predicted in urban areas by 2050 (United Nations, 2019). However, biofilm systems have received much less attention than sus-pended biomass systems, and the relations between the N2
O-producing and N2O-consuming pathways and controls
re-main largely unknown (Sabba et al., 2018; Todt and Dörsch, 2016). Although applied here to the nitrifying biomass of a WRRF, the research questions addressed consider a diver-sity of environments including natural waters, soils and sedi-ments: (i) does the nitrifying biomass emit N2O and what are
the producing pathways at play? (ii) Do oxygenation, tem-perature and NH+4 concentration alter N2O emissions, and
what are the involved processes? We hypothesize that the isotope signature of N2O allows identification of the N2O
Figure 1. N2O-producing and N2O-consuming pathways at play during nitrification and heterotrophic denitrification. Substrate isotope composition, isotope effects and15N-SP values from the literature were used to propose the ranges of15N (Lewicka-Szczebak et al., 2014; Sutka et al., 2006, 2008; Yamazaki et al., 2014),18O (Andersson and Hooper, 1983; Hollocher et al., 1981; Kool et al., 2007; Kroopnick and Craig, 1972; Snider et al., 2012) and15N-SP (Frame and Casciotti, 2010; Jung et al., 2014; Sutka et al., 2006; Yamazaki et al., 2014), as well the slopes relating them with each other during N2O reduction to N2(Jinuntuya-Nortman et al., 2008; Webster and Hopkins, 1996;
Yamagishi et al., 2007). The assumptions made and the calculations performed are detailed in the text.
origins and the assessment of the pathway contribution to N2O emissions. The results of this study should improve the
mechanistic understanding as well as improved prediction of N2O emissions from WRRFs, currently suffering from high
uncertainty.
2 Material and methods
2.1 Experimental setup for nitrifying experiments Experiments were carried out with colonized polystyrene beads (diameter 4 mm) sampled from the nitrification bio-logically active filters (BAFs) of a domestic WRRF (Seine Centre, France). In this WRRF, wastewater (240 000 m3d−1) passes through a pre-treatment stage, followed by physico-chemical decantation and tertiary biological treatment. The latter is composed of three biofiltration processes: (i) car-bon elimination (24 Biofor®), (ii) nitrification (29 Biostyr®) and (iii) denitrification (12 Biofor®). Nitrifying Biostyrs® are submerged fixed-bed biofilm reactors with a unitary sec-tion of 111 m2and a filter bed of 3 m high. This unit is oper-ated to receive a nominal load of 0.7 kg NH+4-N m−3d−1.
A lab-scale reactor with a working volume of 9.9 L (col-onized Biostyrene® beads and interstitial volume) and a headspace of 1.4 L was operated in continuous down-flow counter-current mode for 7 weeks (i.e., solution was down-flowing, while air was up-flowing; Fig. S1 in the Supple-ment). Mass flow meters (F-201CV, Bronkhorst, France) sus-tained the inflow gas rate at 0.5 L min−1. A peristaltic pump (R3425H12B, Sirem, France) pumped feeding solution from
a feeding tank into the reactor at 0.2 L min−1, in order to maintain a hydraulic retention time (HRT) of 27.8 ± 0.6 min. A water jacket monitored by a cryogenic regulator (WK 500, Lauda, Germany) controlled the reactor temperature. The feeding solution consisted of ammonium chloride (NH4Cl)
as substrate, monobasic potassium phosphate (KH2PO4) as
phosphorus source for bacterial growth, and sodium hydro-gen carbonate (NaHCO3) as pH buffer and inorganic
car-bon source in 100 or 150 L of tap water (average 0.2 ± 0.4, 2.4 ± 1.1, and 2.5 ± 1.3 mg N L−1of NO−2, NO−3 and sum of both NO−x molecules, respectively).
The influence of environmental conditions on the ammo-nium oxidation rates and the N2O emissions from various
combinations of oxygenation levels, temperatures and am-monium concentrations were tested in 24 experiments (Ta-ble 1). Note that two of them were used twice: as oxygenation tests and as concentration tests. The oxygenation tests were carried out by mixing compressed air and pure nitrogen gas to reach 0 % to 21 % O2in the gas mixture (Fig. S2a). The
tests were performed at five substrate concentrations and at a temperature between 19.2 and 20.6◦C. The temperature tests were carried out by cooling the feeding solution directly in the feeding tank (22.3 to 13.5◦C), with an inflow ammonium concentration close to the nominal load that received the ni-trifying biomass, i.e., 20.3–21.1 mg NH+4-N L−1. The ammo-nium concentration tests were run at an increase (6.2, 28.6 and 62.1 mg NH+4-N L1) and a decrease (56.1, 42.9, 42.7 and 20.2 mg NH+4-N L−1) of NH+4 concentrations in the feeding solution, at temperatures ranging from 19.0 to 19.8◦C. The
mix-Table 1. Detailed average conditions (± standard deviation) of oxy-genation, temperature and concentration tests.
Inflow Inflow O2in Temperature
[NH+4] gas rate gas mix
mg N L−1 L min−1 % ◦C Oxygenation tests 25.1 ± 0.5 0.4 0 19.2 ± 0.1 23.8 ± 0.6 0.53 4.2 19.9 ± 0.1 25.1 ± 0.5 0.53 4.2 19.2 ± 0.1 37.3 ± 0.6 0.5 4.2 20.5 ± 0.1 23.8 ± 0.6 0.51 10.5 20.2 ± 0.1 25.1 ± 0.5 0.51 10.5 19.2 ± 0.1 37.3 ± 0.6 0.5 10.5 20.6 ± 0.1 23.8 ± 0.6 0.5 16.8 20.1 ± 0.1 25.1 ± 0.5 0.5 16.8 19.3 ± 0.1 37.3 ± 0.6 0.5 16.8 20.6 ± 0.1 20.2 ± 0.5 0.5 21 19.5 ± 0.1 25.1 ± 0.5 0.57 21 19.6 ± 0.5 28.6 ± 0.5 0.5 21 19.6 ± 0.1 Temperature tests 20.3 ± 0.3 0.5 21 13.5 ± 0.2 21.1 0.5 21 15.5 ± 0.1 21.1 0.5 21 16.2 ± 0.1 20.3 ± 0.3 0.5 21 18.2 ± 0.1 21.1 0.5 21 20.3 ± 0.1 20.3 ± 0.3 0.5 21 22.3 ± 0.1 NH+4 concentration tests 6.2 ± 0.1 0.5 21 19.6 ± 0.0 20.2 ± 0.5 0.5 21 19.5 ± 0.1 28.6 ± 0.5 0.5 21 19.6 ± 0.1 42.7 ± 1.0 0.5 21 19.3 ± 0.0 42.9 0.5 21 19.0 ± 0.0 56.1 ± 0.3 0.5 21 19.0 ± 0.1 62.1 ± 0.4 0.5 21 19.8 ± 0.0
Note that two experiments tested both oxygenation and ammonium concentration.
ture) was imposed for both tests (Fig. S2b and c). This gas mixture using compressed air with 21 % O2was considered
hereafter as optimal as compared to the oxygen-depleted at-mosphere used during the oxygenation tests. Noticeably, the atmospheric oxygenation level is the condition that repre-sents the most optimal conditions of oxygenation applied in nitrification BAFs of domestic WRRF.
2.2 Reactor monitoring, sampling and concentrations analysis
Dissolved oxygen, temperature (Visiferm DO Arc 120, Hamilton, Switzerland) and pH (H8481 HD, SI Analytics, France) were continuously measured at the top of the reactor and data were recorded at 10 s intervals. The N2O
concen-tration was continuously analyzed by an infrared
photome-ter (Rosemount™ X-STREAM X2GP, Emerson, Germany) in outflow reactor gas after drying through a condenser and a hydrophobic gas filter (0.2 µm). Minute averages are used for monitored data hereafter. Gas samples were taken for N2O isotopic signature determination by an outlet gas pipe
derivation into a sealed glass vial of 20 mL. The vial was first flushed with the sampling gas for > 45 s prior to 1–5 min sampling. Gas samples were then stored in the dark at room temperature until analysis. Note that gas sampling was lack-ing for 5 of the 13 oxygenation tests.
The feeding solutions were characterized of one to five replicate samples collected in the feeding tank. For each tested condition, the outflow was characterized within 5 d of 1 to 14 replicate samples immediately filtered through a 0.2 µm syringe filter and stored at 4◦C. Outflow sampling started after at least one hydraulic retention time (28±1 min). Ammonium was analyzed using the Nessler colorimetric method, according to AFNOR NF T90-015 (DR 2800, Hach, Germany). Nitrite and nitrate were measured by ionic chro-matography (IC25, Dionex, USA).
2.3 Stable isotope measurements
Atmospheric N2 and Vienna Standard Mean Ocean Water
(VSMOW) are the references used for the nitrogen and oxy-gen isotopes ratios, respectively, expressed in conventional δ notation, in per mil (‰). Nitrogen and oxygen isotope ratios of nitrate and nitrite were determined separately following a modified protocol of McIlvin and Altabet (McIlvin and Alta-bet, 2005; Semaoune et al., 2012). Nitrogen isotope ratios of ammonium were determined following the protocol of Zhang et al. (2007). These methods consist in the conversion of the substrate (ammonium or nitrite or nitrate) into dissolved N2O. δ15N and δ18O for ammonium, nitrite and nitrate were
hence determined from a calibration curve created with a combination of nitrate or ammonium standards that under-went the same chemical conversion as the samples (USGS-32, δ15N-NO−3 =180 ‰, δ18O-NO−3 =25.7 ‰; USGS-34, δ15N-NO−3 = −1.8 ‰, δ18O-NO−3 = −27.9 ‰ and USGS-35 δ15N-NO−3 =2.7 ‰, δ18O-NO−3 =57.5 ‰; IAEA-N1, δ15 N-NH+4 =0.4 ‰, IAEA-305A, δ15N-NH+4 =39.8 ‰, USGS-25, δ15N-NH+4 = −30.4 ‰). The quality of calibration was controlled with additional international standards (IAEA-NO-3, δ15N-NO−3 =4.7 ‰, δ18O-NO−3 =25.6 ‰; IAEA-N2, δ15N-NH+4 =20.3 ‰). Basically, an analytical sequence was comprised of triplicate standards for calibration, and quality controls and duplicate samples. The average of the analytical replicates was then used for calibration, for qual-ity control and as a result.
Since no international standards were available for N2O
isotopes, these were determined the same day as nitrate or ammonium standard analysis ensuring correct functioning of the method and analysis. In addition to this, the inter-nal N2O standards were previously calibrated by exchange
at the Tokyo Institute of Technology. All isotope measure-ments were determined using an isotope ratio mass spectrom-eter (IRMS, DeltaVplus; Thermo Scientific) in continuous flow with a purge and trap system coupled with a Finnigan GasBench II system (Thermo Scientific). The precision was 0.8 ‰, 1.5 ‰ and 2.5 ‰ for δ15N, δ18O and15N-SP, respec-tively.
2.4 Data processing and statistics
The effects of environmental conditions on nitrification were assessed from four indices. The ammonium oxidation rate (AOR) was estimated in each experiment for time ≥ 1 HRT from the difference between influent and effluent NH+4 con-centrations multiplied by the liquid flow rate (kg NH+4 -N d−1). The nitrification efficiency was defined as the ra-tio between AOR and influent ammonium load. The N2O
emission rate (N2O-ER) was calculated by multiplying the
measured N2O concentration by the gas flow rate (mg N2
O-N min−1). The N2O emission factor (N2O-EF) was defined
as the ratio between N2O-ER and AOR (% of oxidized NH+4
-N). The measurements related to liquid or gas samples were averaged by experiment, i.e., the average of data obtained from the samples collected after one hydraulic retention time. Statistical analysis were performed using the R software (R Development Core Team, 2014). The value of 0.05 was used as significance level for Spearman correlations (cor.test function) and linear regressions (lm function). Adjusted r2 was provided as r2for the latter.
2.5 Estimation of ranges of nitrogen isotope ratio in biologically produced N2O
As shown in Fig. 1, the pairwise relationships between δ15N, δ18O and15N-SP assist the determination of the producing and consuming pathways at play. The N atoms that compose the N2O molecule originate from NH+4 molecules when
pro-duced by hydroxylamine oxidation, while originating from the N atoms of NO−3 or NO−2 molecules when produced by nitrite reduction (NO−x molecules). However, the nitrogen isotope ratio of N2O does not equal those of its substrates as
it depends on isotope effects associated to each reaction step of N2O-producing process. The isotope effect of the reaction
step can be determined from the isotope composition of sub-strates or products. Although performed on a few tests here, the obtained value can only be applied to a limited number of environmental conditions. The use of estimates from the literature seems therefore suitable.
Several equations enable us to approximate the isotope ef-fect and its efef-fect on the isotope ratios of substrate and prod-uct pools involved in a reaction. These equations vary ac-cording to the assumptions made on the system boundaries (Denk et al., 2017).
The nitrifying reactor used in this study can be described as an open system continuously supplied by an infinite
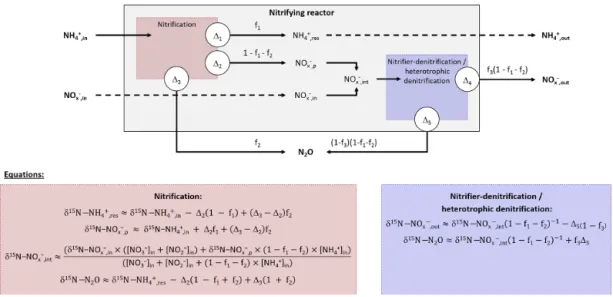
sub-strate pool with constant isotopic composition (NH+4 ,in). A small amount of the infinite substrate pool is transformed into a product pool (NO−x ,p) or a residual substrate pool (NH+4 ,res) when flowing through the system. The equations describing the input, output and processes considered here are presented in Fig. 2 after Fry (2006). Note that the definitions of f and 1are inverse to the cited literature and that 11and 14are
null because no fractionation alter the residual substrate ex-iting the reaction (Fry, 2006).
The balance between input and output of each reactional step allows us to propose equations for calculation of the ni-trogen isotope ratio of compounds in the inflow and outflow of the system (Denk et al., 2017; Fry, 2006). These equations can be simplified under the assumption that a limited amount of N compounds are transformed into N2O, i.e., f2close to
0 and f3 close to 1. Therefore, the N isotope ratios of the
residual substrate pool can be approximated from Eq. (1). δ15N-NH+4 ,res≈δ15N-NH+4 ,in−12(1 − f1) , (1)
where f1is the remaining substrate fraction leaving the
re-actor (i.e., remaining fraction of ammonium), ranging from 0 to 1 (0 % to 100 %), and 12 is the N isotope enrichment
factor associated with ammonium oxidation. In their review, Denk et al. (2017) reported a mean value of −29.6 ± 4.9 ‰ for 12. Therefore, δ15N is higher for residual than the
ini-tial substrate pool (δ15N-NH+4 ,in< δ15N-NH+4 ,res). Conse-quently, the pool of product is depleted in heavier isotope (i.e., nitrite and nitrate hereafter defined as NO−x pool; δ15 N-NO−x ,in> δ15N-NO−x ,int). It is estimated from Eqs. (2)–(4): δ15N-NO−x ,p≈δ15N-NH+4 ,in+12f1, (2)
Where δ15N-NO−
x ,pis the nitrogen isotope ratio of the
prod-uct pool produced by nitrification. The nitrogen isotope ratio of the overall intermediate NO−x exiting this process results from mixing between initial and produced NO−x pools (δ15 N-NO−x ,int) and can be estimated from Eqs. (3) and (4):
δ15N-NO−x ,in= (δ15N-NO− 2 ,in×[NO − 2]in +δ15N-NO− 3 ,in×[NO − 3]in) ([NO−3]in+ [NO−2]in), (3) δ15N-NOx ,int≈
(δ15N-NO−x ,in×([NO−3]in+[NO−2]in)
+δ15N-NO−x ,p×(1−f1)×[NH+4]in)
([NO−3]in+[NO−2]in +(1−f1)×[NH+4]in)
. (4)
Note that δ15N-NO−x ,out equals δ15N-NO−x ,int when f3 is
close to 1, which means that nitrifier denitrification and het-erotrophic denitrification are negligible. Finally, two options must be considered to approximate the nitrogen isotope ratio of N2O that exits the reactor. On the one hand, δ15N-N2O can
be estimated from Eq. (5), when hydroxylamine oxidation is the producing process of N2O:
Figure 2. Diagram and equations of the nitrifying reactor after Fry (2006). It is considered as a sequence of two reactor boxes. (i) The nitrification of inflow ammonium (NH+4 ,in) to a pool of nitrite and nitrate (NO−x ,p), residual ammonium (NH+4 ,res) and nitrous oxide (N2O)
through the hydroxylamine oxidation pathway. (ii) The subsequent reduction of intermediate NO−x ,int: mixing of inflow NO−x ,inand formed
NO−x ,pto nitrous oxide (N2O) through the nitrite reduction pathway, and residual NO−x that exits the reactor (NO−x ,out). Note that residual substrates and formed products exit the reactor without further isotope fractionation (11and 14are null). See text for details.
In addition to the influence of the nitrogen isotope compo-sition of the substrate, δ15N-N2O depends therefore on the
difference between the isotope effects related to the oxida-tion of NH+4 to NO−2 and the oxidation of NH2OH to N2O
for complete nitrification (f1=0), while depending only on
the latter for limited nitrification (f1=1). On the other hand,
δ15N-N2O can be estimated from Eq. (6), when the nitrite
re-duction is the producing process of N2O:
δ15N-N2O ≈ δ15N-NO−x ,int(1 − f1)−1+15. (6)
In addition to the influence of the nitrogen isotope compo-sition of the substrate, when negligible amounts of N2O are
produced by nitrite reduction during nitrifier denitrification or heterotrophic denitrification, its nitrogen isotope ratio de-pends on isotope effect related to this process (15).
3 Results and discussion
Changes in pH, ammonium, nitrite and nitrate concentra-tions confirmed nitrifying activity in the reactor system (Ta-ble S1 in the Supplement, Fig. S3). During the ammo-nium concentration tests, decreases in ammoammo-nium concen-trations ([NH+4]), increases in nitrite and nitrate concentra-tions ([NO−2] and [NO−3], respectively) were observed, while pH remaining below 8 prevented any relevant loss of ammo-nium by volatilization. For example, [NH+4] decreased from 6.2 to 1.1, from 28.6 to 17 and from 62.1 to 49.1 mg N L−1 by flowing through the nitrifying biomass. At the same time, [NO−2] and [NO−3] increased from 0 to 0.2–0.3 mg N L−1and from 1.4–1.8 to 5–10 mg N L−1, respectively. Over the range
of tested conditions, the ratio between ammonium oxidation rate and influent ammonium load ranged from 10 % to 82 %, never exceeding 40 % for suboptimal nitrifying conditions imposed during oxygenation and temperature tests (i.e., oxy-genation levels < 21 % O2and temperatures < 20◦C). The
ammonium concentration, oxygenation level and tempera-ture affected the ammonium oxidation rates, as well N2O
emission rates and factors.
3.1 Isotope composition ranges of N2O produced by
hydroxylamine oxidation and nitrite reduction
Ranges of δ15N for N2O produced by different processes
were hypothesized from Eqs. (1)–(5) for pairwise rela-tionships with reviewed data of δ18O and 15N-SP. To this aim, measurements of isotope ratios of the different nitrogen species were required. The δ15N values of in-flow ammonium, nitrite and nitrate were −3 ± 0.1 ‰ (n = 3), −15 ± 0.1 ‰ (n = 2) and 6.9 ± 0.3 ‰ (n = 3), respec-tively, during ammonium concentration experiments (Fig. S3 and Table S2). The δ15N of residual NH+4 and interme-diate NO−x were estimated from Eqs. (1)–(4) with f1=
0.1 or 0.9 (Fig. S2d–f), 12= −30 ‰, the highest [NH+4]in
(62.1 mg N L−1) and the lowest [NO−x]in (1.4 mg N L−1).
They ranged from −3 ‰ to 27 ‰ and from −32 ‰ to 7 ‰, respectively, which encompasses a few isotope compositions measured in the outflow during ammonium concentration tests (Fig. S3 and Table S2).
Prior to pairwise comparisons with δ18O and 15N-SP, ranges of δ15N values for N2O produced by the
esti-mated from Eq. (5). The net isotope effect of N2O production
by ammonium oxidation via hydroxylamine can be estimated by combining the isotope effects of ammonium oxidation and hydroxylamine oxidation to N2O. The net isotope effect
associated with ammonium oxidation to nitrite ranges from −38.2 ‰ to −14.2 ‰ (Casciotti et al., 2003) and can approx-imate the nitrogen isotope ratio of hydroxylamine transitory produced. The isotope effect related to hydroxylamine ox-idation to N2O ranging from −26.0 ‰ to 5.7 ‰ from data
in Sutka et al. (2003, 2004, 2006); the net isotope effect of N2O production by ammonium oxidation via hydroxylamine
(13)can range from −64.2 ‰ (−26.0+(−38.2)) to −8.5 ‰
(5.7 + (−14.2)). Considering the range of the nitrogen iso-tope ratio of residual ammonium, this method provided a broad range of δ15N values, from −65 ‰ (δ15N-NH+4 ,res= −3 ‰, 12= −30 ‰, f1=0.9 and 13= −64.2 ‰) to 46 ‰
(δ15N-NH+4 ,res=27 ‰ , 12= −30 ‰, f1=0.1 and 13=
−8.5 ‰), for N2O produced from ammonium by
hydrox-ylamine oxidation, according to Eq. (5). These values en-compassed the values proposed by others (−46.5 ‰ and −32.9 ‰; Sutka et al., 2006; Yamazaki et al., 2014).
A higher range of the net nitrogen isotope effect for ni-trite reduction than hydroxylamine oxidation pathway was estimated for N2O production (Fig. 3a and b). Prior to
be-ing reduced to N2O through the nitrite reduction pathway,
NO−x was mainly derived from ammonium oxidation in the nitrifying system (Eqs. 1–4); the resulting intermediate δ15 N-NO−x ranges from −32 ‰ to 7 ‰. In addition to this, the net isotope effects related to the N2O production through nitrite
reduction performed by nitrifiers or heterotrophic denitrifiers (15) ranges from −52.8 ‰ to −6 ‰ (Lewicka-Szczebak et
al., 2014; Sutka et al., 2008). Consequently, the δ15N of N2O
produced by nitrite reduction ranged from −89 ‰ (δ15 N-NO−x ,int= −32 ‰, f1=0.1 and 15= −52.8 ‰) to 64 ‰
(δ15N-NO−x ,int=7 ‰, f1=0.9 and 15= −6 ‰) ,
accord-ing to Eq. (6). This is consistent with previous findaccord-ings re-porting δ15N-N2O between −112 ‰ and −48 ‰ for
nitri-fier denitrifying systems (Mandernack et al., 2009; Pérez et al., 2006; Yamazaki et al., 2014; Yoshida, 1988). However, a similar range of nitrite-derived δ15N-N2O is suggested for
nitrifiers and heterotrophic denitrifiers, because ammonium oxidation influences both processes in the system used in this study where there is a low initial amount of NO−2 and NO−3. Pairwise comparisons of δ15N, δ18O and15N-SP estimates of the different experiments are presented in Fig. 3. These comparisons provided ranges of plausible isotope composi-tions for N2O produced by nitrifying or heterotrophic
denitri-fying bacteria through the hydroxylamine oxidation and ni-trite reduction pathways (red and blue boxes, respectively). The measured N2O isotope compositions were compared
to these estimates to identify the N2O-producing and N2
O-consuming pathways likely at play in oxygenation, tempera-ture and ammonium concentration tests.
This approach suggests that the nitrite reduction pathway was the main contributor to N2O emissions. Heterotrophic
denitrification likely influenced N2O emissions, as shown by
oxygen isotope ratios higher than 35 ‰ (Snider et al., 2013; Fig. 3a and c). However, this conclusion depends highly on δ18O-N2O ranges. Furthermore, the application of
atmo-spheric oxygen δ18O (23.5 ‰; Kroopnick and Craig, 1972) to estimate the oxygen isotope ratio of N2O produced by
hydroxylamine oxidation remains uncertain since respiratory activity and air stripping might drive isotopic fractionations and increase δ18O of residual dissolved oxygen (Nakayama et al., 2007). To date, the oxygen isotope fractionation related to air stripping has not been investigated. Note that this esti-mate relies on the assumption that there is no accumulation of NH2OH and that its oxidation to N2O occurs before or
independently of its oxidation to NO−2.
3.2 The effect of oxygen limitation on the N2O-producing pathways
Ammonium concentrations decreased from 20.2–37.3 to 11.4–31.1 mg N L−1, with 45 % to 89 % of the inflow am-monium remaining in the outflow during the oxygenation tests (Fig. S2d). When measured, the cumulated concentra-tions of NO−2 and NO−3 ([NO−x]) increased from 2.4–4.1 to 4.7–11 mg N L−1between inflow and outflow and were com-posed by at least 74 % and 82 % of NO−3, respectively. The mass balance between N compounds that enter and exit the reactor evidenced a default of up to 5 mg N and impacted each test. No significant amounts of NO were detected during any tests (data not shown), whereas NH2OH, N2and N
min-eralization/assimilation in the biofilm were not quantified. The accumulation of such amounts of NH2OH is unlikely.
Heterotrophic denitrification, i.e., the reduction of NO−x and more particularly of N2O to N2, may explain the incomplete
N mass balance. However, the measurement of small N2
vari-ations in the gas mixture exiting the reactor and comprising at least 79 % N2was not performed.
The oxygenation level had contrasting effects on am-monium oxidation rates, and N2O emission rates and
factors (Fig. 4a–c). Between an oxygenation of 0 % to 10.5 % O2 in the gas mixture, no clear trend in
ammo-nium oxidation rates was observed although it was rather low (1.1 ± 0.5 mg NH+4-N min−1). In the same oxygena-tion level interval, the N2O emission rate increased for
two of three inflows [NH+4] tested. It increased from 0.35 × 10⁻³ to 0.73 × 10⁻³mg N min−1 between 0 % and 10.5 % O2 at 25.3 mg NH+4-N L−1, and from 1.34 × 10⁻³
to 1.4 × 10⁻³mg N min−1 between 4.2 % and 10.5 % O2
at 23.8 mg NH+4-N L−1; it decreased from 2.86 × 10⁻³ to 2.04 × 10⁻³mg N min−1 between 4.2 % and 10.5 % O2 at
37.3 mg NH+4-N L−1. Finally, the N2O emission factor
glob-ally increased from 0.05 % to 0.16 % in the 0 %–10.5 % O2
interval. At oxygenation levels from 10.5 % to 21 % O2,
the ammonium oxidation rates increased from 0.9 ± 0.2 to 2.1 ± 0.4 mg N min−1, with N2O emission rates remaining
Figure 3. Interpretation maps of the isotope signature of N2O. Schematic maps of (a) δ15N-δ18O, (b) δ15N-15N-SP and (c) δ18O-15N-SP.
The red and blue squares show the range of the data for N2O produced by “hydroxylamine oxidation” and “nitrite reduction”, respectively.
The shaded area represents mixing of N2O produced by these pathways. The N2O reduction increases δ15N, δ18O and15N-SP with slopes
characterizing the pairwise relationships.
stable at 1.2 × 10⁻³±0.6 × 10⁻³mg N min−1and the emis-sion factors decreasing from 0.15 ± 0.03 % to 0.06 ± 0.03 %.
15N-SP varied between −9 ‰ to 2 ‰ over the range of
imposed oxygenation levels, with a marked increase when oxygenation increased from 16.8 % to 21 % O2(Fig. 4d). A
similar marked change in nitrogen and oxygen isotope ratios of N2O (decrease and increase, respectively) was observed
when oxygenation increased from 16.8 % to 21 % O2(Fig. 4e
and f). Note that to observe the latter variations the effect of ammonium concentration was not included. One way to do so is to compare the isotope composition average at 21 % O2
with the isotope composition measured for 23.8 NH+4-N L−1 at 16.8 % O2. The15N-SP values were close to the range of
−11 ‰ to 0 ‰ reported for N2O produced by nitrifying or
denitrifying bacteria through nitrifier denitrification and het-erotrophic denitrification (Toyoda et al., 2017; Yamazaki et al., 2014). Additional suggestions can be made from the15 N-SP dynamics between and variations within the oxygenation levels. If an increase in the hydroxylamine oxidation
contri-bution to the N2O emission might explain the higher15
N-SP observed at 21 % O2 as compared to lower oxygenation
levels, an additional mechanism can explain the variations observed for the experiments with oxygen-depleted atmo-sphere. The15N-SP dynamics suggest a higher amount of N2O was reduced to N2at 4.2 % than 16.8 % O2. The
reduc-tion of N2O to N2can increase the15N-SP of residual N2O
(Mothet et al., 2013). In heterotrophic denitrifying bacteria however, the nitrous oxide reductase involved in this reac-tion is highly sensitive to inhibireac-tion by oxygen (Betlach and Tiedje, 1981; Otte et al., 1996). This might explain the de-crease in15N-SP from −3.8 ± 4.4 ‰ to −7.2 ± 1.7 ‰ when O2 increased from 4.2 % to 16.8 %. This is also consistent
with a possible onset of anoxic microsites within the reac-tor biomass more likely at 4.2 % than 16.8 % O2. The
dis-solved oxygen (DO) concentration never decreased below 1.5 mg O2L−1 in the bulk solution at the top of the reactor
(Fig. S2). However, DO decreased from the bulk reactor so-lution toward the deeper layers of biofilm due to the activity
Figure 4. Effect of oxygenation level on (a) the ammonium oxidation rate, (b) the nitrous oxide emission rate, (c) the N2O emission factor,
and (d) the nitrogen isotopomer site preference, (e) the nitrogen isotope ratio and (f) the oxygen isotope ratio of N2O. Average and standard
deviation (error bars) are calculated for steady-state conditions. Note that gas sampling for isotope analysis was lacking for 5 of the 13 oxygenation tests.
of ammonium oxidizers (Sabba et al., 2018). This is further exacerbated by heterogeneous and varying distribution of air circulation within the static bed. Therefore, oxygen depletion can be assumed within the biofilm. Finally, the N2O
reduc-tion to N2likely explains the overall decrease in N2O
emis-sion between 16.8 % and 0 % O2(Fig. 4b).
In general the N2O reduction to N2is accompanied by an
increase in nitrogen and oxygen isotope ratios of N2O
(Os-trom et al., 2007; Vieten et al., 2007). However, our results show a decrease in δ15N-N2O, and δ18O-N2O remained
sta-ble between 30.5 ‰ and 34.7 ‰, when the N2O reduction is
thought to increasingly constraint the N2O isotopocules with
decreasing O2from 16.8 % to 4.2 % (Fig. 4e and f). The
in-dependence of samples taken during the oxygenation test can explain this. The N2O sampled at 4.2 % O2is not a residual
fraction of N2O produced at 16.8 % O2that would have
un-dergone a partial reduction. The oxygenation level can alter the isotope fractionation factors through the control of reac-tion rates, as evidenced for the reducreac-tion of N2O to N2 by
Vieten et al. (2007). These authors reported lower reaction
rates and increased isotope fractionation factors with increas-ing oxygenation levels. In our case, a similar phenomenon might have influenced both oxidative and reductive processes leading to the production of N2O and occurring before its
ul-timate reduction to N2. However, knowledge regarding
con-trols, such as the oxygenation level, on the net isotope effect related to a sequence of non-exclusive oxidative and reduc-tive processes is still lacking and requires further investiga-tions. Additionally, with δ18O below 35 ‰ for all but one experiment the oxygenation tests did not provide evidence for the heterotrophic denitrifier contribution to N2O
emis-sions, likely due to oxygen exchange with water (Snider et al., 2015, 2012, 2013).
3.3 Difference in temperature dependency of
hydroxylamine and ammonium oxidizers as driver of hydroxylamine oxidation contribution to N2O
emissions
Ammonium concentrations decreased from 6.2–62.1 to 0.9– 54.1 mg N L−1 and from 18 % to 79 % of the inflow am-monium remaining in the outflow during the temperature and ammonium concentration tests (Fig. S2e and f). This remaining fraction was positively correlated to ammonium concentrations (r = 0.96) and negatively correlated to tem-perature within a lower range of values (61 %–67 %; r = −0.94). In the ammonium tests, the cumulated concentra-tions of NO−2 and NO−3 ([NO−x]) increased from 1.4–6.1 to 5.1–19.6 mg N L−1between inflow and outflow and were composed by at least 74 % and 91 % of NO−3, respectively. Noticeably, the nitrite concentrations in the outflow linearly increased with temperature (r2=0.95; Fig. S2h).
An increase in temperature and inflow ammonium concen-trations both positively influenced the rates of NH+4 oxida-tion and N2O emissions and the emission factor (Fig. 5).
The NH+4 oxidation rate linearly increased from 1.3 to 1.5 mg NH+4-N min−1 with temperature (r = 0.89; Fig. 5a) and increased from 0.97 to 3.49 mg NH+4-N min−1 with a 10-fold increase in the inflow ammonium concentration (r = 0.82; Fig. 5b). These positive correlations are well known in the temperature range investigated here and are likely due to enhanced enzymatic activity and Michaelis–Menten kinet-ics, respectively (Groeneweg et al., 1994; Kim et al., 2008; Raimonet et al., 2017). Similarly, the N2O emission rates
in-creased from 80.4 × 10⁻⁶ to 2.5 × 10⁻³mg N2O-N min−1,
and from 83.6 × 10⁻⁶to 6.2 × 10⁻³mg N2O-N min−1upon
changes in temperature and the ammonium concentrations, respectively. These results are in agreement with positive cor-relations between N2O emissions with temperature and
am-monium concentration observed from modeling and exper-imental studies on partial nitrification and activated sludge systems (Guo and Vanrolleghem, 2014; Law et al., 2012a; Reino et al., 2017). Altogether this confirms a correlation between the N2O emission rates and the ammonium
oxi-dation rates. Interestingly, the increase in the N2O emission
factor indicates a stronger effect of temperature and ammo-nium concentration on the N2O emission rate than on NH+4
oxidation. The N2O emission factor increased from 0.07 %
to 0.16 %, and from 0.01 % to 0.29 % with temperature and inflow ammonium concentration, respectively (r > 0.94; Fig. 5e and f). Both experiments suggest that the increase in N2O emissions results from the increasing production of
N2O by hydroxylamine oxidation or nitrite reduction in
com-bination with a slow rate or the absence of N2O reduction to
N2. Furthermore, no nitrite accumulation was observed with
increasing ammonium oxidation rate (Fig. S2i). Therefore, if N2O emission results mainly from the nitrite reduction
pathway, this suggests that the nitrite reduction pathway is more responsive to the increasing ammonium oxidation rate
Figure 5. Effect of temperature and inflow ammonium concentra-tion on (a, b) the ammonium oxidaconcentra-tion rate, (c, d) the nitrous oxide emission rate and (e, f) the N2O emission factor.
than the nitrite oxidation pathway; the latter remains the main pathway of nitrite consumption.
The range of nitrogen isotopomer site preference observed during the temperature and concentration tests (from −8 ‰ to 2.6 ‰) was similar to those measured during the oxygena-tion tests, confirming the high contribuoxygena-tion of the nitrite re-duction pathway to N2O emissions (Fig. 6a). This is
con-sistent with previous findings based on the15N-SP of N2O
emitted from aerobic activated sludge (Toyoda et al., 2011; Tumendelger et al., 2016; Wunderlin et al., 2013), although authors reported15N-SP as high as 10 ‰. This can suggest a higher oxygen limitation being favorable to the contribution of the nitrite reduction to N2O production in the nitrifying
re-actor studied here. Hydroxylamine oxidation can even be the main N2O-producing pathway, as evidenced by Tumendelger
et al. (2014) in an aerated tank.
Furthermore,15N-SP increased with temperature between 13.5 and 19.8◦C. Our data suggest that temperature was the main control on the change in N2O-producing pathways
within this temperature range (Fig. 6a). This could explain higher SP obtained with a 28.6 mg N L−1inflow ammonium concentration than with 42.8. The temperature control seems to mitigate here the effect that ammonium concentration can have on the N2O-producing pathways evidenced elsewhere.
Figure 6. Effect of temperature (orange symbols) and inflow ammonium concentration (blue symbols) on (a) the nitrogen isotopomer site preference, (b) the nitrogen isotope ratio and (c) the oxygen isotope ratio of N2O. Average and standard deviation (error bars) are calculated
for the samples taken after one hydraulic retention time. Note that the isotopic measurements of gas samples taken at inflow ammonium concentration of 42.7 and 42.9 mg N L−1were both recorded as 42.8 mg N L−1in the legend.
Wunderlin et al. (2012, 2013) observed an increase in15N-SP from −1.2 ‰ to 1.1 ‰ when inflow [NH+4] increased from 9 to 15 mg N L−1. They also observed 3 ‰–6 ‰ decreases in15N-SP over the course of ammonium oxidation experi-ments and suggested that the NH2OH oxidation contribution
to N2O production increased when conditions of NH+4
ex-cess, low NO−2 concentrations and high nitrogen oxidation rate occur simultaneously. Our findings are consistent with the observation of Groeneweg et al. (1994) showing that tem-perature rather than ammonium concentration influenced the ammonium oxidation rate.
15N-SP increased from −6.5 ‰ to 2.6 ‰ with increasing
temperature from 13.5 to 19.8◦C (Fig. 6a). This15N-SP in-crease may either result from an inin-crease in the N2O
pro-duction by the hydroxylamine oxidation pathway or the N2O
reduction to N2. Since an optimal oxygenation level was
im-posed and increased emissions were observed, the increas-ing15N-SP is more likely due to N2O production by the
hy-droxylamine oxidation pathway. Reino et al. (2017) also ob-served an increase of N2O emissions for temperatures above
15◦C in a granular sludge airlift reactor performing partial nitritation. The authors suggested two hypothesis to explain their results: (i) the difference in the kinetic dependency with
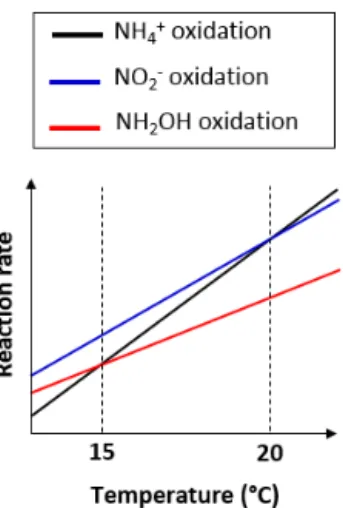
temperature of enzymes involved in ammonium and hydrox-ylamine oxidation; (ii) the temperature dependency of the acid–base equilibrium ammonium–ammonia. The changes in15N-SP observed here are consistent with the former hy-potheses. Hydroxylamine oxidation likely becomes the limit-ing step at temperatures above 15◦C, while being faster than ammonium oxidation at lower temperatures (Fig. 7). At tem-peratures above 15◦C, hydroxylamine therefore accumulates and leads to a higher contribution of the hydroxylamine oxi-dation pathway to N2O emissions. It would thus be
interest-ing to determine the temperature dependency of the hydrox-ylamine oxidase.
The change in nitrous producing and nitrous oxide-consuming pathways had contrasting effects on the nitro-gen and oxynitro-gen isotope ratios of nitrous oxide (Fig. 6b and c). δ15N-N2O decreased from −2.5 ‰ to −40.9 ‰ with an
increasing contribution of hydroxylamine oxidation to the N2O emissions, i.e., when temperature increased from 13.5
to 19.8◦C. This is in contrast with the expected net lower
iso-tope effect for N2O produced by hydroxylamine oxidation
than nitrite reduction, and points out that further investiga-tions are needed (Snider et al., 2015; Yamazaki et al., 2014). The changes in δ18O-N2O were less straightforward, likely
Figure 7. Graph of the difference in temperature dependency of the reactions involved in nitrification.
influenced by changes in the reaction rates in addition to changes in the contribution of N2O-producing pathways. The
values decreased from 41.1 ‰ to 34.3 ‰ with an increasing contribution of hydroxylamine oxidation to the N2O
emis-sions when temperature increased from 13.5 to 18.2◦C. It decreased linearly from 38.2 ‰ to 31.8 ‰ with increasing re-action rate when inflow ammonium concentration increased from 20.2 to 62.1 mg NH+4-N L−1(r2=0.83).
3.4 Difference in oxidation and reduction rates of nitrite as driver of nitrite reduction contribution to N2O emissions
The oxygenation, temperature and ammonium concentration tests revealed a strong control of nitrite-oxidizing activity and the contribution of the nitrite reduction pathway to N2O
pro-duction. No relationship was observed between NO−2 con-centrations and oxygenation (Fig. S2g). In addition to this, higher 15N-SP at 21 % compared to the 10.5 %–16.8 % O2
was observed while the temperature remained below 20◦C (Fig. 4d). This is most likely due to higher nitrite oxidation than nitrite reduction rates in response to increasing oxy-genation levels to 21 % O2, which is consistent with the
ni-trite oxidation step sensitivity to oxygen limitation (Pollice et al., 2002; Tanaka and Dunn, 1982). Additionally,15N-SP close to 0 ‰ observed at the highest oxygenation level indi-cates a decreasing contribution to N2O production of nitrite
reduction over hydroxylamine oxidation pathway. The high-est oxygenation level thus limits the reduction pathways (i.e., NO−2 reduction to N2O and N2O reduction to N2) while
fa-voring the ammonium and nitrite oxidation pathways. During the temperature and ammonium concentration tests, the contribution of the hydroxylamine oxidation path-way to N2O emissions increased with a temperature between
13.5 and 19.8◦C (Sect. 3.3) and decreased in favor of the nitrite reduction pathway when the temperature exceeded 20◦C (Fig. 6a).15N-SP was low when the temperature
ex-ceeded 20◦C (−7.3 ± 1 ‰), while being higher than −5 ‰ (−1.3 ± 2.4 ‰) when the temperature ranged from 18.2 to 19.8◦C. At temperatures above 20◦C, ammonium oxidation
rates exceed nitrite oxidation rates (Fig. 7; Kim et al., 2008; Raimonet et al., 2017). This most likely explains the in-creased contribution of the nitrite reduction pathway to N2O
emission, as more nitrite becomes available for nitrifier den-itrification and/or heterotrophic denden-itrification. As little ni-trite accumulated (Fig. S2h), lower rates of nini-trite-consuming processes than nitrite-producing processes can be inferred (nitrite reduction and oxidation vs. ammonium oxidation). Additionally, values of δ18O > 35 ‰ measured during these tests suggest a significant contribution of heterotrophic den-itrifiers to N2O emissions (Snider et al., 2013). This seems
to occur at the lowest hydroxylamine oxidation contribution to N2O production below 18◦C and at 20.3◦C. Furthermore,
the denitrifiers were impacted to a larger extent by tempera-ture than ammonium concentration.
4 Conclusion
Our results demonstrated that whatever the imposed condi-tions, the nitrifying biomass produced N2O and nitrite
reduc-tion remained the main N2O-producing pathway. The N2O
emissions were sensitive to oxygenation, temperature and NH+4 concentration likely due to the control of enzymatic activities. The use of N2O isotopocules confirmed the
pro-cesses that control N2O emissions under oxygenation
con-strain and improved knowledge of processes that control N2O under temperature constraints. Among the
environmen-tal variables tested, temperature appears to be the main con-trol on N2O-producing pathways under nitrifying conditions,
due to its dissimilar effects on ammonium-oxidizing and nitrite-oxidizing activities. Ranges of optimal temperature for nitrification and limited N2O emissions can be
recom-mended. The combination of low N2O emissions and high
ni-trification rates may occur close to 15◦C. From 15 to 20◦C, an increasing nitrification rate increases N2O emissions via
the hydroxylamine oxidation pathway. Above 20◦C, an in-creasing nitrification rate increases the N2O emissions via
the nitrite reduction pathway.
We studied the impact of environmental variables on N2
O-producing pathways based on the isotope analysis of a lim-ited sample number of dissolved N compounds. The ap-proach and conclusions based on the impact of these vari-ables on N2O emissions most likely apply to nitrification
and denitrification in soils, sediments, lakes and other natural waters. These systems are subject to dynamic environmen-tal conditions, among which are ammonium concentrations, oxygenation and temperature. The comparison of the N2O
isotopocules measured and those hypothesized from the lit-erature provides a useful tool to discuss the N2O-producing
and N2O-consuming process, as well the underlying control
solutions of N2O emissions by constraining trough space and
time the contribution of N2O-producing and N2O-consuming
pathways. However, it appears that additional efforts are still needed to reduce, if possible, the ranges of N2O isotope
sig-natures related to each producing and consuming processes.
Data availability. All data included in this study are available upon request by contacting the corresponding author.
Supplement. Additional information about the nitrifying activity of the biomass, the experimental conditions and the time series of ammonium oxidation experiments can be found in the Sup-plement. The supplement related to this article is available online at: https://doi.org/10.5194/bg-17-979-2020-supplement.
Author contributions. JF, AF and MSp designed the experiments with contributions from GH, MSe and AML. GH, JF and LL car-ried out the experiments. GH performed the stable isotope mea-surements with a contribution from VV and interpreted them with contribution from MSe. GH and JF processed the data. GH, JF and AML prepared the manuscript with contributions from all co-authors.
Competing interests. The authors declare that they have no conflict of interest.
Acknowledgements. The authors are grateful to Sam Azimi and the “Direction Innovation Environment” of SIAAP for providing the media colonized by the nitrifying biomass, Mansour Bounouba and Simon Dubos for their assistance in chemical analyses and in setup and development of the nitrifying reactor.
Financial support. This research has been supported by the French National Research Agency (grant no. ANR-15-CE04-0014-02).
Review statement. This paper was edited by Perran Cook and re-viewed by two anonymous referees.
References
Andersson, K. K. and Hooper, A. B.: O2 and H2O are each
the source of one O in NO−2 produced from NH3 by
Ni-trosomonas: 15N-NMR evidence, FEBS Lett., 164, 236–240, https://doi.org/10.1016/0014-5793(83)80292-0, 1983.
Betlach, M. R. and Tiedje, J. M.: Kinetic explanation for accumu-lation of nitrite, nitric oxide, and nitrous oxide during bacterial denitrification, Appl. Environ. Microb., 42, 1074–1084, 1981. Bollon, J., Filali, A., Fayolle, Y., Guerin, S., Rocher, V., and Gillot,
S.: N2O emissions from full-scale nitrifying biofilters, Water
Res., 102, 41–51, https://doi.org/10.1016/j.watres.2016.05.091, 2016.
Bothe, H., Ferguson, S. J., and Newton, W. E.: Biology of the nitro-gen cycle, https://doi.org/10.1016/B978-0-444-52857-5.X5000-0, Elsevier, Amsterdam, the Netherlands, 2007.
Caranto, J. D., Vilbert, A. C., and Lancaster, K. M.: Nitrosomonas europaea cytochrome P460 is a direct link between nitrification and nitrous oxide emission, P. Natl. Acad. Sci. USA, 113, 14704– 14709, https://doi.org/10.1073/pnas.1611051113, 2016. Casciotti, K. L., Sigman, D. M., and Ward, B. B.: Linking
diversity and stable isotope fractionation in
ammonia-oxidizing bacteria, Geomicrobiol. J., 20, 335–353,
https://doi.org/10.1080/01490450303895, 2003.
Crutzen, P. J., Heidt, L. E., Krasnec, J. P., Pollock, W. H., and Seiler, W.: Biomass burning as a source of atmospheric gases CO, H2, N2O, NO, CH3Cl and COS, Nature, 282, 253–256,
https://doi.org/10.1038/282253a0, 1979.
Denk, T. R. A., Mohn, J., Decock, C., Lewicka-Szczebak, D., Harris, E., Butterbach-Bahl, K., Kiese, R., and Wolf, B.: The nitrogen cycle: A review of isotope effects and iso-tope modeling approaches, Soil Biol. Biochem., 105, 121–137, https://doi.org/10.1016/j.soilbio.2016.11.015, 2017.
Frame, C. H. and Casciotti, K. L.: Biogeochemical controls and isotopic signatures of nitrous oxide production by a marine ammonia-oxidizing bacterium, Biogeosciences, 7, 2695–2709, https://doi.org/10.5194/bg-7-2695-2010, 2010.
Fry, B.: Stable Isotope Ecology, Springer-Verlag, New York, 2006. Groeneweg, J., Sellner, B., and Tappe, W.: Ammonia oxida-tion in nitrosomonas at NH3 concentrations near km:
Ef-fects of pH and temperature, Water Resour., 28, 2561–2566, https://doi.org/10.1016/0043-1354(94)90074-4, 1994.
Guo, L. and Vanrolleghem, P. A.: Calibration and valida-tion of an activated sludge model for greenhouse gases no. 1 (ASMG1): prediction of temperature-dependent N2O
emission dynamics, Bioproc. Biosyst. Eng., 37, 151–163, https://doi.org/10.1007/s00449-013-0978-3, 2014.
Heil, J., Liu, S., Vereecken, H., and Brüggemann, N.: Abiotic ni-trous oxide production from hydroxylamine in soils and their de-pendence on soil properties, Soil Biol. Biochem., 84, 107–115, https://doi.org/10.1016/J.SOILBIO.2015.02.022, 2015. Hollocher, T. C., Tate, M. E., and Nicholas, D. J.: Oxidation of
ammonia by Nitrosomonas europaea. Definite 18O-tracer evi-dence that hydroxylamine formation involves a monooxygenase, J. Biol. Chem., 256, 10834–10836, 1981.
IPCC: Climate Change 2014: Impacts, Adaptation, and Vulnerabil-ity. Part A: Global and Sectoral Aspects. Contribution of Work-ing Group II to the Fifth Assessment Report of the Intergovern-mental Panel on Climate Change, edited by: Field, C. B., Barros, V. R., Dokken, D. J., Mach, K. J., Mastrandrea, M. D., Bilir, T. E., Chatterjee, M., Ebi, K. L., Estrada, Y. O., Genova, R. C., Girma, B., Kissel, E. S., Levy, A. N., MacCracken, S., Mastrandrea, P. R., and White, L. L., Cambridge University Press, Cambridge, UK and New York, NY, USA, 1132 pp., 2014.
Jinuntuya-Nortman, M., Sutka, R. L., Ostrom, P. H., Gandhi, H., and Ostrom, N. E.: Isotopologue fractionation during micro-bial reduction of N2O within soil mesocosms as a function of
water-filled pore space, Soil Biol. Biochem., 40, 2273–2280, https://doi.org/10.1016/j.soilbio.2008.05.016, 2008.
Jung, M.-Y., Well, R., Min, D., Giesemann, A., Park, S.-J., Kim, J.-G., Kim, S.-J., and Rhee, S.-K.: Isotopic signatures of N2O
produced by ammonia-oxidizing archaea from soils, ISME J., 8, 1115–1125, https://doi.org/10.1038/ismej.2013.205, 2014. Kampschreur, M. J., Temmink, H., Kleerebezem, R., Jetten, M.
S. M., and van Loosdrecht, M. C. M.: Nitrous oxide emis-sion during wastewater treatment, Water Res., 43, 4093–4103, https://doi.org/10.1016/j.watres.2009.03.001, 2009.
Kim, J.-H., Guo, X., and Park, H.-S.: Comparison study of the ef-fects of temperature and free ammonia concentration on nitrifi-cation and nitrite accumulation, Process Biochem., 43, 154–160, https://doi.org/10.1016/J.PROCBIO.2007.11.005, 2008. Koba, K., Osaka, K., Tobari, Y., Toyoda, S., Ohte, N., Katsuyama,
M., Suzuki, N., Itoh, M., Yamagishi, H., Kawasaki, M., Kim, S. J., Yoshida, N., and Nakajima, T.: Biogeochemistry of nitrous ox-ide in groundwater in a forested ecosystem elucidated by nitrous oxide isotopomer measurements, Geochim. Cosmochim. Ac., 73, 3115–3133, https://doi.org/10.1016/j.gca.2009.03.022, 2009. Kool, D. M., Wrage, N., Oenema, O., Dolfing, J., and Van
Groeni-gen, J. W.: Oxygen exchange between (de)nitrification interme-diates and H2O and its implications for source determination of
NO−3 and N2O: a review, Rapid Commun. Mass Sp., 21, 3569–
3578, https://doi.org/10.1002/rcm.3249, 2007.
Kroopnick, P. and Craig, H.: Atmospheric oxygen: isotopic com-position and solubility fractionation, Science, 175, 54–55, https://doi.org/10.1126/science.175.4017.54, 1972.
Law, Y., Ni, B.-J., Lant, P., and Yuan, Z.: N2O production rate of an
enriched ammonia-oxidising bacteria culture exponentially cor-relates to its ammonia oxidation rate, Water Res., 46, 3409–3419, https://doi.org/10.1016/j.watres.2012.03.043, 2012a.
Law, Y., Ye, L., Pan, Y., and Yuan, Z.: Nitrous oxide emissions from wastewater treatment processes, Philos. T. R. Soc. Lon. B, 367, 1265–1277, https://doi.org/10.1098/rstb.2011.0317, 2012b. Lewicka-Szczebak, D., Well, R., Köster, J. R., Fuß, R.,
Senbayram, M., Dittert, K., and Flessa, H.: Experimen-tal determinations of isotopic fractionation factors associ-ated with N2O production and reduction during denitri-fication in soils, Geochim. Cosmochim. Ac., 134, 55–73, https://doi.org/10.1016/j.gca.2014.03.010, 2014.
Mandernack, K. W., Mills, C. T., Johnson, C. A., Rahn, T., and Kinney, C.: The δ15N and δ18O values of N2O produced during the co-oxidation of ammonia by
methanotrophic bacteria, Chem. Geol., 267, 96–107,
https://doi.org/10.1016/J.CHEMGEO.2009.06.008, 2009. McIlvin, M. R. and Altabet, M. A.: Chemical conversion of nitrate
and nitrite to nitrous oxide for nitrogen and oxygen isotopic anal-ysis in freshwater and seawater, Anal. Chem., 77, 5589–5595, https://doi.org/10.1021/ac050528s, 2005.
Mothet, A., Sebilo, M., Laverman, A. M., Vaury, V., and Mariotti, A.: Is site preference of N2O a tool to
iden-tify benthic denitrifier N2O?, Environ. Chem., 10, 281–284, https://doi.org/10.1071/EN13021, 2013.
Nakayama, N., Obata, H., and Gamo, T.: Consumption of dis-solved oxygen in the deep Japan Sea, giving a precise iso-topic fractionation factor, Geophys. Res. Lett., 34, L20604, https://doi.org/10.1029/2007GL029917, 2007.
Ostrom, N. E., Pitt, A., Sutka, R., Ostrom, P. H., Grandy, A. S., Huizinga, K. M., and Robertson, G. P.: Isotopo-logue effects during N2O reduction in soils and in pure
cultures of denitrifiers, J. Geophys. Res., 112, G02005, https://doi.org/10.1029/2006JG000287, 2007.
Otte, S., Grobben, N. G., Robertson, L. A., Jetten, M. S., and Kuenen, J. G.: Nitrous oxide production by Alcaligenes faecalis under transient and dynamic aerobic and anaerobic conditions, Appl. Environ. Microb., 62, 2421–2426, 1996.
Pérez, T., Garcia-Montiel, D., Trumbore, S., Tyler, S., de Camargo, P., Moreira, M., Piccolo, M., and Cerri, C.: Nitrous oxide nitrification and denitrification 15N
enrichment factors from Amazon forest soils, Ecol.
Appl., 16, 2153–2167, https://doi.org/10.1890/1051-0761(2006)016[2153:nonadn]2.0.co;2, 2006.
Pollice, A., Tandoi, V., and Lestingi, C.: Influence of aeration and sludge retention time on ammonium oxidation to nitrite and ni-trate, Water Res., 36, 2541–2546, https://doi.org/10.1016/S0043-1354(01)00468-7, 2002.
Raimonet, M., Cazier, T., Rocher, V., and Laverman, A. M.: Nitrifying kinetics and the persistence of nitrite in the Seine river, France, J. Environ. Qual., 46, 585–595, https://doi.org/10.2134/jeq2016.06.0242, 2017.
Ravishankara, A. R., Daniel, J. S., and Portmann, R. W.: Nitrous oxide (N2O): the dominant ozone-depleting
sub-stance emitted in the 21st century, Science, 326, 123–125, https://doi.org/10.1126/science.1176985, 2009.
R Development Core Team: R: A Language and Environment for Statistical Computing, R foundation for Statistical Computing Vienna, Vienna, Austria, 2014.
Reino, C., van Loosdrecht, M. C. M., Carrera, J., and Pérez, J.: Effect of temperature on N2O emissions from a highly
enriched nitrifying granular sludge performing partial nitrita-tion of a low-strength wastewater, Chemosphere, 185, 336–343, https://doi.org/10.1016/j.chemosphere.2017.07.017, 2017. Sabba, F., Terada, A., Wells, G., Smets, B. F., and
Neren-berg, R.: Nitrous oxide emissions from biofilm processes for wastewater treatment, Appl. Microbiol. Biot., 102, 9815–9829, https://doi.org/10.1007/s00253-018-9332-7, 2018.
Semaoune, P., Sebilo, M., Templier, J., and Derenne, S.: Is there any isotopic fractionation of nitrate associated with diffusion and advection?, Environ. Chem., 9, 158–162, https://doi.org/10.1071/EN11143, 2012.
Snider, D., Thompson, K., Wagner-Riddle, C., Spoelstra, J., and Dunfield, K.: Molecular techniques and stable isotope ratios at natural abundance give complementary inferences about N2O production pathways in an agricultural soil fol-lowing a rainfall event, Soil Biol. Biochem., 88, 197–213, https://doi.org/10.1016/j.soilbio.2015.05.021, 2015.
Snider, D. M., Venkiteswaran, J. J., Schiff, S. L., and Spoelstra, J.: Deciphering the oxygen isotope composition of nitrous ox-ide produced by nitrification, Glob. Change Biol., 18, 356–370, https://doi.org/10.1111/j.1365-2486.2011.02547.x, 2012. Snider, D. M., Venkiteswaran, J. J., Schiff, S. L., and
Spoel-stra, J.: A new mechanistic model of δ18O-N2O formation
by denitrification, Geochim. Cosmochim. Ac., 112, 102–115, https://doi.org/10.1016/j.gca.2013.03.003, 2013.
Sutka, R. L., Ostrom, N. E., Ostrom, P. H., Gandhi, H., and Breznak, J. A.: Nitrogen isotopomer site preference of N2O produced by Nitrosomonas europaea and
Methylococ-cus capsulatus Bath, Rapid Commun. Mass Sp., 17, 738–745, https://doi.org/10.1002/rcm.968, 2003.
Sutka, R. L., Ostrom, N. E., Ostrom, P. H., Gandhi, H., and Breznak, J. A.: Nitrogen isotopomer site preference of N2O
produced by Nitrosomonas europaea and Methylococcus cap-sulatus Bath, Rapid Commun. Mass Sp., 18, 1411–1412, https://doi.org/10.1002/rcm.1482, 2004.
Sutka, R. L., Ostrom, N. E., Ostrom, P. H., Breznak, J. A., Pitt, A. J., Li, F., and Gandhi, H.: Distinguishing nitrous oxide pro-duction from nitrification and denitrification on the basis of isotopomer abundances, Appl. Environ. Microb., 72, 638–644, https://doi.org/10.1128/AEM.72.1.638-644.2006, 2006. Sutka, R. L., Adams, G. C., Ostrom, N. E., and Ostrom, P.
H.: Isotopologue fractionation during N2O production by fun-gal denitrification, Rapid Commun. Mass Sp., 22, 3989–3996, https://doi.org/10.1002/rcm.3820, 2008.
Tanaka, H. and Dunn, I. J.: Kinetics of biofilm
ni-trification, Biotechnol. Bioeng., 24, 669–689,
https://doi.org/10.1002/bit.260240311, 1982.
Terada, A., Sugawara, S., Hojo, K., Takeuchi, Y., Riya, S., Harper, W. F., Yamamoto, T., Kuroiwa, M., Isobe, K., Katsuyama, C., Suwa, Y., Koba, K., and Hosomi, M.: Hybrid nitrous oxide pro-duction from a partial nitrifying bioreactor: hydroxylamine in-teractions with nitrite, Environ. Sci. Technol., 51, 2748–2756, https://doi.org/10.1021/acs.est.6b05521, 2017.
Todt, D. and Dörsch, P.: Mechanism leading to N2O production in
wastewater treating biofilm systems, Rev. Environ. Sci. Bio., 15, 355–378, https://doi.org/10.1007/s11157-016-9401-2, 2016. Toyoda, S., Suzuki, Y., Hattori, S., Yamada, K., Fujii, A., Yoshida,
N., Kouno, R., Murayama, K., and Shiomi, H.: Isotopomer analy-sis of production and consumption mechanisms of N2O and CH4
in an advanced wastewater treatment system, Environ. Sci. Tech-nol., 45, 917–922, https://doi.org/10.1021/es102985u, 2011. Toyoda, S., Yoshida, N., and Koba, K.: Isotopocule
anal-ysis of biologically produced nitrous oxide in vari-ous environments, Mass Spectrom. Rev., 36, 135–160, https://doi.org/10.1002/mas.21459, 2017.
Tumendelger, A., Toyoda, S., and Yoshida, N.: Isotopic analysis of N2O produced in a conventional wastewater treatment system operated under different aeration conditions, Rapid Commun. Mass Sp., 28, 1883–1892, https://doi.org/10.1002/rcm.6973, 2014.
Tumendelger, A., Toyoda, S., Yoshida, N., Shiomi, H., and Kouno, R.: Isotopocule characterization of N2O
dy-namics during simulated wastewater treatment under
oxic and anoxic conditions, Geochem. J., 50, 105–121, https://doi.org/10.2343/geochemj.2.0390, 2016.
United Nations, Department of Economic and Social Af-fairs, Population Division: World Urbanization Prospects
2018: Highlights (ST/ESA/SER.A/421), New York,
https://doi.org/10.18356/6255ead2-en, 2019.
Vieten, B., Blunier, T., Neftel, A., Alewell, C., and Conen, F.: Frac-tionation factors for stable isotopes of N and O during N2O
re-duction in soil depend on reaction rate constant, Rapid Commun. Mass Sp., 21, 846–850, https://doi.org/10.1002/rcm.2915, 2007. Webster, E. A. and Hopkins, D. W.: Nitrogen and oxygen isotope ratios of nitrous oxide emitted from soil and produced by nitri-fying and denitrinitri-fying bacteria, Biol. Fert. Soils, 22, 326–330, https://doi.org/10.1007/BF00334577, 1996.
Wunderlin, P., Mohn, J., Joss, A., Emmenegger, L., and Siegrist, H.: Mechanisms of N2O production in biological wastewater
treat-ment under nitrifying and denitrifying conditions, Water Resour., 46, 1027–1037, https://doi.org/10.1016/j.watres.2011.11.080, 2012.
Wunderlin, P., Lehmann, M. F., Siegrist, H., Tuzson, B., Joss, A., Emmenegger, L., and Mohn, J.: Isotope signatures of N2O in a mixed microbial population system: Constraints on N2O
produc-ing pathways in wastewater treatment, Environ. Sci. Technol., 47, 1339–1348, https://doi.org/10.1021/es303174x, 2013.
Yamagishi, H., Westley, M. B., Popp, B. N., Toyoda, S., Yoshida, N., Watanabe, S., Koba, K., and Yamanaka, Y.: Role of nitrifica-tion and denitrificanitrifica-tion on the nitrous oxide cycle in the eastern tropical North Pacific and Gulf of California, J. Geophys. Res., 112, G02015, https://doi.org/10.1029/2006JG000227, 2007. Yamazaki, T., Hozuki, T., Arai, K., Toyoda, S., Koba, K., Fujiwara,
T., and Yoshida, N.: Isotopomeric characterization of nitrous oxide produced by reaction of enzymes extracted from nitrify-ing and denitrifynitrify-ing bacteria, Biogeosciences, 11, 2679–2689, https://doi.org/10.5194/bg-11-2679-2014, 2014.
Yoshida, N.:15N-depleted N2O as a product of nitrification, Nature,
335, 528–529, https://doi.org/10.1038/335528a0, 1988. Zhang, L., Altabet, M. A., Wu, T. X., and Hadas, O.: Sensitive
measurement of NH+4 15N/14N (δ15NH+4) at natural abundance levels in fresh and saltwaters, Anal. Chem., 79, 5297–5303, https://doi.org/10.1021/Ac070106d, 2007.