Publisher’s version / Version de l'éditeur:
Journal of Membrane Science, 120, 2, pp. 273-285, 1996-11-13
READ THESE TERMS AND CONDITIONS CAREFULLY BEFORE USING THIS WEBSITE.
https://nrc-publications.canada.ca/eng/copyright
Vous avez des questions? Nous pouvons vous aider. Pour communiquer directement avec un auteur, consultez la première page de la revue dans laquelle son article a été publié afin de trouver ses coordonnées. Si vous n’arrivez pas à les repérer, communiquez avec nous à [email protected].
Questions? Contact the NRC Publications Archive team at
[email protected]. If you wish to email the authors directly, please see the first page of the publication for their contact information.
NRC Publications Archive
Archives des publications du CNRC
This publication could be one of several versions: author’s original, accepted manuscript or the publisher’s version. / La version de cette publication peut être l’une des suivantes : la version prépublication de l’auteur, la version acceptée du manuscrit ou la version de l’éditeur.
For the publisher’s version, please access the DOI link below./ Pour consulter la version de l’éditeur, utilisez le lien DOI ci-dessous.
https://doi.org/10.1016/0376-7388(96)00151-2
Access and use of this website and the material on it are subject to the Terms and Conditions set forth at
Membrane performance with a pulp mill effluent: relative contributions
of fouling mechanisms
Dal-Cin, M. M.; McLellan, F.; Striez, C. N.; Tam, C. M.; Tweddle, T. A.;
Kumar, A.
https://publications-cnrc.canada.ca/fra/droits
L’accès à ce site Web et l’utilisation de son contenu sont assujettis aux conditions présentées dans le site
LISEZ CES CONDITIONS ATTENTIVEMENT AVANT D’UTILISER CE SITE WEB.
NRC Publications Record / Notice d'Archives des publications de CNRC:
https://nrc-publications.canada.ca/eng/view/object/?id=de939eca-d2f2-4e7f-b963-32c20b6824de https://publications-cnrc.canada.ca/fra/voir/objet/?id=de939eca-d2f2-4e7f-b963-32c20b6824de
j o u r n a l of M E M B R A N E
S C I E N C E
E L S E V I E R Journal of Membrane Science 120 (1996) 273-285
Membrane performance with a pulp mill effluent: Relative
contributions of fouling mechanisms 1
M . M . D a l - C i n a,*, F. M c L e l l a n b C.N. Striez a C . M . T a m a T . A . T w e d d l e a
A. K u m a r a
a Institute for Encironmental Research and Technology, National Research Council of Canada, Ottawa, Canada, K1A OR6 b Abitibi-Price, Sheridan Park Technology Center. Mississauga, Ontario, Canada, L5K 1A9
Received 31 July 1995; accepted l0 May 1996
Abstract
Severe flux decline was observed during ultrafiltration of a pulp mill effluent. Membrane fouling was the result of varying combinations of adsorption, pore plugging and concentration polarization or gel layer formation. A wide range of membrane materials and pore sizes were evaluated, showing the relationship between the membrane material, pore size and the relative contribution of the different fouling mechanisms. Individual resistances were evaluated for adsorption, Ra, pore
plugging, Rpp, and concentration polarization, Rcp, using a series resistance model. These were based on the pure water flux for (1) the new membrane, Ji, (2) after static adsorption with the mill effluent, Ja, (3) the product rate when ultrafiltering the effluent, Jr, and (4) the pure water permeability with the fouled membrane,
,If.
These resistances were shown to be misleading in terms of the observed flux loss for cases with significant adsorptive fouling. Adsorptive fouling was underestimated and concentration polarization overestimated. An alternative method, which we shall call flux loss ratios, is proposed, which is based on the flux decline due to a particular mechanisms as a fraction of the overall flux decline. These new measures more accurately reflect the flux decline attributable to each fouling mechanism.Keywords: Concentration polarization; Fouling; Ultrafiltration; Pulp mill waste; Series resistance
1. Introduction
New and cost effective technologies are required for the treatment of effluents from the pulp and paper industries. Mills have sought to comply with new regulations by reducing waste generation via process modifications or moving towards mill clo- sure [1]. A brief review of large scale membrane
* Corresponding author.
1 Issued as NRCC no. 37611.
applications in the pulp and paper industries is given by J~nsson and Wimmerstedt [2]. Their implementa- tion in this and other industries has not realized it's full potential. This has largely been due to problems associated with fouling resulting in larger membrane surface areas and shorter membrane lifetimes leading to higher installation and operating costs.
Membrane flux decline observed during perme- ation is the cumulative effect of several mechanisms. These include adsorption, pore plugging [3], steric [4] and viscosity effects, concentration polarization [5,6] and gel layer formation. Flux decline due to
0376-7388/96/$15.00 Copyright © 1996 Government of Canada. Published by Elsevier Science B.V. PII S 0 3 7 6 - 7 3 8 8 ( 9 6 ) 0 0 1 5 I - 2
274 M.M. Dal-Cin et al./ Journal of Membrane Science 120 (1996) 273-285
adsorption can occur in a very short time frame, < 3 h, the extent of which is determined by the mem- brane material and solute(s) interactions. The degree of pore plugging is determined by the relative size of the solute and pore as well as the operating condi- tions. Concentration polarization is the formation of a concentration gradient of solutes established at the membrane surface due to the preferential transport of solvent through the membrane. The higher solute concentration at the surface results in a higher os- motic pressure, thereby reducing the effective driv- ing force. This concentration gradient can be estab- lished within minutes [7]. Polarization of higher molecular weight solutes can result in gel layer formation [5]. The gel layer presents an additional hydraulic resistance and may become the dominant separating mechanism [8]. The gel forming potential of iignins in pulp mill effluents has been discussed by Rarnamurthy et al. [9] and Woerner and Mc- Carthy [10,11].
Minimization of membrane fouling is essential to make membrane processes economically competitive in applications where there is little cost recovery (i.e. pollution abatement). Any attempt to minimize foul- ing requires an understanding of the causes and their relative contribution. Understanding the fouling mechanisms allows one to make informed decisions and take appropriate action. For example, if adsorp- tive fouling is primarily responsible for the observed flux loss there is little benefit to improving the mass transfer.
A series resistance model was used to quantify the relative contributions of adsorption, pore plugging and concentration polarization to flux decline. The conventional resistance model was found to be a misleading indicator of the flux loss due to each of these mechanisms. Relative flux loss ratios (FLR) were proposed as an alternative measure. The rela- tive FLRs, D~, were assigned a fraction of the overall fouling resistance. This fraction was deter- mined by the ratio of the flux loss due to a particular mechanism to the overall flux decline. The waste stream was the plug screw feeder pressate (PSFP) from a semichemical mechanical pulp (SCMP) di- gester. A membrane selection criteria was developed based on the different fouling contributions and was related to the membrane material properties, pore size and operating conditions.
2. Theory
2.1. Flux models
The basic model used to describe transport across a porous barrier relates the permeation rate, Jv, to the driving force, A p , fluid viscosity /z and a resis- tance term, R:
A p
Jv - ( 1 )
tzR
In the case of flow through a membrane, the driving force and the flow resistance can be modified due to the occurrence of concentration polarization and fouling. Various flux models have been used to describe the effect of the feed osmotic pressure and contributions of the different fouling mechanisms. The osmotic pressure-adsorption model (OPA) of Ko et al. [6] describes the flux decline due to mem- brane fouling and the polarized layer:
A P - o'~
Jv (2)
/,./, ( R m - ¥ g a )
where ~- is the osmotic pressure, cr is the reflection coefficient and R m and R a are the hydraulic resis- tances due to the membrane and adsorptive fouling respectively. The resistance boundary layer (RBL) model describes the polarized solute layer as an additive serial resistance, RRBL:
A p
Jv = (3)
/z( R m + RRB L)
Wijmans et al. [12] have shown that the osmotic pressure model is equivalent to the RBL model under certain assumptions. Purely series resistance models represent both the fouling and polarization flux declines as serial resistances [3,8,13-15] and have the form:
A P
Jv = , (4)
.(.m+ /
The resistances R i can be attributed to various fouling or flux decline mechanisms, yielding a flux model of the form:
zIP
M.M. Dal-Cin et al. / Journal of Membrane Science 120 (1996) 273-285 2 7 5
where R~,
Rpp
andRcp refer
to adsorptive fouling, pore plugging and concentration polarization or gel layer formation, respectively. A model of this form was used to evaluate the relative contributions of each fouling mechanism during ultrafiltration of PSFP.We have chosen to use a purely phenomenologi- cal model such as Eq. (5) because detailed informa- tion on the osmotic pressure of a complex mixture such as PSFP was not available. Series resistance flux models were also used by Belfort et al. for ultrafiltration of cell culture media [3]. Pouliot et al. [14] used a series resistance model similar to Eq. (5) but called
Rpp and Rcp
irreversible and reversible fouling resistances.A disadvantage of series resistance models is that they account for osmotic pressure and gel formation in the same manner, as an additive resistance. The former represents a flux decline due to a reduction in the driving force while the later represents a hy- draulic resistance to flow. The model is insensitive to the actual mechanism but still provides information on the contribution of either mechanism to flux decline. The lack of physical data and possibility of both osmotic pressure effects or gel layer formation supports the use of Eq. (5).
2.2. Evaluation of resistances
The serial resistances due to each fouling mecha- nism are calculated from the flux loss under different operating conditions. The following fluxes were measured:
• J~ the pure water flux for a new membrane Ja the pure water flux for a membrane which has been fouled by static adsorption
• Jf the pure water flux for a membrane which has been fouled by permeation of the actual PSFP effluent
Jv the flux with PSFP under a given set of operating conditions
The flux loss between Ji and Ja is attributable to adsorptive fouling. Pore plugging accounts for the difference between Jf and J,. The difference be- tween
Jv
and J~ represents the flux loss due to polarization effects.The pure water permeability (Ji) is used to evalu- ate R m for a new membrane using Eq. (1). The
additive resistance due to adsorptive fouling can be determined from the ratio of Ji and Ja:
J i R m -I- R a
Ja R~ (6)
from which
The permeate viscosity is constant since the fluxes are based on the permeation of pure water.
The R~ term is based on the pure water perme- ation rate after contacting the membrane with the feed material, Ja, in the absence of a transmembrane pressure. The contribution of
R a
may be underesti- mated by this procedure as adsorption is evaluated at the bulk concentration. The higher concentration at the membrane surface as a result of concentration polarization may also lead to greater adsorption. Adsorption at the membrane surface/pore entrance may prevent further adsorption within the membrane, as suggested by Brink et al. [16]. There is also a potential for more adsorption during permeation when adsorbants have access to the internal pore structure. In these situations, the added resistance due to pore plugging would be overestimated as it would include some additional resistance due to adsorption. The procedure outlined above is preferred due to the susceptibility of high MWCO membranes to pore plugging with PSFP.The remaining resistances can be calculated se- quentially in a similar fashion:
(Ji )
Rpp= ~ - 1 R ~ - R ~ (S)
RcP = 7,' - 1 R m - R a - R p p ( 9 )
using the resistance terms determined in the previous step and assuming that differences in the permeate and pure water viscosities are negligible in determin- ing R~p.
The serial resistances attributed to each fouling mechanism are dependent on the experimental proce- dure and operating conditions. For example, material deposited on the membrane surface was removed using only recirculating water, the membrane surface
276 M.M. Dal-Cin et al. / Journal of Membrane Science 120 (1996) 273-285
was not physically or chemically cleaned. The pore plugging resistance may be overestimated if any surface deposits were not removed.
The Rpp and Rcp terms are expected to be a function of the operating conditions, namely the transmembrane pressure (TMP), cross flow velocity (CFV) and temperature. The absolute resistance of the membrane, Rm, is assumed to be constant after an initial 5 h precompression with reverse osmosis (RO) treated water. The adsorptive fouling resis- tance, Ra, may be a weak function of the TMP and CFV and a stronger function of pH, temperature and other variables. The TMP can be expected to have a strong effect on Rpp and Rcp while the CFV would influence R~p.
The relative resistance of each component is often expressed as a function of the total resistance:
R m R a Rpp %Rm= R---~' % R a = R---~' %Rpp= R t
(10)
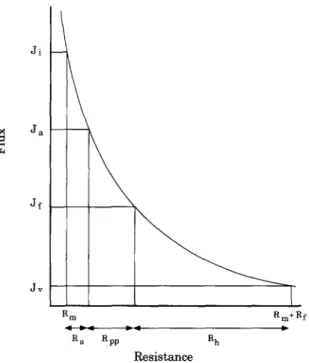
and %Rcp = Rt Ji Ja Jf Jv Rm Rm+R f ~RV a ~ Rpp ~ R h ID ResistanceFig. 1. Flux as a function of the total resistance. A constant flux decline is assumed due to each fouling mechanism. The additive resistance of each mechanism is not proportional to the flux decline.
The values for the resistance terms depend, of course, on the membrane and the degree of fouling. They also depend on the order of numerical calcula- tion and are determined by the experimental proce- dure. This is shown schematically in Fig. 1. The curved line represents the inverse relationship be- tween the flux and total hydraulic resistance. A hypothetical example is used where adsorption, pore plugging and concentration polarization are responsi- ble for the same absolute flux loss. The R a term is relatively small compared to both Rpp and Rcp, even though the observed flux loss was equivalent for each mechanism. The inferences made based on these relative resistances can be misleading under certain conditions. Examples will be presented in the results section highlighting the different cases that can be encountered.
2.3. Fouling contributions based on flux loss ratios
We suggest an alternative approach, using flux loss ratios, to estimate the relative contributions of the fouling mechanisms. The FLR's are based on the
ratio of the absolute flux decline for a given mecha- nism to the overall flux loss. The adsorptive FLR is calculated as
J i - Ja
D a = R f X - - (11)
gv
The remaining relative fouling terms are deter- mined in a similar manner:
ga--gl
Dpp = Rf X J i - g---~ (12)
J f - J v
Dcp = R e X J i - J---~ ( 1 3 )
The overall fouling resistance is obtained from:
Ji Rm + Rf Rf
- - = - - 1 + - - ( 1 4 )
Jv Rm Rm
in which the permeate and pure water viscosity are assumed equal. As with the serial resistances, it is useful to compare the FLRs to the overall resistance,
define the relative RFLs (from this point
J i
R t. We can
on the RFL are relative RFLs) as:
gm D~
%D m
= x 100, %D, = - - X 100, RI Rt Dpp Dcp = = × lOO ( 1 5 ) %Dpp Rt × 100, and %Dcp RtThe flux loss ratios are not the serial resistances normally associated with the series resistance model in Eq. (5). However, the flux loss ratios can be expressed as a function of the resistances determined with, Eqs. (7), (8) and (9). The denominator in Eqs. (11), (12) and (13) can be written as:
' t
J i - -Jv
= /z R m R m + RfAP
R f = (16) /x Rm(R m + Rf)from which Eq. (1 l) can be written as:
AP ( 1
1
) tx Rm( Rm + Rf)
D a = & - -
tx R m R m + R a A P R f ( R m + R f )-Ra(Rm +Ra)
(17)Rm( Rm W gf)
Dpp=Rpp(Rm +Ra)(R,n_l_Ra_FRpp)
(18) Rm DcP = RcP ( e m+ R~ + Rpp)
(19)The flux loss ratios are compared to the serial resistances in Fig. 2. When the absolute flux loss is equal for each of the three fouling mechanisms, the flux loss terms, D~, are also equal. This is equivalent to transforming the inverse relationship between flux and pressure into a straight line with a negative slope determined by the end points (Ji, Rm) and ( J r , Rt). The flux loss ratios make simultaneous use of all the available information regarding fouling due to each mechanism. The discrepancy between the two meth- ods is greatest when there is significant adsorptive fouling. The series resistance model can grossly underpredict the significance of adsorption. Experi- mental and theoretical results will be used to illus- trate this in the Results and Discussion.
,If J a
2
J v
: : F ~
M.M. Dal-Cin et al. / Journal of Membrane Science 120 (1996) 273-285 277
R m Rm+R f
R a Rpp R h
D a Dpp D h
Resistance
Fig. 2. C o m p a r i s o n b e t w e e n resistances obtained b a s e d on the series resistance model ( R i) a n d flux loss ratios (Di).
The fouling resistance terms are not independent. Reducing or eliminating one of the resistances does not imply a proportional change in flux. As an example, the flux of a given membrane has a high Ji but has significant fouling by adsorption, accounting for a flux loss of 90%. The membrane and solute interactions are then reduced by either changing the solute properties or modifying the membrane (without changing Rm). The flux loss by adsorptive fouling for this system is now negligible. However, Jv will not increase by the amount recovered with the lower adsorptive fouling. The solute transport to the sur- face will be larger and a greater flux loss due to concentration polarization would be expected. The extent to which this occurs depends on how close the system is to the limiting flux.
The flux loss ratios and series resistances are both evaluated for a fixed set of operating conditions. The values of the % D i or
%R i
terms will change as the operating conditions are varied. An illustrative exam- ple would be one where the transmembrane pressure was varied. We shall assume that there is no adsorp- tion or pore plugging occurring. At a low pressures,278 M.M. Dal-Cin et al. / Journal of Membrane Science 120 (1996) 273-285 concentration polarization is minimal and Jv = Ji. In
this case %D m dominates. As the pressure is in- creased the limiting flux is reached through either osmotic pressure effects or gel formation. Jv is now considerably lower than Ji at the same pressure and %Dcp dominates over %D m. Changing the shear rate can affect the contribution of the remaining flux loss ratios. Reducing the shear can increase %Dcp caus- ing a reduction of %D~ and %Dpp. The flux loss ratios can be used to qualitatively predict changes in flux under different operating conditions, as with the conventional series resistance model. When %Dcp dominates, increasing the shear rate will increase Jv, reducing % D c p a n d increasing %D a a n d / o r /)pp.
3. Experimental
3.1. Materials
The feed material used in this work was the plug screw feeder pressate (PSFP) from an SCMP pulp mill. Samples of PSFP were taken during regular operation of the pulp mill and refrigerated at 2°C until tested. The feed was used as received except for prescreening with a 400 mesh to remove large fibres. Non-screened PSFP contains much larger particles including wood fibres up to 1-10 mrn in length. A summary of the constituents is given in Table 1.
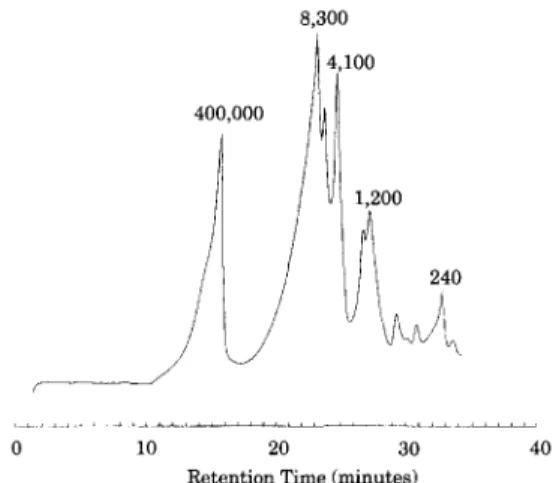
The particle sizes covered a broad range from 0.1 to 20-60 ~ m as determined by dynamic light scat- tering (Granulometer HR 850 and Malvern Zetasizer 3). The upper limit was set by the pre-screening which is equivalent to ~ 37 /xm. The molecular weight distribution of soluble PSFP components, as determined by GPC, ranges from ~ 4.0 X 10 6 tO
< 100 Da, Fig. 3. Sugars, polysaccharides, soluble and insoluble lignins are major components and ac- count for the wide molecular weight distribution and
8,300 U00 400 000 f - - - -0
/
1,200 10 20 30 40Retention Time (minutes)
Fig. 3. Molecular weight distribution of PSFP as determined by GPC. Molecular weight is shown for selected peaks.
high total organic carbon (TOC) of this effluent. Attempts to synthesize PSFP using pure components were not successful. Permeation experiments corre- lated poorly with the actual feed [17], prompting this course to be abandoned.
The membranes used represent a broad range of materials and pore sizes. Materials included polyvinylideneflouride (PVDF), polyacrylonitrile (PAN), polysulfones (PS), polyether-imide (PEI), polyamide-imide (PAI), cellulosics and several thin film composites (TFC). Molecular weight cut offs (MWCO) ranged from nanofiltration (300 Da) to the upper limit of ultrafiltration ( > 500 KDa). Mem- branes were procured from commercial sources or manufactured in our laboratory using an automated casting machine [18].
3.2. Procedures
Ultrafiltration and pure water permeability mea- surements were performed using thin channel flat sheet test cells and have been described elsewhere
Table 1
Composition of PSFP, 100 mesh filtrate
pH Conductivity ~ DS b SS c TOC d B O D e RFA f Lignin Lignin Volatile Sugars
( p, g2) (mg/1) (mg/1) ( m g / l ) (mg/1) (mg/1) sol insol acids g ( m g / l )
(mg/1) ( m g / l ) (mg/1)
5.7 5100 12600 1700 5670 5250 432 2400 1900 920 2680
a Electrical conductivity, b Dissolved solids, c Suspended solids, o Total organic carbon, e Biological oxygen demand, f Resin and fatty acids, g Primarily acetic acid.
M.M. DaI-Cin et al. / Journal of Membrane Science 120 (1996) 273-285 279 N e w M e m b r a n e ]
]
Static Adsorption II
P e r m e a t i o n T e s t II
Ji A d s o r p t i o n ,. Ja . . . Jv , Pore plugging ,, Polarization/gel/cake ,,I
U s e d M e m b r a n e ' ~ J f . . .I
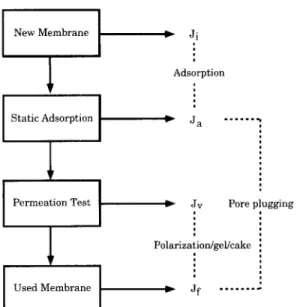
Fig. 4. Test sequence for evaluating Ji, Ja, Jf and J~.
[19]. The cells are circular with a impinging feed at the center of the membrane, promoting mixing at the membrane surface beyond that expected at the mean cross flow velocity of 0.8 m / s (NR~ = 800). The effective permeation area is 14.5 × 10 -4 m 2. Perme- ation with PSFP was performed at 345 kPa (50 psi) and 50°C.
The testing procedure is summarized in Fig. 4 and required the determination of four fluxes.
Ji New membranes were permeated with RO water, for 5 h at 345 kPa and 25°C after which the J~ and retention of a 6K PEG test solute were deter- mined.
J, Groups of 12 membrane coupons were then contacted with 500 ml of PSFP in the absence of a transmembrane pressure at 50°C for 3 h with gentle stirring at 1 h intervals. Coupons were thoroughly rinsed (not physically cleaned), returned to the test cells and the J, and 6K PEG retention re-evaluated. J,, Preheated PSFP (50°C) was then ultrafiltered at 345 kPa for 3 h with the permeate recycled to the feed. The product rate was measured at 1 and 3 h. J~ at 3 h was used to calculate the fouling resistances and flux loss ratios.
Jt The PSFP was replaced with RO water and run for a minimum of 1 h with at least two water exchanges. Membranes were left in contact with water with no TMP overnight. The Jf and 6K PEG
retention were evaluated the following day after permeation with fresh RO water for 2 h.
4. Results and discussion
4.1. Intermediate pure water fluxes and product rates
Plots of the J J J i , J t / J i and J v / J i ratios as a function of J~ were used to determine the signifi- cance of the different fouling mechanisms. Usually one would use the pore size on the ordinate axis. Accurate pore size (or MWCO) evaluation for open membranes is difficult to obtain and is highly depen- dent on the solute/test conditions. These types of membranes are usually quoted in terms of 100K, 300K, 500K M W C O or 0.1 /zm by manufacturers. This resulted in discretized data which made any plot with M W C O as an axis difficult to read. The mem- brane's J~ was used in place of the M W C O which allowed an approximate, but continuous, representa- tion of membrane performance.
Figs. 5 - 7 show the flux loss due to adsorption, pore plugging and concentration polarization effects, respectively. The J J J i vs. Ji plot in Fig. 5 shows
1 2 0 % , i i 1 0 0 % i i • i i • I • 8 0 % + % o i • i 6 0 % ] * I 4 0 %
I"
t :~ • o 20% i~ ,?" : c~ i 0 5 0 0 1 0 0 0 1 5 0 0 2 0 0 0 Ji (LMH)Fig. 5. J~/Ji vs. Ji for various membrane materials•
• CELLULOSICS 1 TFC • MOD PVDF ~ p-v~D F ~' • PAN : PAI • PE] PS
280 M.M. Dal-Cin et al. / Journal of Membrane Science 120 (1996) 273-285
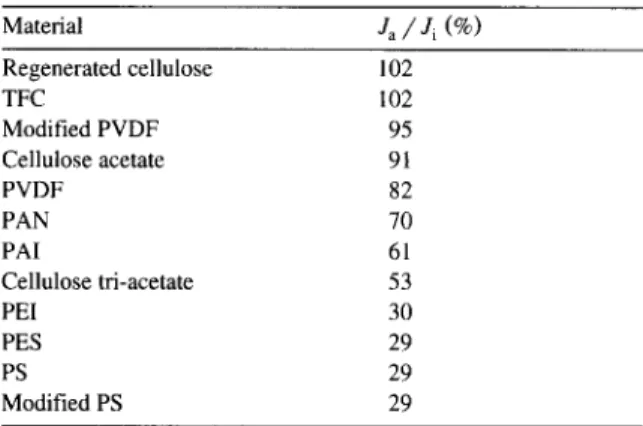
Table 2
J ~ / J i ratios after static adsorption tests for various membrane materials M a t e r i a l J~ / J i ( % ) Regenerated cellulose 102 TFC 102 Modified PVDF 95 Cellulose acetate 91 PVDF 82 PAN 70 PAI 61 Cellulose tri-acetate 53 PEI 30 PES 29 PS 29 Modified PS 29
the loss due to adsorptive fouling. Despite the vari- ability within a class of materials, the overall trends, summarized in Table 2, followed trends observed with protein fouling [6,8]. Polysulfones exhibited severe fouling while regenerated cellulose mem- branes and some TFCs showed little or no fouling. Hydrophobic materials such as polyetherimide, poly- sulfones exhibited similar behaviour as reported with proteins [20] with large reductions of the pure water flux. Commercial modified polysulfones developed for protein applications were also prone to severe adsorptive fouling. A detailed discussion of adsorp- tive fouling with PSFP is available elsewhere [21].
The lower
Jt,/Ji
ratios in Fig. 6, compared toJa/Ji
indicate further fouling. This is due to pore plugging after permeation with PSFP, in addition to adsorption. In particular it can be seen that mem- branes with high MWCOs (high Ji) are susceptible to pore plugging regardless of the membrane mate-rial. The higher the MWCO, the lower the
Je/Ji
ratio. Finally, the
Jv/Ji
vs. Ji plot in Fig. 7 showsflux losses due to the cumulative effect of all the fouling mechanisms. Very few membranes have high
v a l u e s o f J ~ / J i a n d t h e s e are m o s t l y r e g e n e r a t e d
cellulose and TFC's with lower MWCOs. Following the progression of the flux ratios in Figs. 5 - 7 it can
b e s e e n that t h e m a t e r i a l a s p e c t is i m p o r t a n t to a v o i d
adsorptive fouling and that high MWCO membranes are susceptible to pore plugging. Concentration polarization effects then dominate and prevent high
Jv/Ji
ratios with high MWCO membranes.120% - 1 0 0 % i • 8O% 6O% -, OELL~OS,C2 ,± T F C I * MOD P V D F I o P V D F • p A N a PAI • PEI c PS • am • - - - u • o o 4 0 % -~- o o £ o a o o 2 0 % o o o 53 o o • •m • o © o o © o * " o ~ . ~ o a • s o 0% ~ ~ ~ t ... I ¢ - I 0 5 0 0 1 0 0 0 1 5 0 0 2 0 0 0 J i (LMH) F i g . 6. Jf / Ji v s . Ji f o r v a r i o u s m e m b r a n e m a t e r i a l s .
The contributions of the various mechanisms can be more clearly seen by examining membranes made from the same material but of different pore sizes. The first example in Fig. 8 shows the intermediate
1 0 0 % 9 0 % 8 0 % 7 0 % 6O% ~-~> 5 0 % 40% 30% 20% 10% o d % l a o o, 8 o % 500 i000 1500 J i (LMH)
Fig. 7. Jv / Ji v s . Ji for various membrane materials.
• CELLULOSICS [] TFC • M O D P V D F o P V D F • P A N A PAl • PEI o PS 2000
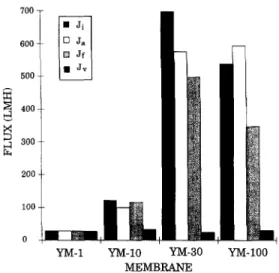
M.M. Dal-Cin et al. / Journal of Membrane Science 120 (1996) 273-285 281 700-- 600- 5O0 ~ 400 300 200 i00 0
YM-1 YM-10 YM-30 YM-100 M E M B R A N E
Fig. 8. Intermediate fluxes for YM regenerated cellulose mem- brane series.
fluxes for a range of YM series regenerated cellulose membranes. The appended number indicates the rated MWCO in 1000's. Each bar represents Ji, Ja,
Jf
and Jr, respectively.Ja ~ Ji indicates that there was minimal adsorp- tive fouling with the YM-1. Negligible pore plugging was indicated by Jf ~ Ji and can be attributed to the small pore size of this membrane. There was also minimal flux decline due to concentration polariza- tion, as a result of the low Ji for this membrane. Little flux loss due to adsorption or pore plugging was observed with the YM-10. There was, however, a significant loss due to concentration polarization effects, attributable to the higher J~. Pore plugging has begun to play a significant role with the YM-30 and concentration polarization was responsible for an increasing flux decline. The YM-100 showed further losses due to pore plugging and concentration polar- ization. This membrane was tested at 69 kPa whereas the others were tested at 345 kPa. Had it been tested at the higher pressure, losses due to pore plugging would have undoubtedly been greater. It is also important to note that despite the widely varying Ji's the actual product rate observed with PSFP was similar for all four membranes suggesting that the limiting flux had been obtained for these operating conditions.
The previous example dealt with a membrane material exhibiting very low, if not negligible, ad-
sorptive fouling. At the opposite extreme is polysul- fone which strongly adsorbs components of PSFP. Fig. 9 shows the different contributions to flux de- cline with a series of Victrex polyethersulfone mem- branes of increasing MWCO, as indicated by the increasing J~. Adsorption played a significant role in all the membranes, although it decreased as the pore size increased. It was concluded that surface adsorp- tion was likely for lower MWCO membranes and that the adsorbed layer was controlling membrane performance. Adsorption occurred via a pore restric- tion mechanism with higher MWCO membranes [21 ]. Pore plugging was a more important factor with the open membranes, as was concentration polariza- tion. Concentration polarization was not a factor for the small pore sizes. The flux through all but the most open membranes was not high enough to estab- lish a significant concentration gradient at the mem- brane surface. Unlike the YM series, the product rate with PSFP was more dependent on the initial pore size. The effect of adsorption on the polysulfone membranes was similar to shifting the effective pore size downward compared to the regenerated cellu- lose membranes.
These figures are useful for analysing results but are too cumbersome when considering a large num- ber of membranes. Using a series resistance model allows a large amount of data to be quantified and tabulated. This facilitates identifying trends in mem- brane performance with respect to materials, pore sizes and test conditions.
800 700 600 500 400 300 20O 100 0 V221 V205 V226 V222 V213 M E M B R A N E
282 M.M. Dal-Cin et al. / Journal of Membrane Science 120 (1996) 273-285
Table 3
Flux loss ratios for series of regenerated cellulose and polyethersulfone membranes. %Din, %Da, %Dpp and %D~v are the flux loss ratios due to the membrane, adsorption, pore plugging and concentration polarization, respectively. YM-100 data obtained at 69 kPa (10 psi). All fluxes temperature corrected to 25°C
Membrane Manufacturer Rated MWCO Material %D m %O a %Opp %Ocp
YM-I Amicon 1000 Regenerated cellulose 92 2 0 6
YM-10 10000 26 18 - 13 68 YM-10 30000 3 18 I1 68 YM-100 100000 5 - 10 46 59 V221 NRCC PES 4 76 17 3 V205 8 82 8 2 V226 3 87 7 3 V222 4 83 11 1 V213 4 52 34 9
4.2. Relative flux loss ratios
The relative flux losses (RFL) for the YM and Victrex series are given in Table 3. The same con- clusions are reached regarding the contributions of each fouling mechanism as from Figs. 8 and 9. This is expected as they are derived from the same infor- mation. Small negative resistances ( ~ 10% and smaller) are due to experimental error in measuring fluxes and should be considered negligible. The flux loss ratios or serial resistances obtained in replicate
experiments should not be expected to reproducible to a great extent, given the variability of new mem- brane performance and the permeation experiments in general. Rather the flux loss ratios should be used to identify which, if any, of the three fouling mecha- nisms are important.
The %D a term indicates that adsorptive fouling
was minimal for the YM series.
%Dpp
and %Dcpwere significant with both series of membranes for high MWCOs. The greater pore plugging being at- tributable to the larger pore sizes and concentration
Table 4
Comparison of fouling contributions based on series resistances and flux loss ratios. All fluxes temperature corrected to 25°C
Membrane Type
Flux loss ratios Serial resistances
J i ( L M H ) ,La(LMH) J f ( L M H ) J v ( L M H ) %D m %O a %Dpp %Ocp %R m %R a %Rpp %Rcp YM- 1 CELL 28 28 28 26 93 0 0 7 93 0 0 7 YM-10 CELL 122 100 115 33 27 18 - 1 2 67 27 6 - 4 17 YM-30 CELL 697 575 496 23 3 18 11 68 3 1 1 95 YM-100 CELL 537 593 346 30 5 - 10 46 59 6 - 1 4 91 V221 PES 78 19 6 3 4 76 17 3 4 12 34 50 V205 PES 110 19 11 8 7 83 7 3 7 35 31 27 V226 PES 355 39 28 15 4 89 3 4 4 34 15 47 V222 PES 670 113 36 29 4 83 12 1 4 22 55 19 V213 PES 795 381 109 34 4 52 34 10 4 5 22 69 XM-50 a ACRYLIC 180 60 10 5 3 66 28 3 3 5 42 50 NTU-2120 b OLEFIN 135 129 47 26 19 4 61 16 19 1 35 45 NA 50 c mod PS 762 143 48 23 3 81 13 3 3 13 32 52 LSY PVDI d TFC 47 25 28 29 61 47 - 6 - 2 62 54 - 12 - 4 ART-1 1000 900 800 700 70 10 10 10 70 8 10 12 ART-2 400 300 200 100 25 25 25 25 25 8 17 50 ART-3 1000 3 2 1 0 100 0 0 0 33 17 50
XM-50, Amicon 50000 MWCO. b NTU-2120, Nitto 20000 MWCO. c NA 50, Filtron 50000 MWCO. d LSY PVD1, Hydranautics 92% NaCI.
M.M. Dal-Cin et al. / Journal of Membrane Science 120 (1996) 273-285 283 polarization due to the higher fluxes. The membrane
itself was a minor resistance for the YM-30 and YM-100 membranes.
The relative resistance of the membrane is negli- gible for the entire polyethersulfone series. This is due to adsorptive fouling accounting for the major part of the flux loss. Concentration polarization is a relatively small component of fouling due to the already greatly diminished flux. The Jf for the V213 membrane was 109 LMH ( l / m Z / h ) and the product rate corrected to 25°C was 37 LMH. Concentration polarization effects caused a flux decline of 72 LMH. This flux loss was small compared to the > 400 LMH loss due to adsorption. The loss due to adsorp- tion is unavoidable for this material, while that due to concentration polarization may be minimized. As a comparison, the %D~p for the YM-30 at 68% represents a flux of 473 LMH. There is a greater potential for attaining higher fluxes with this mem- brane under the appropriate conditions.
4.3. Serial resistance L,S..flux loss ratios
The serial resistance and FLR approaches to eval- uating fouling contributions were discussed in Sec- tion 2.2. Several examples comparing the two meth- ods are highlighted in Table 4. The two methods provide similar conclusions regarding the contribu- tion of fouling mechanisms with the 1 and 10 K MWCO YM regenerated cellulose membranes. There is some disagreement between the 30 and 100 K MWCO membranes. The serial resistances underesti- mate the flux loss due to pore plugging and adsorp- tive fouling. The YM-100, in particular, exhibits significant pore plugging. Pore plugging and concen- tration polarization account for flux reductions of 247 and 316 LMH respectively for this membrane. The series resistance model attributes 90% of the flux decline to Rcp. The flux losses are more realisti- cally represented by the flux loss ratios; 46 and 59% of the flux decline to pore plugging and concentra- tion polarization, respectively.
The disagreement between the two methods is considerable for the entire series of polyethersulfone (V series) membranes. The FLR approach indicates adsorptive fouling as being primarily responsible for the flux loss. R~ is greatly underestimated with the sequential method for all these membranes.
The shape of the flux-resistance curve in Fig. 2 shows that a small change in the overall resistance can lead to large changes in flux. Since the adsorp- tive component of the fouling resistance is deter- mined first, it will tend to be underestimated when using the serial resistances. Subsequent flux losses require an increasingly larger change in the overall resistance. The Rcp term will always be overesti- mated unless the relative difference between Jf and Jv is small.
A set of artificial fluxes can be used to illustrate discrepancies between the two methods more clearly. The examples ART-1 and ART-2 have flux declines of 100 LMH attributed to each fouling mechanism. The initial flux for ART-1 and ART-2 are 1000 and 400 LMH, respectively. The FLRs attribute equal importance to each mechanism in both cases while the serial resistances overestimate Rcp. The serial resistance reflects the flux decline from the previous condition. If Jv is one half of Jr, the series resis- tance model will always predict %Rcp at 50%, re- gardless of the other intermediate fluxes. This is a direct consequence of the inverse flux-pressure rela- tionship. An exaggerated case is illustrated by ART-3 where adsorptive fouling reduces the pure water flux from 1000 to 3 LMH. Jf and J~ are 2 and 1 LMH, respectively, and R~p is still 50%. The RFLs de- scribe the fouling behaviour more accurately.
4.4. M e m b r a n e selection criteria
The membrane which will ultimately be selected will be that which has the highest flux for the required separation. Other important considerations will include the membranes compatibility with clean- ing procedures, available configurations, cost, ex- pected lifetime, etc. This may not necessarily agree with the membrane exhibiting desired fouling char- acteristics. A membrane with high fouling and high flux will be selected over a low fouling membrane with low flux, if both perform the required separa- tion. Ultimately, the total cost of implementation will be the final criterion.
Selection of the best membrane from a fouling viewpoint would be one where R m is the dominant term. This type of membrane would be expected to have predictable behaviour in terms of flux stability and separation. Such a membrane would also re-
284 M.M. Dal-Cin et al. / Journal of Membrane Science 120 (1996) 273-285 spond to changes in operating conditions. A minimal
%Dcp term suggests that improved mass transfer at the membrane surface would not be beneficial. Higher fluxes would be obtained by increasing the transmembrane pressure. The new set of operating conditions will change the relative contribution of the fouling mechanisms, increasing %Dcp. Further increases in the transmembrane pressure will eventu- ally result in smaller flux increases as the limiting flux is approached. For an open membrane such as the YM-100 which had significant pore plugging, higher pressures may have increased %Dpp resulting in flux declines which were not reversible. This was also observed with several membranes which were tested under various operating conditions with PSFP. The membrane will no longer have the same surface properties as the original, the foulants now being an integral part of the membrane. This may make them more susceptible to fouling with a feed such as PSFP because it contains resin acids which can promote the formation of a bound layer due to their binding characteristics [9].
5. Conclusions
A sequential approach to membrane testing al- lowed identification of the flux loss due to adsorp- tive fouling, pore plugging and concentration polar- ization with an SCMP pulp mill effluent. A series resistance model or the flux loss ratios (FLR) facili- tated handling large amounts of data and identifying trends in membrane performance with respect to materials, pore sizes and test conditions.
A series resistance model was used to quantify the relative contributions of each fouling mechanism to flux decline. The flux loss ratios are based on the ratio of the flux loss due to each mechanism to the overall flux decline. Flux loss ratios were shown to more accurately describe the flux reduction due to each fouling mechanism. Using experimental and simulated flux data, the series resistance model was shown to underpredict fouling due to adsorption and overpredict concentration polarization.
Understanding the contribution of the fouling mechanisms to flux decline allows selection of the most viable membrane when several choices appear to be suitable based on flux/separation performance.
Selection of an appropriate membrane material will minimize adsorptive fouling while pore plugging is controlled by using a membrane with a suitable MWCO. Adsorptive fouling was severe for PAN, PS, PES, PAI and PEI membranes, typically respon- sible for a loss of 60 to 80% of their pure water permeability. Regenerated cellulose and several thin film composite membranes exhibited very low ad- sorptive fouling. These materials, and regenerated cellulose in particular, have been extensively re- ported in the literature to exhibit low adsorptive fouling with proteins.
Pore plugging was identified by a significant % Dpp term. The wide range of molecular weights of mate- rial in PSFP requires careful selection of the pore size and operating pressure. Pore plugging may be- come more important over long operating times or higher transmembrane pressures resulting in unfore- seen flux decline.
Selection of an appropriate pore size requires consideration of the membrane material and solute interactions. Adsorptive fouling with polysulfone membranes reduced the effective pore size a n d / o r reduced the permeability of the membrane. Obtain- ing similar fluxes with polysulfone and regenerated cellulose membranes required using polysulfone membranes with larger initial MWCOs.
Higher fluxes can be obtained by optimization of the operating conditions or module design. Higher transmembrane pressures would be beneficial with membranes for which %D m dominates and %Dcp is minimal. Increased shear rates would be advanta- geous when %Dcp is large. Little improvement can be obtained if adsorption or pore plugging dominate.
6. List of symbols
CFV cross flow velocity ( m / s )
%D a flux loss ratio due to adsorption ( - )
%Dcp flux loss ratio due to concentration polariza- tion ( - )
%D m flux loss ratio for the membrane ( - ) %Dpp flux loss ratio due to pore plugging ( - ) FLR flux loss ratio
Ja pure water flux after static adsorption (1/m2/h)
M.M. Dal-Cin et al. / Journal of Membrane Science 120 (1996) 273-285 285
J~ pure water flux for a new membrane
(1/m2/h)
Jv flux for a new membrane with PSFP as feed
( 1 / m 2 / h )
LMH flux (1/m2/h)
PSFP plug screw feeder pressate
%R a relative resistance due to adsorption (-) %Rcp relative resistance due to concentration polar-
ization (-)
% R m relative resistance of the membrane (-)
%R0p relative resistance due to pore plugging (-) TMP transmembrane pressure (kPa)
6.1. Greek Symbols A p
/z
77" O"
transmembrane pressure drop ( k g / m / s 2) permeate viscosity ( k g / m / s )
osmotic pressure ( k g / m / s 2) reflection coefficient (-)
Acknowledgements
The authors would like to acknowledge Herv6 Buisson of the Wastewater Treatment Centre for membrane samples. From ICPET: John Woods for molecular weight distributions of PSFP and Eric Chen for performing permeation experiments.
References
[1] M.T. Towers and J.T. Wearing, Closed cycle design, in Technology and Environmental Enhancement in Pulp and Paper Mills, Workshop Proc. no. 3, Technology Develop- ment and Programs Resource Processing Industries Branch, 30-31 March 1994, Ottawa, Canada.
[2] A.-S. J~Snsson and R. Wimmerstedt, The application of mem- brane technology in the pulp and paper industry, Desalina- tion, 53 (1985) 181-196.
[3] G. Belfort, J.M. Pimbley, A. Greiner and K.Y. Chung, Diagnosis of membrane fouling using a rotating annular filter. 1. Cell culture media, J. Membrane Sci., 77 (1993)
1-22.
[4] C.M. Tam and A.Y. Tremblay, Membrane pore characteriza- tion. Comparison between single and multicomponent solute probe techniques, J. Membrane Sci., 57 (1991) 271-287. [5] J.G. Wijmans, S. Nakao and C.A, Smolders, Flux limitation
in ultrafiltration: osmotic pressure model and gel layer model, J. Membrane Sci., 20 (1984) 115-124.
[6] M.K. Ko and J.J. Pellegrino, Determination of osmotic pres- sure and fouling resistances and their effects on performance of ultrafiltration membranes, J. Membrane Sci., 74 (1992) 141-157.
[7] C.W. van Oers, M.A.G. Vorstman, W.G.H.M. Muijselaar and P.J.A.M. Kerkhof, Unsteady-state flux behaviour in rela- tion to the presence of a gel layer, J. Membrane Sci., 73 (1992) 231-246.
[8] S. Nakatsuka and A.S. Michaels, Transport and separation of proteins by ultraflltration through sorptive and non-sorptive membranes, J. Membrane Sci., 69 (1992) 189-211. [9] P. Ramamurthy, R. Poole and J.G. Dorica, Fouling of ultra-
filtration membranes during treatment of CTMP screw press filtrates, J. Pulp Paper Sci., 21(2) (1995) 50-54.
[10] D. Woerner and J.L. McCarthy, Ultrafiltration of Kraft black liquor, AIChE Symp. Ser., 232(80) (1984) 25-33.
[11] D. Woerner and J.L. McCarthy, Ultrafiltration of pulp mill liquors, Tappi J., 70(3) (1987) 126-130.
[12] J.G. Wijmans, S. Nakao, J.W.A. van den Berg, F.R. Toelstra and C.A. Smolders, Hydrodynamic resistance of concentra- tion polarization boundary layers in ultrafiltration, J. Mem- brane Sci., 22 (1985) 117-135.
[13] A.-S. J~Snsson, Influence of shear rate on the flux during ultrafiltration of colloidal substances, J. Membrane Sci., 79 (1993) 93-99.
[14] M. Pouliot, Y. Pouliot, M. Britten and N. Ross, Effects of pH and ionic environment on the permeability and rejective properties of an alumina microfiltration membrane for whey proteins, J. Membrane Sci., 95 (1994) 125-134.
[15] J.-M. La~n& J.P. Hagstrom, M.M. Clark and J. Mallevialle. Effects of ultrafiltration membrane composition. J. AWWA, November (1989) 61-67.
[16] L.E.S. Brink, S.J.G. Elbers, T. Robbertsen and P. Both. The anti-fouling action of polymers preadsorbed on ultrafiltration and microfiltration membranes, J. Membrane Sci., 76 (1993) 281-291.
[17] Unpublished internal work at the Pulp and Paper Research Institute of Canada.
[18] C.M. Tam, M.M. Dal-Cin and M.D. Guiver, Polysulfone membranes IV. Performance evaluation of Radel A / P V P membranes, J. Membrane Sci., 78 (1993) 123-134. [19] J.D. Hazlett, O. Kutowy and T.A. Tweddle, Commercial
ultrafiltration membrane performance evaluation, in M.H.I. Baird and S. Vihayan (Eds.), Proc. 2nd Int. Conf. Separations Science and Technology, Canadian Society for Chemical Engineering, Ottawa, 1989, pp. 65-74.
[20] JH. Hanemaaijer, T. Robbertsen, Th. van den Boomgaard and J.W. Gunnink, Fouling of ultrafiltration membranes. The role of protein adsorption and salt precipitation, Desalination, 68 (1989) 199-217.
[21] M.M. Dal-Cin, C.N. Striez, T.A. Tweddle, F. McLellan and P. Ramamurthy, Effect of adsorptive fouling on membrane performance: Case study with a pulp mill effluent, Desalina- tion, 101 (1995) 155-167.