HAL Id: hal-01363371
https://hal.archives-ouvertes.fr/hal-01363371
Submitted on 9 Sep 2016
HAL is a multi-disciplinary open access
archive for the deposit and dissemination of
sci-entific research documents, whether they are
pub-lished or not. The documents may come from
teaching and research institutions in France or
abroad, or from public or private research centers.
L’archive ouverte pluridisciplinaire HAL, est
destinée au dépôt et à la diffusion de documents
scientifiques de niveau recherche, publiés ou non,
émanant des établissements d’enseignement et de
recherche français ou étrangers, des laboratoires
publics ou privés.
Joint compressive sampling and deconvolution in
ultrasound medical imaging
Zhouye Chen, Adrian Basarab, Denis Kouamé
To cite this version:
Zhouye Chen, Adrian Basarab, Denis Kouamé. Joint compressive sampling and deconvolution in
ultrasound medical imaging. IEEE International Ultrasonics Symposium (IUS 2015), Oct 2015, Taipei,
Taiwan. pp. 1-4. �hal-01363371�
O
pen
A
rchive
T
OULOUSE
A
rchive
O
uverte (
OATAO
)
OATAO is an open access repository that collects the work of Toulouse researchers and
makes it freely available over the web where possible.
This is an author-deposited version published in :
http://oatao.univ-toulouse.fr/
Eprints ID : 15330
The contribution was presented at :
http://ewh.ieee.org/conf/ius/ius_2015/
To cite this version :
Chen, Zhouye and Basarab, Adrian and Kouamé, Denis Joint
compressive sampling and deconvolution in ultrasound medical imaging. (2015) In:
IEEE International Ultrasonics Symposium (IUS 2015), 21 October 2015 - 24
October 2015 (Taipei, Taiwan, Province Of China).
Any correspondence concerning this service should be sent to the repository
administrator:
staff-oatao@listes-diff.inp-toulouse.fr
Joint Compressive Sampling and Deconvolution in
Ultrasound Medical Imaging
Zhouye Chen, Adrian Basarab, Denis Kouam´e
University of Toulouse, IRIT UMR CNRS 5505, Toulouse, France Email: zhouye.chen, adrian.basarab, denis.kouame@irit.fr
Abstract—The interest of compressive sampling and image deconvolution has been extensively explored in the ultrasound imaging literature. The first seeks to reduce the volume of acquired data and/or to accelerate the frame rate. The second aims at improving the ultrasound image quality in terms of spatial resolution, contrast and signal to noise ratio. In this paper, we propose a novel approach combining these two frameworks, resulting into a compressive deconvolution technique aiming at obtaining high quality reconstructions from a reduced number of measurements. The resulting inverse problem is solved by minimizing an objective function taking into account the data attachment term and two appropriate prior information terms adapted to ultrasound imaging.
Index Terms—Compressive sampling, deconvolution, compres-sive deconvolution, image enhancement.
I. INTRODUCTION
This papers introduces a reconstruction technique aiming at recovering enhanced ultrasound (US) images from compressed random measurements.
In the past few years, several research groups evaluated the application of compressive sampling (CS) theory [1, 2] in US imaging. The main motivation of these studies is to decrease the amount of acquired data or to increase the frame rate in 2D or 3D US imaging [3–6] or in Doppler applications [7, 8]. It has been thus shown that the RF data may be recovered using nonlinear optimization techniques from a few random linear measurements based on its sparse representation in basis such as wavelets, waveatoms, 2D Fourier transform or learning dictionaries [9]. However, the quality of the CS recovered RF images is at most equivalent to the one of standard fully-sampled data. Nevertheless, it is well known that the quality of US images is limited by several physical phenomena related to the acquisition setup. In this context, deconvolution-based post-processing methods have been shown to provide interesting contrast and spatial resolution enhancement in US imaging [10–13]. Based on the first order Born approximation, these deconvolution techniques assume that the RF images are the result of a convolution between the tissue reflectivity function and the imaging system point spread function (PSF). In this work, we propose a novel framework in US imaging, aiming to combine CS and deconvolution problems. Named compressive deconvolution [14], our approach has a double objective of jointly decreasing the amount of data and recon-structing better contrasted and resolved images than the usual RF data.
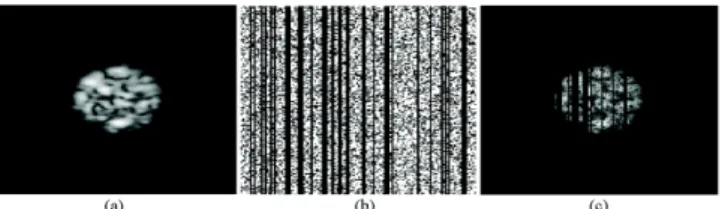
Fig. 1: Example of CS measurements in US imaging. From left to right: the initial US image, the sampling matrix and the random measurement.
The remainder of this papers is organized as follows. After a brief summary of the application of CS and deconvolution in US imaging, we present our method of compressive deconvo-lution in Section III. Next, simulation results are provided and show the interest of our approach in US imaging. Conclusions are finally reported in Section V.
II. BASICS ON COMPRESSIVE SAMPLING AND DECONVOLUTION INUSIMAGING A. Compressive sampling
Let us denote by r ∈ RN a vector obtained after lexico-graphical ordering of an US RF image. The idea behind CS is to recover this RF image fromM linear random measurements (withM << N ) denoted by y ∈ RM:
y = Φr + n (1)
where n ∈ RM is a zero-mean additive white Gaussian noise and Φ ∈ RM ×N is the measurement matrix. Several choices of Φ∈ RM ×N may be found in the US literature, such as Gaussian or Bernoulli random vectors. We denote hereafter by R the compressive ratio of the measurements, that is, R = M/N . Recovering r from y is guaranteed by the theory of CS, provided that: (i) r is compressible in a known basis Ψ, i.e.the vector a∈ RN such as r = Ψa is sparse, and (ii) Φ and Ψ are incoherent [15]. The classical reconstruction process consists in solving the following minimization problem in order to recover the sparse representation a of the RF image:
min a∈RNkak1 + 1 2µky − ΦΨak 2 2 (2)
Fig. 1 shows a toy example of CS applied to US imaging, corresponding to a random sampling scheme obtained by projecting the initial image on Bernoulli random vectors [3].
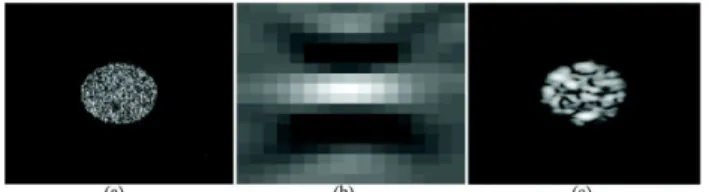
Fig. 2: Example of 2D convolutive model in US imaging. From left to right: the tissue reflectivity function, the 2D ultrasound PSF and the ultrasound image.
B. Deconvolution
Similar to most imaging systems, ultrasound scanners are only able to produce images with a limited spatial resolution and contrast. This degradation, caused by several physical phe-nomena mainly related to US wave propagation, is classically formulated as a convolutive model between a ”clean” image termed tissue reflectivity function (TRF) and the system point spread function (PSF):
r =Hx + n (3)
where r, x, n ∈ RN are respectively the RF image, the TRF and a zero-mean additive white Gaussian noise in lex-icographical order. H ∈ RN ×N is a block circulant with circulant blocks matrix associated with the 2D PSF. Without loss of generality, in this paper, the PSF is considered spatially invariant or block spatially invariant, as in most of the existing literature on US deconvolution. Recovering the TRF from the RF image is well-known to be an ill-posed problem. Thus, to solve (3), one needs to consider a regularization term in the optimization process. In US imaging, the regularization results from statistical assumptions on the TRF, such as Gaussian, generalized Gaussian or Laplacian distributions [10, 11, 13]. In this paper, without loss of generality, we consider the Laplacian prior. In this case, the deconvolution turns into the following optimization problem:
min
x∈RNα kxk1+ kr − Hxk
2
2 (4)
Fig. 2 shows a toy example highlighting the contrast and resolution difference between the TRF, obtained by randomly generating the scatterers [16], and the US image resulting from the convolution between the TRF and an US 2D PSF.
III. PROPOSEDMETHOD
Our method, denoted by compressive deconvolution, aims at recovering the TRF directly from the compressed random measurements. The direct model considered regroups the two linear models in (1) and (3). The TRF is thus related to the CS random measurement as follows:
y = ΦHx + n (5)
Intuitively, a straightforward way to solve the compressive deconvolution problem, illustrated in Fig. 3, is to proceed
Fig. 3: Diagram highlighting the difference between an in-tuitive sequential approach and the proposed compressive deconvolution framework.
in two sequential steps: (i) recover the RF image from the compressed measurements following (2), (ii) reconstruct the TRF from the previously estimated RF data following (4). Instead, we propose to jointly estimate both the RF image and the TRF by solving the most challenging inverse problem given hereafter: min x∈RNk Ψ −1Hx k1+α kxk 1+ 1 2µ k y − ΦHx k 2 2 (6)
The objective function above is the sum of three terms. The last one is the data fidelity term and evaluates the ℓ2-norm of the residual between the compressed measurements y and the linear model in (5), where the noise was considered as additive Gaussian. The first term is imposing the sparsity of the reconstructed RF dataHx in the transformed domain. Its role is similar to the regularization term considered in (2). The purpose of the second term of the proposed objective function (6) is to regularize the estimated TRF through a statistical Laplacian prior.
We have recently proposed an optimization scheme able to solve a more general problem than (6), where theℓ1-norm of x was replaced by a more generalℓp-norm withp between 1 and 2 [17]. Based on the alternating direction method of multipliers (ADMM) [18], the solution of (6) is obtained through an iterative process updating at each iteration the estimates of the TRF, of the RF image and of the Lagrange multiplier.
IV. SIMULATIONRESULTS A. Synthetic data
The synthetic RF image is simulated following the proce-dure proposed in [16]. Starting from a cartoon image (mask), the tissue reflectivity function (TRF) which is a scatterer map containing Laplacian-distributed pixels weighted by the amplitudes of the mask was generated. The RF image was obtained by convolving the TRF with a 2D PSF previously simulated with Field II [19]. The resulting TRF and RF images, both visualized in the B-mode (computed through envelope detection and log-compression), are shown in Fig. 4 (a) and (d). Furthermore, the RF image is projected on a structured random matrix in order to generate the CS data. This operation results into a reduction of the available data corresponding to the compressive ratios between 20% and 80% in our simulations. The final measurements have been corrupted by an additional white zero-mean Gaussian noise corresponding to a SNR of 40 dB.
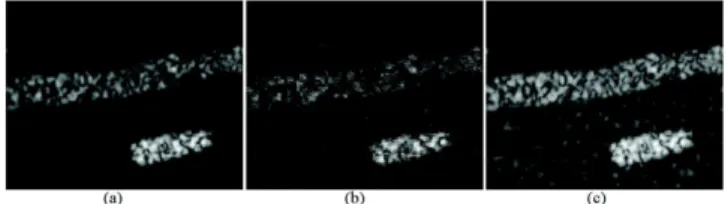
Fig. 4: TRF reconstruction. (a) Original TRF; (b-c) TRF estimates using the sequential method with compressive ratios of 60% and 20%; (d) Original RF image; (e-f) Reconstruction results using the proposed method with compressive ratios of 60% and 20%.
B. Quality metrics
We remind that our compressive deconvolution method allows to jointly recover the RF image and reconstruct the TRF. Both estimations are evaluated using the peak signal to noise ratio (PSNR) and the structural similarity (SSIM) [20] between the reconstructed images and their corresponding ground truth. We refer hereafter to PSNR and SSIM when dealing with the TRF and to BPSNR (blurred PSNR) and BSSIM (blurred SSIM) for the RF images.
C. Compressive deconvolution results
In this section, we compare the results with the proposed method to the ones obtained using the sequential approach schematically shown in Fig. 3. With the sequential method, YALL1 [21] and Forward-Backward Spliting methods [22] have been adopted to solve the optimization problems asso-ciated with the CS and the deconvolution steps respectively, that is, the eq.(2) and eq.(4). The reconstructed TRFs for compressive ratios R of 20% and 60% are shown in Fig. 4. One may visually evaluate the superiority of the proposed method compared to the sequential approach. The same trend may be observed in Fig. 5 that shows the original RF image and the ones recovered using YALL1 and our approach.
The quantitative results reported in Table I confirm the visual impression and prove the interest of our compressive deconvolution. As expected, the reconstruction is more robust when the compressive ratio R is high, given that in this case more measurements are available. Compared to the sequential approach, the proposed method allows an improvement of at least 2 dB in PSNR and of around 20% in SSIM.
V. CONCLUSION
This paper introduces a novel framework of compressive deconvolution adapted to ultrasound imaging. In addition to standard compressive sampling reconstruction, our approach
Fig. 5: RF image reconstruction for a compressive ratio of 20%. From left to right: the original RF image, the CS reconstruction using YALL1, the RF image recovered using the proposed method.
TABLE I: Reconstruction quality assessment. The PSNR and BPSNR are expressed in dB. R = M/N represents the compressive ratio. methods R 0.2 0.4 0.6 0.8 1 Sequential PSNRSSIM 22.4631.27 23.5439.60 25.1859.86 25.2261.36 25.4361.76 BPSNR 23.64 29.24 34.35 41.50 59.72 BSSIM 46.91 64.19 84.92 96.40 99.93 Proposed PSNRSSIM 24.6051.65 27.0169.07 28.3477.44 29.1481.58 29.8184.23 BPSNR 43.01 49.21 53.28 56.59 60.87 BSSIM 96.61 99.29 99.73 99.88 99.95
takes into account the intrinsic degradation of US images mod-eled by the influence of the PSF. The linear model combines the random linear measurement matrix specific to CS and a 2D convolution operator specific to US imaging. Then, it is inverted taking into account statistical prior information on the images to be recovered.
Simulation results show: (i) the interest of our method to recover enhanced US images from compressed measurements and (ii) its superiority compared to an intuitive approach soving sequentially the CS reconstruction and the image deconvolution.
ACKNOWLEDGMENT
This work was partially supported by ANR-11-LABX-0040-CIMI within the program ANR-11-IDEX-0002-02 of the University of Toulouse and CSC (Chinese Scholarship Council).
REFERENCES
[1] D. L. Donoho, “Compressed sensing,” Information The-ory, IEEE Transactions on, vol. 52, no. 4, pp. 1289–1306, 2006.
[2] E. J. Cand`es, J. Romberg, and T. Tao, “Robust uncer-tainty principles: Exact signal reconstruction from highly incomplete frequency information,” Information Theory, IEEE Transactions on, vol. 52, no. 2, pp. 489–509, 2006. [3] C. Quinsac, A. Basarab, and D. Kouam´e, “Frequency domain compressive sampling for ultrasound imaging,” Advances in Acoustics and Vibration, vol. 2012, 2012. [Online]. Available: http://dx.doi.org/10.1155/2012/231317
[4] M. F. Schiffner and G. Schmitz, “Pulse-echo ultrasound imaging combining compressed sensing and the fast mul-tipole method,” in Ultrasonics Symposium (IUS), 2014 IEEE International. IEEE, 2014, pp. 2205–2208. [5] T. Chernyakova and Y. C. Eldar, “Fourier-domain
beam-forming: the path to compressed ultrasound imaging,” Ul-trasonics, Ferroelectrics, and Frequency Control, IEEE Transactions on, vol. 61, no. 8, pp. 1252–1267, 2014. [6] A. Achim, A. Basarab, G. Tzagkarakis, P. Tsakalides,
and D. Kouame, “Reconstruction of ultrasound rf echoes modeled as stable random variables,” Computational Imaging, IEEE Transactions on, vol. 1, no. 2, pp. 86– 95, June 2015.
[7] J. Richy, D. Friboulet, A. Bernard, O. Bernard, and H. Liebgott, “Blood velocity estimation using compres-sive sensing,” IEEE Transactions on Medical Imaging, vol. 32, no. 11, pp. 1979–1988, 2013.
[8] A. Basarab, C. Quinsac, J.-M. Girault, and D. Kouam´e, “Compressive-Sensing-based Multidimensional Doppler signal analysis for fetal activity monitoring (regular paper),” in IEEE International Ultrasonics Symposium, Chicago, 03/09/2014-06/09/2014. http://www.ieee.org/: IEEE, septembre 2014, pp. 1073–1076. [Online]. Available: http://oatao.univ-toulouse.fr/13081/
[9] O. Lorintiu, H. Liebgott, M. Alessandrini, O. Bernard, and D. Friboulet, “Compressed sensing reconstruction of 3D ultrasound data using dictionary learning and line-wise subsampling,” IEEE Transactions on Medical Imaging, vol. accepted, 2015.
[10] T. Taxt and J. Strand, “Two-dimensional noise-robust blind deconvolution of ultrasound images,” Ultrasonics, Ferroelectrics and Frequency Control, IEEE Transac-tions on, vol. 48, no. 4, pp. 861–866, 2001.
[11] M. Alessandrini, S. Maggio, J. Por´ee, L. De Marchi, N. Speciale, E. Franceschini, O. Bernard, and O. Basset, “A restoration framework for ultrasonic tissue charac-terization,” Ultrasonics, Ferroelectrics, and Frequency Control, IEEE Transactions on, vol. 58, no. 11, pp. 2344– 2360, 2011.
[12] R. Morin, S. Bidon, A. Basarab, and D. Kouame, “Semi-blind deconvolution for resolution enhancement in ultra-sound imaging,” in Image Processing (ICIP), 2013 20th IEEE International Conference on, Sept 2013, pp. 1413– 1417.
[13] N. Zhao, A. Basarab, D. Kouam´e, and J.-Y. Tourneret, “Restoration of ultrasound images using a hierarchical bayesian model with a generalized gaussian prior,” in in Proc. Int. Conf. Image Process.(ICIP2014), Paris, France, 2014.
[14] B. Amizic, L. Spinoulas, R. Molina, and A. K. Katsagge-los, “Compressive blind image deconvolution,” Image Processing, IEEE Transactions on, vol. 22, no. 10, pp. 3994–4006, 2013.
[15] E. J. Cand`es and M. B. Wakin, “An introduction to com-pressive sampling,” Signal Processing Magazine, IEEE, vol. 25, no. 2, pp. 21–30, 2008.
[16] J. Ng, R. Prager, N. Kingsbury, G. Treece, and A. Gee, “Wavelet restoration of medical pulse-echo ultrasound images in an em framework,” Ultrasonics, Ferroelectrics, and Frequency Control, IEEE Transactions on, vol. 54, no. 3, pp. 550–568, 2007.
[17] Z. Chen, N. Zhao, A. Basarab, and D. Kouam´e, “Ul-trasound compressive deconvolution with lp-norm prior (regular paper),” in European Signal and Image Process-ing Conference (EUSIPCO), Nice, France, 31/08/2015-04/09/2015, 2015.
[18] S. Boyd, N. Parikh, E. Chu, B. Peleato, and J. Eckstein, “Distributed optimization and statistical learning via the alternating direction method of multipliers,” Found. Trends Mach. Learn., vol. 3, no. 1, pp. 1–122, Jan. 2011. [Online]. Available: http://dx.doi.org/10.1561/2200000016
[19] J. A. Jensen, “A model for the propagation and scattering of ultrasound in tissue,” Acoustical Society of America. Journal, vol. 89, no. 1, pp. 182–190, 1991.
[20] Z. Wang, A. C. Bovik, H. R. Sheikh, and E. P. Simoncelli, “Image quality assessment: from error visibility to struc-tural similarity,” Image Processing, IEEE Transactions on, vol. 13, no. 4, pp. 600–612, 2004.
[21] J. Yang and Y. Zhang, “Alternating direction algorithms for l1-problems in compressive sensing,” SIAM journal on scientific computing, vol. 33, no. 1, pp. 250–278, 2011.
[22] P. L. Combettes and V. R. Wajs, “Signal recovery by proximal forward-backward splitting,” Multiscale Mod-eling & Simulation, vol. 4, no. 4, pp. 1168–1200, 2005.